Abstract
A novel anionic surfactant bound monolithic stationary phase based on 11-acrylaminoundecanoic acid (AAUA) is designed for capillary electrochromatography (CEC). The monolith possessing bonded undecanoyl groups (hydrophobic sites) and carboxyl groups (weak cationic ion-exchange sites) was evaluated as a mixed-mode stationary phase in CEC for the separation of neutral and polar solutes. Using a multivariate D-optimal design the composition of the polymerization mixture was modeled and optimized with five alkylbenzenes (ABs) and seven alkyl phenyl ketones (APKs) as test solutes. The D-optimal design indicates a strong dependence of electrochromatographic parameters on the concentration of AAUA monomer and porogen (water) in the polymerization mixture. A difference of 6%, 8% and 13% RSD between the predicted and the experimental values in terms of efficiency, resolution, and retention time, respectively, indeed confirmed that the proposed approach is practical. The physical (i.e., morphology, porosity and permeability) and chromatographic properties of the monolithic columns were thoroughly investigated. With the optimized monolithic column, high efficiency separation of N-methylcarbamates (NMCs) pesticides and positional isomers was successfully achieved. It appears that this type of mixed-mode monolith (containing both chargeable and hydrophobic sites) may have a great potential as a new generation of CEC stationary phase.
Keywords: 11-acrylaminoundecanoic acid (AAUA) monomer, D-optimal design, Mixed-mode stationary phase, Physical and chromatographic properties, Pesticides and isomer separation
1 Introduction
Capillary electrochromatography (CEC) using monolithic columns has been a flourishing field of research as an alternative to the traditional packed column CEC for almost a decade. The main advantages of monolithic columns over the particle-based packed capillary columns are: the uncomplicated procedures for column preparation, the flexibility in tuning column’s pore structure, the elimination of the need for frits, the availability of various functional monomers for selective separation, and the exclusion or reduction of bubble formation during operation. Moreover, the lack of intraparticular void volume in the monolith improves mass transfer and separation efficiency, allowing for fast, high-quality separations [1–4]. Hence, the use of monolithic columns has increased and new stationary phases as well as column preparation procedure are being explored. Furthermore, a large number of new and attractive chromatographic application have been developed in biological [5–11], environmental [12–14] and pharmaceutical [15–19] analysis, which may benefit from using monolithic column. In addition, the main advantage of CEC over micro HPLC is the electrically driven flow, which generates a flat flow profile and provides sharper peaks and better efficiencies for small molecule separations. While, in micro HPLC, the flow profiles are parabolic leading to band broadening. Hence efficiencies seen in micro HPLC are not as good as those obtained from CEC.
The stationary phase used in CEC play a dual role, both providing sites for the desired interaction with analytes and also sites for generating EOF. For the preparation of methacrylate-based monolith used in CEC, an additional charge-bearing monomer, such as 2-acrylamido-2-methyl-1-propanesulfonic acid, is often used to provide stable EOF in addition to the functional monomer [2, 20–23]. While the methacrylate-based monolithic column prepared using a charge-bearing hydrophobic monomer is rarely reported, the optimization of this kind of monolithic column should be much easier.
A major problem of organic polymer monoliths lies in the great dependence of their properties on the composition of the polymerization mixture [3, 24]. Furthermore, it was conceived that the column performance significantly depend on the morphology of the monolithic material [2, 25–27]. For polymer monolithic column, it is the combined pore size and the average size of the microglobules, which greatly influences the performance of the column. Eventually the composition of the polymerization mixture controls the pore structure of the monolith [28, 29]. Therefore, to explore a new monolith with appropriate physical and chromatographic properties, the preliminary work should optimize the composition of the polymerization mixture.
Traditionally, optimization of the monolithic column is often done by varying one-factor-at-a-time while keeping the others constant (i.e., univariate approach). Unfortunately, the univariate approach fails when interaction of more than one factor is involved. Hence, the approach does not guarantee a global optimum and often results in less than optimum monolithic phase. Multivariate optimization using design of experiment is a useful tool, which allows more efficient way to identify the experimental factors in monolithic column preparation in CEC. This method has been more and more widely used in various fields for methodology studies [24, 30–36]. However, to the best of our knowledge, there is only one report on the application of multivariate experimental design for the preparation of monolithic column [24].
The purpose of this study was to investigate the potential of a novel surfactant-bound monolithic column. 11-acrylamidoundecanoic acid (AAUA), which contains undecanoyl group that provide hydrophobic interaction site and a chargeable carboxyl group to be used as a functional monomer. Hence, additional charge bearing monomers (i.e., charging molecules or chargeable molecules) do not need to be added to the polymerization mixture. Besides generating EOF, the carboxyl group also provides weak cation exchange interaction, which makes this new monolith a mixed-mode stationary phase for CEC separation of small molecules. The essential parameters (monomer, crosslinker and porogens), which influence the chromatographic performance of the monolith were systemically evaluated and optimized by D-optimal experimental design. To the best of our knowledge, this is the first time a D-optimal design method is introduced to optimize the polymerization condition of monolithic columns in CEC. The adequacy of polymerization model was then validated by the experimental run at the predicted conditions. The physical properties of the monoliths such as morphology, porosity, permeability and mechanical stability were evaluated using various analytical techniques. Furthermore, the unique selectivity of the AAUA monolith was tested using small non polar molecules (e.g., alkylbenzenes (ABs) and alkyl phenyl ketones (APKs)) and small polar molecules (e.g., polar pesticides) as well as positional isomers separation in CEC.
2 Materials and methods
2.1 Chemicals and standards
The reagents ethylene dimethacrylate (EDMA), 1-propanol, 2,2′-azobisisobutyronitrile (AIBN), 11-aminoundecanoic acid were purchased from Aldrich (Milwaukee, WI, USA); γ-methacryl-oxypropyltrimethoxysilane, acryloyl chloride and standards of N-methyl-carbamates (NMCs), alkylbenzenes (ABs, with side chains ranging from methyl to butyl group) and alkyl phenyl ketones (APKs, with side chains ranging from methyl to octyl group) were obtained from Sigma (St. Louis, MO, USA). 1, 4-butanediol, butyl methacrylate were purchased from Fluka (Buchs, Switzerland). All the reagents were used as received except for the EDMA, which was purified by distillation under vacuum prior to use.
2.2 Synthesis of 11-acrylamidoundecanoic acid (AAUA)
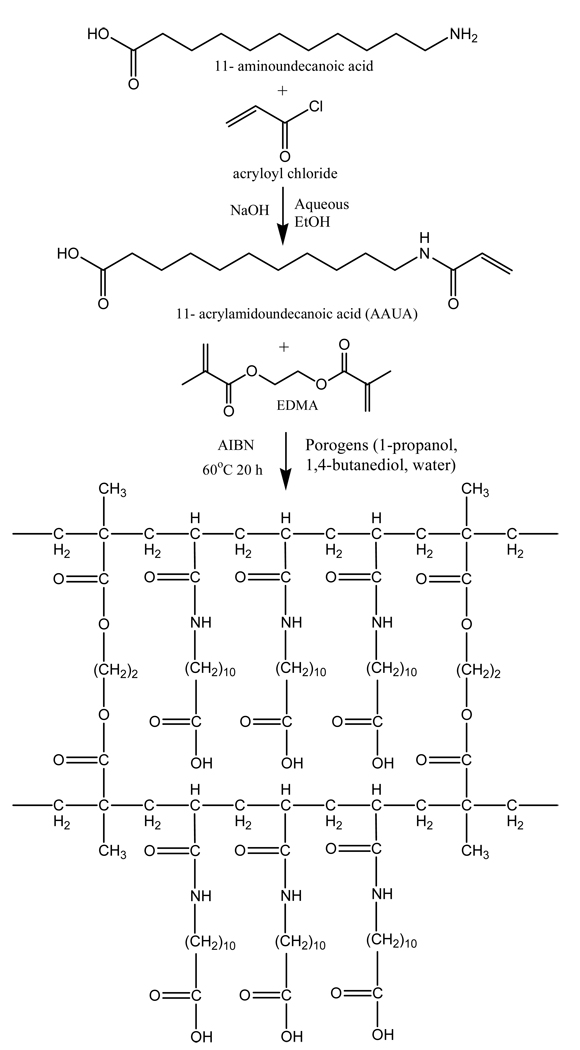
Figure 1 show the reaction involved in the synthesis of AAUA [37]. First, an aqueous solution of ethanol (250 mL absolute ethanol /35 mL distilled water) was used to dissolve 10 g of 11-amino-undecanoic acid. To this solution, 6 g of NaOH was added slowly until a clear solution is obtained. Next, 6 mL of acryloyl chloride was added dropwise and the reaction mixture stirred for approximately three hours at just below 10 °C, after which it was filtered. The filtrate was acidified with diluted hydrochloric acid and washed with triply deionized water. The white precipitate formed was collected after filtration. The crude product was recrystallized from aqueous ethanol, filtered and dried by lyophilization. The purity of AAUA was checked by electrospray ionization mass spectrometry (ESI-MS), 1H NMR and elemental analysis.
Figure 1.
Synthetic scheme for the preparation of monomer AAUA and crosslinking structure of the monolith poly (AAUA-co-EDMA).
2.3 Preparation of monolithic columns
For the preparation of stationary phases the inner walls of the capillaries were vinylzed with 3-(trimethoxylsilyl)propyl methacrylate. The procedure can be found elsewhere [38, 39]. Subse-quently, AAUA, EDMA, 1-propanol, 1,4-butanediol, water, and AIBN were mixed ultrasonically into a homogenous solution and purged with nitrogen for 10 min. A 45 cm long silanized capillary was filled with the polymerization mixture up to a length of 35 cm, sealed with rubber septum, and then placed in a GC oven to polymerize for 20 h at 60 °C. The ternary porogenic system including 1,4-butanediol, 1-propanol and water were borrowed from previous work [40]. The reaction scheme for the polymerization is shown in Figure 1. Every column required by the experimental design was made in duplicate. After the polymerization was completed, the monolithic column was washed with methanol for 12 h using a HPLC pump to remove unreacted monomers and porogens. An on-column detection window was made next to the polymer bed using a thermal wire stripper. Finally, the column was cut to 45 cm with an effective length of 30 cm.
2.4 Morphology, pore size and surface area measurements
The microscopic morphology of the monoliths was evaluated using scanning electron microscope with the aid of a Hitachi X-650 (Hitachi, Japan) SEM apparatus at 7.5 kV and a filament current of 40 mA. Monolithic column samples were fractured, cut to a length of 2 mm, and placed on an aluminum stub by means of double sided carbon tape. Next, they were sputter-coated with a gold/palladium alloy using a SPI Sputter (SPI Supplies Division of Structure Probe, West Chester, PA, USA) for 1 min at 30 mA to prevent charging.
Pore-size distributions data were obtained by AutoPore IV 9500 mercury intrusion porosimetry (MIP, Mciromeritics instrument corporation, GA, USA). Surface area data were obtained by nitrogen adsorption measurements performed on Micromeritics TriStar 3000 (Mciromeritics instrument corporation, GA, USA). The specimens for the measurement of pore-size distribution and surface area were prepared in parallel polymerization in glass vials under the same conditions with the same mixtures. Once the polymerization was completed, Soxhlet extraction of the monolith was carried out with methanol for 24 h. After drying the monoliths at 70 °C for 24 h under vacuum, nitrogen adsorption and mercury intrusion porosimetry experiments were performed.
2.5 CEC instrumentation
All of the electrochromatographic experiments were carried out using an Agilent CE system (Agilent Technologies, Palo Alto, CA) equipped with an autosampler, a diode-array detector, 0–30-kV high-voltage power supply and Chemstation software (V9.0) for system control and data acquisition. A Series III HPLC pump (Lab Alliance, State College, PA, USA) was used for washing and equilibrating the monolithic columns with different mobile phases. Fused silica capillary (OD 375 µm, ID 100 µm) was obtained from Polymicro Technologies Inc. (Phoenix, AZ, USA).
2.6 CEC conditions
The separation voltage was +25 kV, and a pressure of 12 bar was applied at both ends during the separation. The mobile phase consisted of 60% (v/v) ACN and 40% (v/v) 5 mmol/L phosphate buffer (pH=7.0). Before use, the mobile phase was filtered through a 0.2-µm membrane. Samples were injected at +5 kV for 3 s, and the column temperature was kept at 25 °C. The UV detection wavelength was set to 214 nm.
2.7 Calculations
The resolution (Rs) and efficiency (N) were calculated by the chemstation software (Agilent Technologies, Palo Alto CA).
The EOF velocity, ueof, was calculated using the equation (1):
| (1) |
The porosity of the monolith prepared in capillary was examined by a flow method [41]. Briefly, the mobile phase linear velocity was measured by an unretained neutral compound (thiourea) and the volumetric flow rate was also measured. Then with the known empty tube dimension, the total porosity εT was calculated using the following equation (2):
| (2) |
Where εT is the total porosity. V (m3/s) is the volumetric flow rate of mobile phase. r (m) is the inner radius of the empty column. U (m/s) is the linear velocity of mobile phase, which was determined by unretained compound thiourea. The average value of the porosities obtained at different flow rates was regarded as the total porosity of the monolith.
The permeability of a porous medium is a measure of its capacity to transmit a fluid driven by an imposed pressure drop. Darcy’s law linking with the solvent viscosity and column porosity leads to the definition of the specific permeability K0 was calculated as equation (3):
| (3) |
Where u (m/s) is the linear velocity of eluent, η (Pa•s) is the dynamic viscosity of eluent, L (m) is the effective column length and Δp (Pa) is the pressure drop [42].
2.8 Experimental design
Design-Expert (version 7.0.3, Stat-Ease, Inc. Minneapolis, MN) was used to generate D-optimal experimental design, data processing (statistical calculations), contour plots and optimum conditions. The D-optimal design variables include five factors: A: concentration of the crosslinker (%EDMA), B: concentration of the monomer (%AAUA), C: concentrations of the porogens 1-propanol (%1-propanol), D: concentration of 1,4-butanediol (%1,4-butanediol) and E: concentration of water (%water) [29]. The constraints and the levels of the factors are listed in Table 1. Two homologous series of small molecular weight solutes, ABs and APKs were used as model test analytes. Average resolution (Rs(avg)), analysis time (tR, measured as the retention time of the last homologue of ABs and APKs) and average efficiency (Navg) of these two series analytes were used as the responses (Table 2). All the data obtained from the actual experiments were input into the Design-Expert software. After which the data were fitted into linear model which was chosen based on the F-test and lack-of-fit test. The observed effects were tested for significance using analysis of variance (ANOVA). The 2-D contour plots were created by the software to show the interactions between significant factors. Finally, the optimum combination of all variables was detected using option of Derringer’s desirability function available in Design-Expert software.
Table 1.
D-optimal design and the level of factors used for the optimization of alkylbenzenes (ABs) and alkyl phenyl ketones (APKs) homologues series
| Variable factors1 | Levels | |
|---|---|---|
| Lower limit (−1) | Upper limit (+1) | |
| A: %EDMA | 18.5% | 21.3% |
| B: %AAUA | 1.8% | 7.0% |
| C: %1-propanol | 60.0% | 74.0% |
| D: %1,4-butanediol | 0 | 12.0% |
| E: %Water | 2.0% | 12.0% |
Restriction: A+B+C+D+E=99.5%, 0.5% fixed AIBN.
Table 2.
Efficiency, resolution and total run time data gathered from the D-optimal experimental design run order for multivariate optimization of surfactant based monolithic columns
| Monolithic Column No. |
Variable factors | Responses | |||||||||
|---|---|---|---|---|---|---|---|---|---|---|---|
| Alkylbenzenes | Alkyl phenyl ketones | ||||||||||
| EDMA (%) |
AAUA (%) |
1-propanol (%) |
1,4-buta nediol (%) |
Water (%) |
Rs(avg)a |
tRb (min) |
Navgc (plates/m) |
Rs(avg)a |
tRb (min) |
Navgc (plates/m) |
|
| 1 | 21.3 | 7.0 | 60.0 | 0 | 11.2 | 2.2 | 18.8 | 73,000 | 3.5 | 22.6 | 72,400 |
| 2 | 19.9 | 1.8 | 60.0 | 5.8 | 12.0 | 0.7 | 4.8 | 5,000 | 1.0 | 6.4 | 4,500 |
| 3 | 18.5 | 7.0 | 60.0 | 2.0 | 12.0 | 2.6 | 15.4 | 92,100 | 3.1 | 18.9 | 88,900 |
| 4 | 21.3 | 7.0 | 69.2 | 0 | 2.0 | 1.0 | 6.6 | 5,400 | 1.0 | 9.3 | 5,300 |
| 5 | 19.9 | 1.8 | 63.8 | 12 | 2.0 | d | 3.4 | e | d | 5.1 | e |
| 6 | 21.3 | 4.2 | 60.0 | 12 | 2.0 | 0.6 | 8.9 | 5,400 | 1.0 | 6.8 | 5,100 |
| 7 | 21.3 | 1.8 | 74.0 | 0.2 | 2.2 | d | 1.0 | e | d | 0.8 | e |
| 8 | 18.5 | 1.8 | 67.2 | 0 | 12 | 0.6 | 6.0 | 6,000 | 0.9 | 5.7 | 5,700 |
| 9 | 19.2 | 2.9 | 69.6 | 2.1 | 5.7 | d | 1.2 | e | d | 0.8 | e |
| 10 | 18.5 | 7.0 | 60.0 | 2.0 | 12.0 | 2.4 | 14.8 | 108,000 | 3.3 | 17.0 | 98,100 |
| 11 | 19.9 | 1.8 | 63.8 | 12 | 2.0 | d | 1.4 | e | d | 0.9 | e |
| 12 | 21.3 | 1.8 | 74.0 | 0.2 | 2.2 | d | 1.1 | e | 0.1 | 0.9 | e |
| 13 | 21.3 | 4.2 | 60.0 | 12 | 2.0 | 0.4 | 3.3 | 3,000 | 0.3 | 4.3 | 2,000 |
| 14 | 18.5 | 7.0 | 72.0 | 0 | 2.0 | 0.8 | 5.9 | 7,100 | 0.8 | 6.2 | 6,600 |
| 15 | 19.9 | 3.6 | 74.0 | 0 | 2.0 | d | 1.4 | e | d | 1.0 | e |
| 16 | 18.5 | 7.0 | 60.0 | 12 | 2.0 | 0.8 | 3.4 | 3,700 | 1.1 | 4.4 | 3,300 |
| 17 | 21.3 | 4.0 | 62.2 | 0 | 12.0 | 1.7 | 9.7 | 25,100 | 3.0 | 16.4 | 22,700 |
| 18 | 19.2 | 2.9 | 64.4 | 3.9 | 9.1 | 0.6 | 3.5 | 4,800 | 0.7 | 4.2 | 4,700 |
| 19 | 19.2 | 4.2 | 62.6 | 8.1 | 5.4 | 0.4 | 2.5 | 7,400 | 0.6 | 3.3 | 6,800 |
| 20 | 18.5 | 1.8 | 60.0 | 12 | 7.2 | 0.5 | 3.8 | 4,600 | 0.6 | 4.1 | 4,200 |
| 21 | 18.5 | 1.8 | 69.6 | 7.6 | 2.0 | d | 1.5 | -- | d | 0.6 | e |
| 22 | 18.5 | 7.0 | 67.0 | 0 | 7.0 | 2.1 | 14.3 | 52,300 | 3.3 | 18.1 | 51,200 |
| 23 | 18.5 | 7.0 | 66.0 | 6.0 | 2.0 | 0.5 | 2.4 | 4,400 | 0.6 | 3.0 | 3,200 |
| 24 | 21.3 | 7.0 | 69.2 | 0 | 2.0 | 0.9 | 7.7 | 6,200 | 1.2 | 9.0 | 5,600 |
| 25 | 19.8 | 7.0 | 62.9 | 2.9 | 6.9 | 1.8 | 7.2 | 29,000 | 2.5 | 8.9 | 26,400 |
Rs(avg) is the average resolution of the five ABs or six APKs.
tR is the retention time of the last peak of ABs or APKs.
Navg is the average efficiency taken from the first four peaks of the ABs or APKs;
No efficiency reported due to zero resolution.
3 Results and discussion
Figure 1 shows the scheme for synthesis of AAUA monomer and the subsequent polymerization for monolith formation. As shown, the synthesized AAUA monomer has a C11 long hydrocarbon chain to provide hydrophobic interaction, the acrylamido terminated polymerizable group and a carboxyl group providing chargeable site, which is necessary in CEC to produce EOF. This kind of monolith is very beneficial because it eliminates the need of introducing ionizable monomers in addition to the functional monomer.
3.1 Experimental design
3.1.1 Parameters for D-optimal experimental design
According to previous studies [2, 3, 24], varying the ratio of the components of the polymerization mixture generates monolithic columns with different properties (e.g., physical properties and chemical properties), from which different retention performances are expected. The D-optimal design is very appropriate for cases where some of the factors can only be varied over a restricted area. Hence, generating an irregular experimental domain in which orthogonality is not obtained [43]. In this study, composition of polymerization mixture is subjected to such restrictions, and based on this rationale a D-optimal design was used [44].
The %AAUA, %EDMA, %1-propanol, %1,4-butanediol and %water within the polymerization mixture were set as variable factors in the experimental design. The constraints for all the factors summarized in Table 1 were set based on preliminary experiments. The %EDMA in the polymerization mixture was set in the range of 18.5% to 21.3%. When %EDMA was below 18.5%, the generated monolith was found to have poor mechanical stability. On the other hand, %EDMA higher than 21.3% was not effective for the permeability of the monolith. The concentration range of the AAUA monomer was also determined by the preliminary studies. It was found that when the %AAUA was higher than 7.0%, it results in an inhomogeneous polymerization mixture. Therefore, 7.0% AAUA was set as the upper limit. When the %AAUA was lower than 1.8%, the monolithic column demonstrated poor performance in CEC separation. The range of %1-propanol (60.0%–74.0%) was set according to previous studies [20, 21, 24, 45]. For 1,4-butanediol, higher than 12.0% provided an inhomogeneous monolith matrix. Hence, the %1,4-butanediol was set from 0% to 12%. As for the water content, it was found that the %water lower than 2.0%, gives poor resolution in CEC. However, higher than 12.0%, provides an inhomogenous polymerization mixture. Nevertheless, the total concentration of the five components was kept at 99.5% and the initiator, AIBN, was fixed at 0.5%. A total of five design variables were studied at two levels, and this resulted in a final experimental matrix consisting 25 experiments.
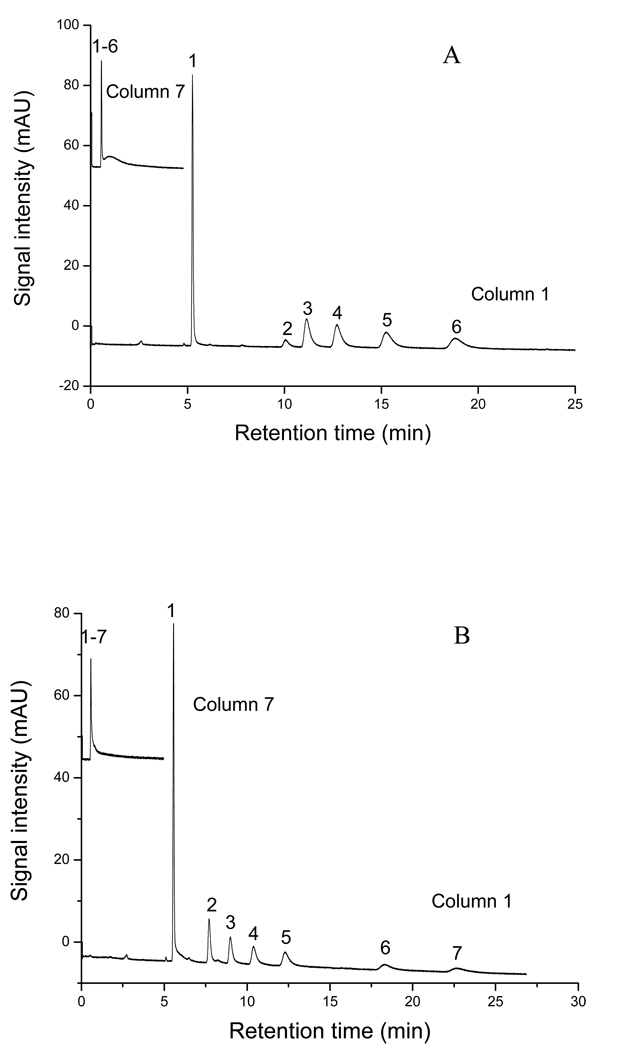
Table 2 demonstrates the 25-run experimental plan and the responses. The Rs(avg), tR and Navg were used as the responses to evaluate the performance of the monolithic columns. The ranges of Rs (avg) were found to be from 0 to 2.6 for ABs and 0 to 3.5 for APKs, whereas Navg ranged from 3,000 to 108,000 plates/m for ABs and 3,200 to 98,100 plates/m for APKs. In addition, the tR were as short as 1.0 min and 0.8 min and as long as 18.8min to 22.6 min, respectively, for ABs and APKs. Figure 2A–B shows two of the representative electrochromatograms for the ABs and APKs homologous series obtained from the D-optimal design experiments (i.e., experiment 1 and experiment 7, Table 2), respectively. The experiment 7 represents one of the worst results among all experiments because it showed almost no separation of ABs or APKs homologous at all. However, experiment 1 demonstrated the best resolution for the two classes of homologous test mixture. This trend indicated that the composition of the polymerization mixture has a significant effect on the chromatographic performance of the yielded monolith and should be carefully optimized.
Figure 2.
The representative electrochromatograms for separation of ABs (A) and APKs (B) on column 7 and column 1. Conditions: mobile phase, 60% ACN in 5 mM phosphate buffer, pH 7.0; applied voltage, +25 kV; detection, 214nm; sample concentration, 0.8mg/mL; electrokinetic injection, 5 kV, 3 s. Solutes in A: (1) thiourea, (2) benzene, (3) toluene, (4) ethylbenzene, (5) propylbenzene, (6) butylbenzene. Solution in B: (1) thiourea, (2) acetophenone, (3) propiophenone, (4) butyrophenone, (5) valerophenone, (6) heptanophenone, (7) octanophenone.
3.1.2 Validation of models
A model was developed for each of the response parameters. The yielded model is a mathematical equation which is useful for identifying the relative significance of the factors by directly comparing the factor coefficients. For linear regression model, the fitted equation is in the form of equation (4):
| (4) |
where, y is the predicted response. β0 is the intercept; β1, β2, β3, β4, β5 are the coefficients of the five factors (A,B,C,D and E), respectively. Positive interaction coefficients indicate the corresponding factor is directly proportional to the response. On the other hand, the negative interaction coefficients means the factor is inversely proportional to the response, i.e., the bigger the factor, the smaller the response.
The significance of the calculated empirical model was assessed by ANOVA [36], while the validity of the model was confirmed by checking the lack-of-fit of the model. The ANOVA data (including sum of squares, mean square, F-value and Prob>F values) for all the models are listed in supplementary material (Table 1). It should be mentioned that, for Navg the ratio of the maximum response and minimum response are higher than 10 (36 for ABs and 49 for APKs). Hence, the transformation is needed to make the analysis of variance (ANOVA) valid. In our case, base 10 Log was recommended by the software. For each response (i.e., Rs(avg), tR and Log10Navg), the sum of squares of the model and residual error were calculated at first. Next, we obtain the mean square by dividing the sum of squares with the degree of freedom. In addition, the F-value, which is used to compare two sample variances, was calculated by dividing model mean square with residual mean square. Prob>F is the probability value that is associated with the F value. In our case, the ANOVA results (data not shown) revealed that the models are all significant (with a Prob>F value less than 0.05). In addition, the lack-of-fit values are not significant (with a Prob >F value greater than 0.10), which reveals that all the models fit well.
The data listed as supplementary material in Table 1 further revealed that the models for responses (Rs(avg), tR and Log10Navg ) of ABs and APKs are all significant (with a Prob>F value less than 0.05). In addition, note that the lack-of-fit values are not significant, which reveals that all the models fit well. For example, the Rs(avg) of ABs show a "Lack-of-fit F-value" of 7.15, which implies the Lack-of-fit is not significant relative to the pure error. There is a 6.6% chance that a "Lack of Fit F-value" this large could occur due to noise. Non-significant lack of fit means the model gives a good fit.
To further investigate the fitness of the models, the R2 (multiple correlation coefficient), adjusted-R2, predicted-R2 and adequate precision values for the models are also evaluated (Table 2 supplementary material). For a good statistical model, R2 value should be close to 1.0 and difference between adjusted-R2 and predicted-R2 should be within 0.2. For all the models, the three values are all in acceptable range. Furthermore, the “adequate precision value” is an index of the signal to noise ratio and a value bigger than 4 suggests that the model gives a good fit. The “adequate precision values” of the models are in the range of 11 to 16, which indicates that the models can be used to navigate the design space [46].
3.1.3 Effects of the composition of polymerization mixture on the electrochromatographic properties
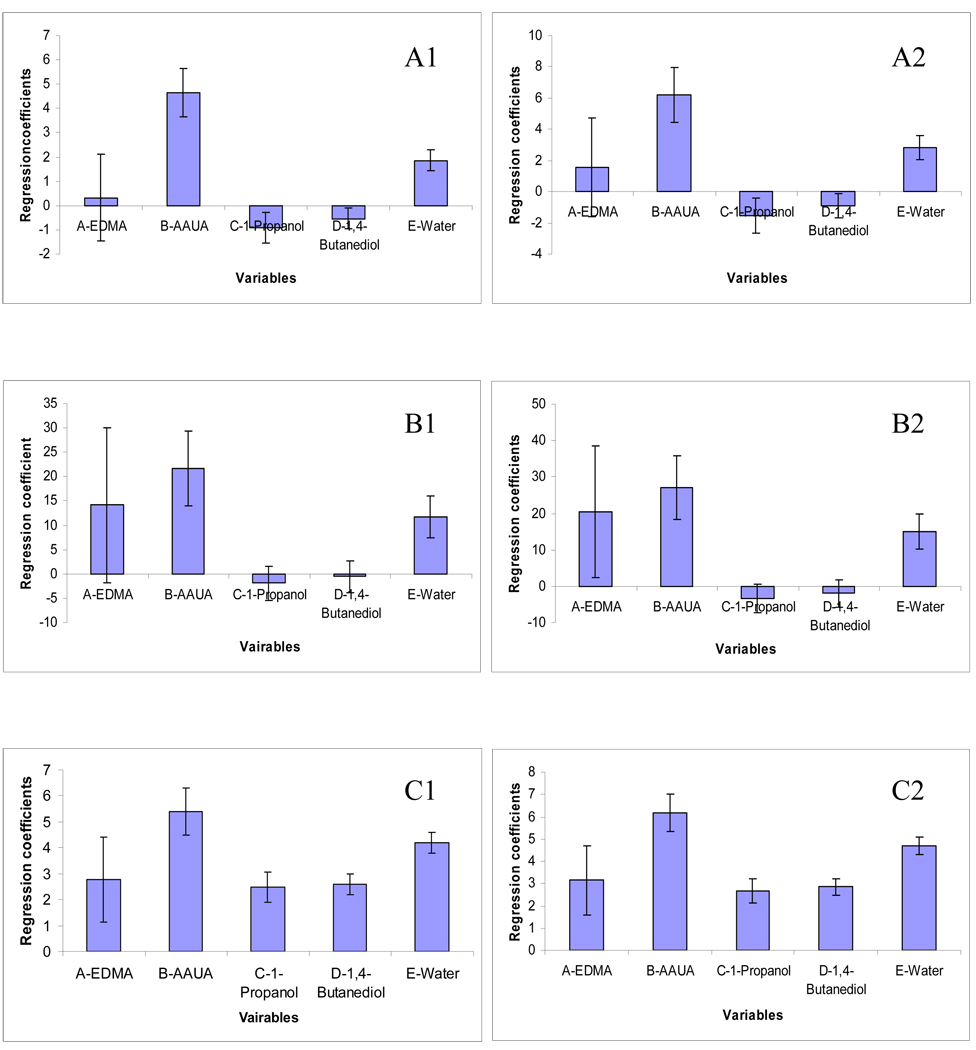
Figure 3 (A1–C1, A2–C2) shows the regression coefficient plots for three responses of ABs and APKs. The 95% confidence interval is expressed in terms of error bar over the coefficient. If the coefficient is smaller than the interval, it indicates that the coefficient is not significantly different from zero. As a result, the corresponding factor is considered to be insignificant.
Figure 3.
The regression coefficients plots of ABs and APKs. A1–A2: Average resolution (Rs(avg)); B1–B2: Analysis time (tR); C1–C2: Average plates number (Log10Navg).
The regression coefficients of the Rs(avg) for both ABs (Figure 3A1) and APKs (Figure 3A2) were evaluated. At least two variables (B: %AAUA, E: %water) were found to be critical to Rs(avg) values for both ABs and APKs. Judging from the absolute height of the bars, it appears that %AAUA has the most significant and positive effect on Rs(avg). This suggests that increasing the %AAUA, there will be more interaction sites on the stationary phase providing higher resolution for the analytes. However, the concentration of crosslinker EDMA has no significant effect on resolution because the 95% coefficient is smaller than the coefficient interval. Hence, there is not much change in the crosslinking ability of EDMA in the studied range. The %water is also significant and its effect was found to be directly proportional to the Rs(avg) of both classes of analytes. On the other hand, the %1-propanol poses a negative effect on the resolution. This trend of porogen composition indicates that at higher concentration of water and lower concentration of 1-propanol, the polarity of the polymerization solution is higher. Thus, the onset of the phase separation in the polymerization solution occurs earlier resulting in the formation of smaller cluster and smaller macropores [8]. Hence, a larger surface area is obtained resulting in higher resolution.
Figure 3B1 and B2 show the model coefficients related to the response parameter (i.e., tR) of ABs and APKs, respectively. It is clear that both %AAUA and %water are significant and had positive effects on the tR. We hypothesized that with the increasing %AAUA, there will be large population of C11 hydrocarbon chains on the surface of monolith. Hence, a stronger hydrophobic interaction between the analytes and stationary phase will cause a stronger chromatographic retention. As mentioned earlier, with the increase of %water, the polarity of the polymerization solution is higher, and the macropores will be smaller. Therefore, the presence of smaller pores will decrease the eluent flow and consequently speed of the analysis [24].
In addition to Rs(avg) and tR, Log10Navg of ABs and APKs was also studied as response. As shown in Figure 3C1 and C2, all the five factors are significant and have positive effects on the separation efficiency. The Log10Navg increased more significantly with the increase of monomer AAUA and porogens (water and 1,4-butanediol). However, the %water has more significant effect on Log10Navg than %1,4-butanediol. Theoretically, Navg depends on the retention time and peak width. An increase of retention time and a decrease of peak width lead to an increase of theoretical plate number. As mentioned earlier, %AAUA and %water pose positive effects on the tR. Therefore, it is reasonable that these two factors also positively affect the Log10Navg. With the increase of %1,4-butanediol, there will be an increase in the polarity of the polymerization solution. Consequently, the polymerization mixture will become less soluble which hastens the phase separation. In this way, smaller clusters are obtained. Hence the %1,4-butanediol plays a positive effect on the separation efficiency.
3.2 Optimum Polymerization Mixture Composition for Separation of ABs and APKs
Highest Rs(avg) and Navg and shortest tR were set as criteria for optimization. From the data shown in Figure 3 and the contour plots (Figure 1, supplementary material), it appears that the polymerization conditions required to optimized Rs(avg) and Navg are in conflict with the values needed to optimize the tR. One way to address this problem is to apply Derringer’s desirability function D(X). This function calculates the geometric mean of all transformed responses in the form of equation (5):
| (5) |
Where, di is the response (in our case, Rs(avg), tR and Navg for ABs and APKs) to be optimized, n is the number (in our case, six) of the response in the mixture design. D is the desirability that ranges from 0 (the least desirable) to 1 (the most desirable). Using the Design Expert software it was possible to obtain the best trade-off between Rs(avg) or Navg and tR for ABs and APKs based on the given criteria.
The characteristics of a goal may be altered by adjusting the importance of different responses. In the desirability objective function D(X), each response can be assigned an importance relative to the other responses. Importance (ri) varies from the least important (a value of 1), to the most important (a value of 5). If varying degrees of importance are assigned to the different responses, the objective function is equation (6):
| (6) |
If all the responses are equally important, the simultaneous objective function reduces to the normal form of desirability.
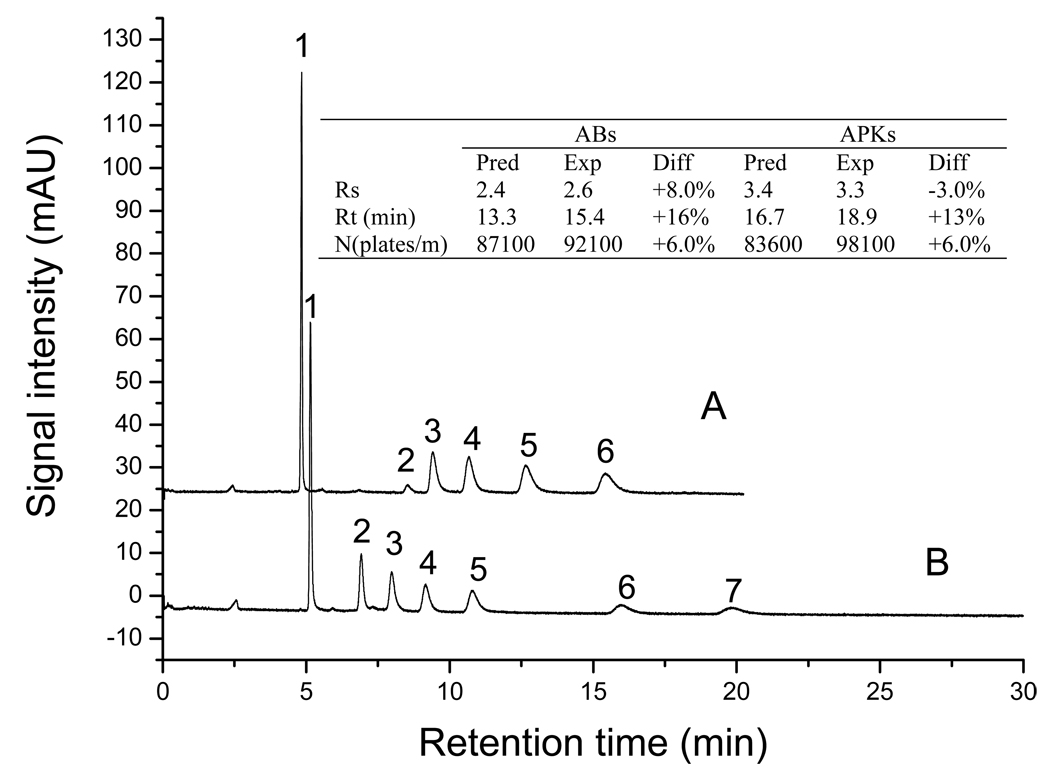
In our optimization study, different importance values were set for the responses. For example, to obtain the best compromise between analysis time vs. resolution or efficiency, an importance value of 3 was set for tR, while for Rs(avg) and Navg importance values were 5. The desired requests were fulfilled by the following solution: 18.5% EDMA, 7.0% AAUA, 60.0% 1-propanol, 2.0% 1,4-butanediol and 12% water. Electrochromatograms of the CEC separation of the ABs and APKs using the optimized monolithic column (column 3) is shown in Figure 4. It is found that five ABs could be completely separated in 15.4 min (Figure 4A) and seven APKs could be separated in 18.9 min (Figure 4B).
Figure 4.
The electrochromatograms for separation of ABs (A) and APKs (B) on optimized column (column 3). Solutes in A: (1) thiourea, (2) benzene, (3) toluene, (4) ethylbenzene, (5) propylbenzene, (6) butylbenzene. Solution in B: (1) thiourea, (2) acetophenone, (3) propiophenone, (4) butyrophenone, (5) valerophenone, (6) heptanophenone, (7) octanophenone. Other conditions are the same as Figure 2. The inset table describes the differences between predicted values and experimental values.
In order to evaluate the feasibility of this experimental design, the differences between the predicted values (obtained from the model) and the experimental values (obtained from the real experimental) with the optimized column were compared. The results are listed in the inset table in Figure 4. As shown, the Rs(avg) are 2.6 and 3.3 for ABs and APKs, respectively, which are 8% and 3% different from the predicted values. The tR are 15.4 min and 18.9 min, respectively, which are 16% and 13% different from the predicted values. The efficiency values are also very close (RSD 6%) to the predicted values. All the differences between the experimental and predicted values are within the acceptable ranges. Therefore, this mixture experiment design and the optimization seem to be valid and successful.
3.3 Characterization of the monolithic columns
3.3.1 Morphology of the monolithic columns
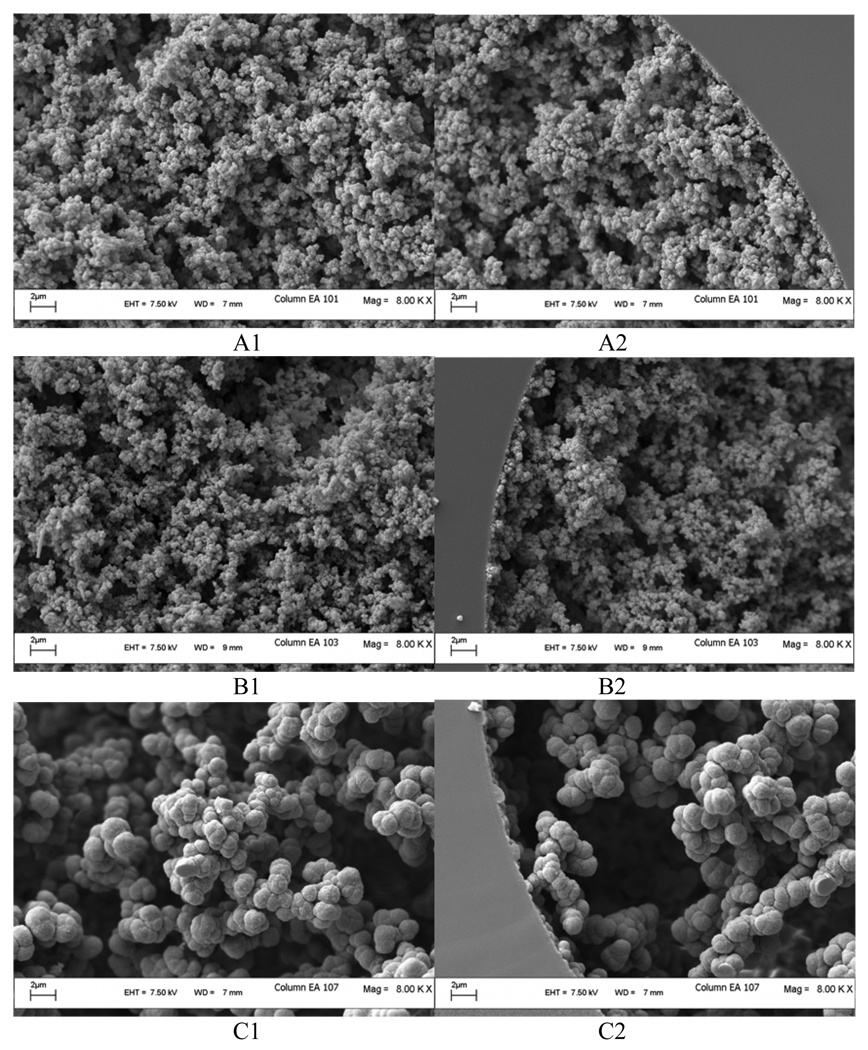
Morphology of the monolith is one of the key factors affecting the separation capability of the polymeric monolithic column. To obtain high efficiency, homogeneity and rigidity of the polymer bed is needed [47]. Figure 5 demonstrates the SEM pictures of three synthesized monolithic columns, which includes the highest resolution column 1 (Figure 5 A1, A2), the optimized column 3 (Figure 5 B1, B2) and lowest resolution column 7 (Figure 5 C1, C2). It is clear that the morphology of the poly (AAUA-co-EDMA) monolith formed in column 1 and column 3 are very similar, but quite different from column 7. Note that, column 7 (Figure 5 C1, C2), which provide very fast elution (in 1.9 min) with no resolution, has biggest clusters and large through pores. On the other hand, column 1 (Figure 5 A1, A2) contains higher density microspheres and smaller through pores resulting in higher surface area. The optimized monolith (column 3, Figure 5 B1, B2) consists of slightly more dense morphology and tightly connected microspheres. Based on the micrographs, it appears that the use of higher percentage of monomer AAUA in combination with relatively higher content of water in the porogen favored the formation of dense monolith with small microspheres. Therefore, composition of both monomer and porogen solvents seems to be more important than %crosslinker to control the morphology of the poly (AAUA-EDMA) monolith.
Figure 5.
Scanning electron micographs of monolith columns. A1, A2: column 1; B1, B2: column 3 (optimized column); C1, C2: column 7. A1, B1 and C1 are the center section of the monoliths, whereas A2, B2 and C2 are the edge section of the monoliths. Detailed information of the polymerization mixture composition for the monolith is described in Table 2.
3.3.2 Porosity of the monolithic columns
One of the main questions in characterizing monolithic columns is the consistency of the porosity data. To address this issue, the porosity of the monolith prepared was examined by mercury intrusion porosimetry (MIP) method, which is essentially a dry method and compared with the wet method under liquid flow conditions. First, the porosity of the monolith prepared in capillary was examined by a flow method [41]. In summary, the mobile phase linear velocity was measured by an inert dead volume tracer (thiourea) and the volumetric flow rate was also measured. Next, with the known empty tube dimensions, the total porosity εT was calculated (see experimental section). As shown in Table 3, the total porosities of the examined monoliths 1, 3 and 7 were 66.5%, 74.5% and 90.6%, respectively, which seems to be consistent to the SEM micrographs shown in Figure 5.
Table 3.
Physical characteristics of monolithic columns (1, 3 and 7): total porosity εT specific permeability K0, cumulative pore volumne V, average pore diameter d, bulk density ρ and surface area r.
| Monolithic column |
determined with flow method | determined with MIP and BET | |||||
|---|---|---|---|---|---|---|---|
| εT |
K0 [m2] |
V [mm3/g] |
d [µm] |
εT | ρ [g/m3] |
r [m2/g] |
|
| 1 | 0.66 | 1.11E-14 | 1530 | 0.11 | 0.64 | 0.42 | 33 |
| 3 | 0.75 | 2.88E-14 | 1830 | 0.14 | 0.70 | 0.38 | 25 |
| 7 | 0.91 | 2.23E-12 | 2908 | 0.32 | 0.77 | 0.26 | 6.0 |
When the monolithic columns were prepared, parallel polymerization in glass vials under the same condition with the same mixtures were also conducted. Nitrogen adsorption and MIP experiments were performed to test the pore-size distribution, surface area and total porosity of the bulk monolith in dry state. The trends in the εT values (shown in Table 3) tested by MIP increase in the following order: monolith 1< monolith 3 < monolith 7, which correlates well with the flow method. However, the εT values determined using MIP are a little lower than the values calculated by the flow method. These lower values obtained by the former method could be due to the differences in the state of sample (wet vs. dry). In addition, the polymerization container (the flow method sample was polymerized in capillary column while the MIP sample was polymerized in glass vials) may have also influenced the εT [39].
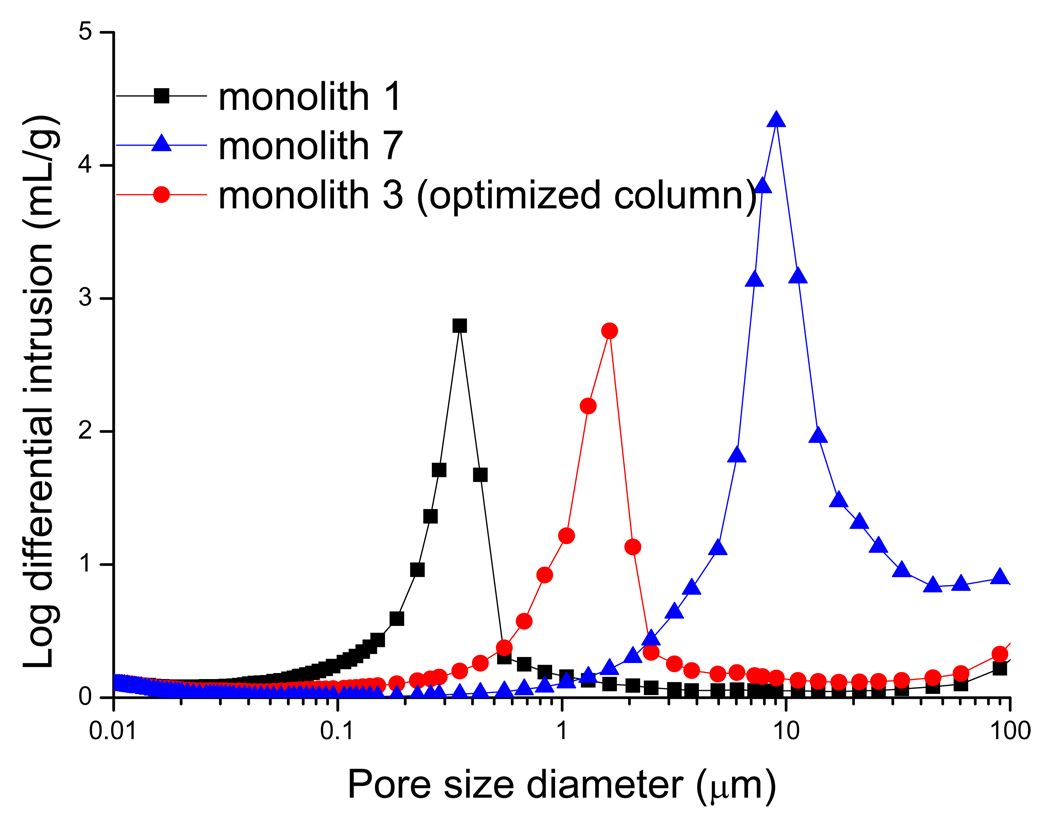
The pore size distributions of the three representative monoliths show single sharp maxima in Figure 6. As shown, the characteristic pore size of monolith 1 and monolith 3 are much smaller in size (0.3 µm and 1~2 µm, respectively) compared to monolith 7 (10 µm). In addition to the pore-size distribution, several other parameters such as cumulative pore volume (V), average pore diameter (d), bulk density (ρ) and surface area (r) were also determined for the monolith. As expected, the poly (AAUA-co-EDMA) column 1 and column 3 showed similar d and r. For example, the pore diameters of these two monolithic columns are much smaller and the surface areas are much larger compared with to the monolithic column 7, which provide the lowest CEC resolution and retention. Furthermore, the lowest V and ρ values obtained for column 1 agree well with the lowest εT values obtained using both MIP method and the flow method.
Figure 6.
Pore size distribution profiles of monolithic polymers prepared from various combination of polymerization mixture (summarized in Table 2) in a 4mm ID quartz tube. For other conditions see Table 2 and experimental Section.
3.3.3 Permeability and mechanical stability
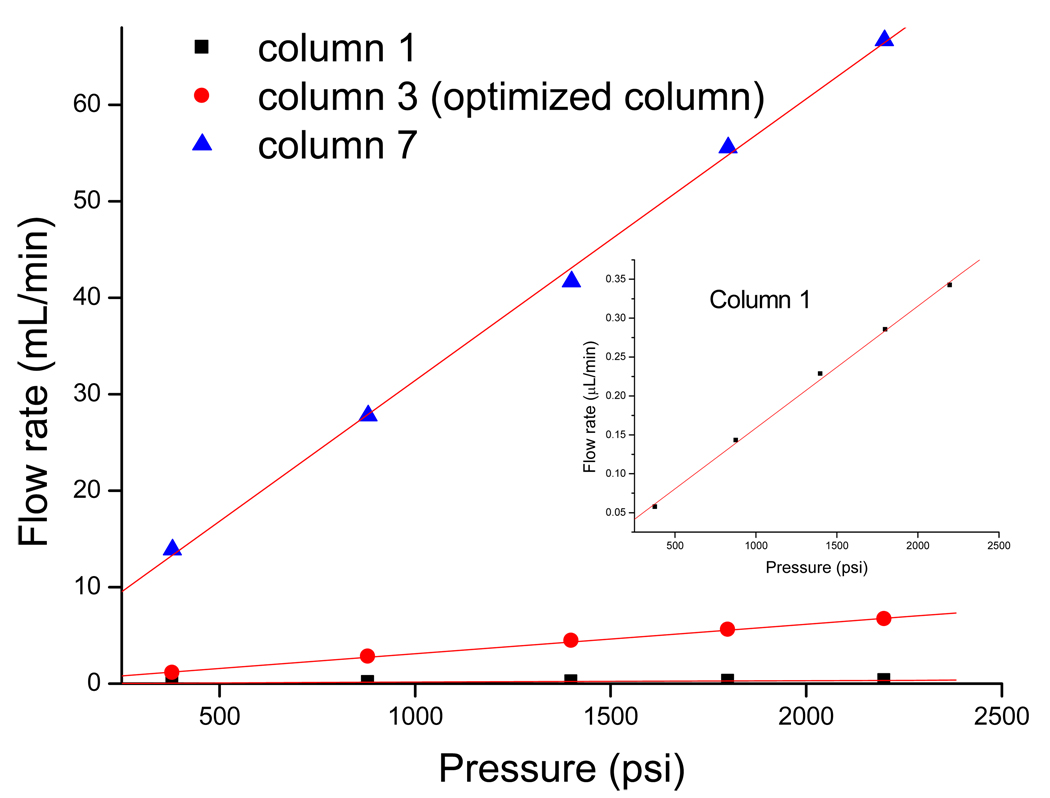
Acetonitrile (ACN) was used for the measurement of the pressure drop across the columns at different flow rates, which could also be used to indicate the mechanical stability and permeability of the columns [48]. For the three monolithic columns (1, 3 and 7), the specific permeability K0 were 1.11 ×10⁻¹⁴ m2, 2.88×10⁻¹⁴ m2 and 2.23×10⁻¹² m2, respectively (Table 3). The monolithic columns have surprisingly high permeability values, which are at least two orders greater than that of the 3µm particle-packed capillary column [49]. This is mainly due to the high total porosity of the monolith allowing liquids to flow through the column under low pressure. Plots of the volumetric flow rate of ACN against the applied pressure for monolithic column 1, 3 and 7 are shown in Figure 7. For each measured column, the back pressure’s dependency against flow rate of the solvent is a straight line with the correlation coefficient R better than 0.999. This indicated that permeability and mechanical stability of the monolith are both excellent.
Figure 7.
Plots of the volumetric flow rate of acetonitrile against the applied pressure. The composition of column 1, 3and 7 are described in Table 2. Mobile phase, 60% ACN in water. All data were collected on µ-HPLC system. The inlet plot shows the expanded trend obtained on column 1.
3.3.4 Effect of acetonitrile on electrochromatographic retention and efficiency of the optimized monolithic column
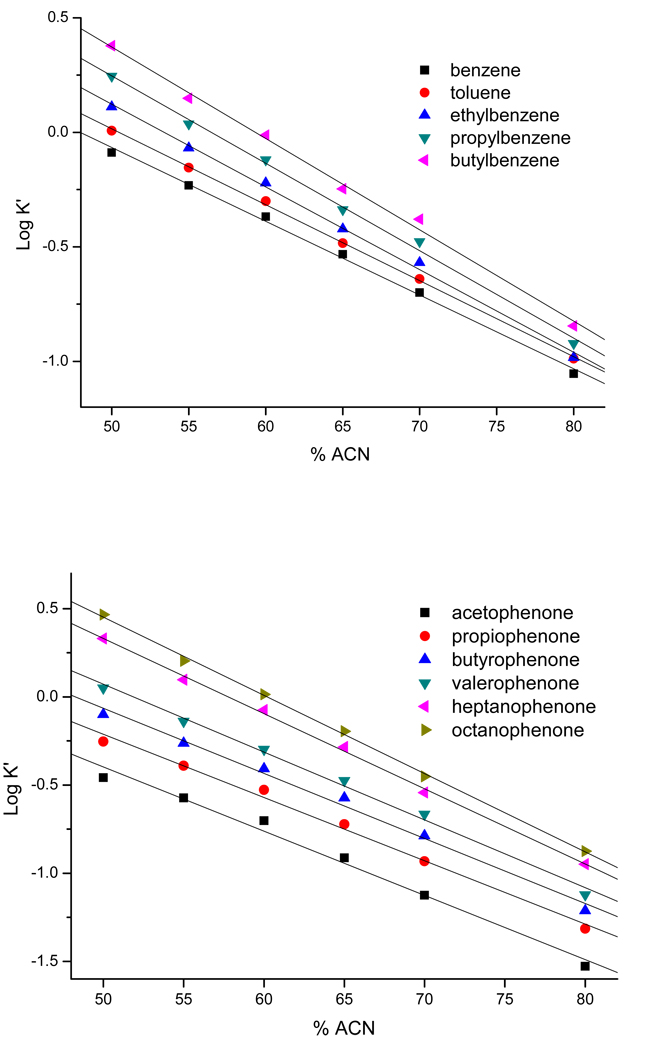
The electrochromatographic retention and efficiency of the optimized columns were tested using homologous ABs and APKs. Effects of concentration of ACN on the chromatographic retention capacities of ABs and APKs homologous were studied in the range of 50~80% (v/v). The linear dependence plots of the log k´ versus concentration (v/v) of ACN in the mobile phase are shown in Figure 8. The good linearity confirmed that the optimized AAUA-EDMA monolithic column poses reverse-phase separation mechanism over a wide range of acetonitrile composition. As expected, at equivalent concentration of acetonitrile the more polar APKs homologues are retained less than the corresponding ABs. Nevertheless, for both homologues series, the use of 70% (v/v) ACN in the mobile phase was found to provide the best compromise between resolution and efficiency vs. analysis time.
Figure 8.
Plots of logarithmic retention factor (log k´) of (A) ABs and (B) APKs versus %ACN (v/v) in the mobile phase. Conditions: optimized monolithic column, 45cm total length (30cm effective length)×100 εm ID; mobile phase, variable ratio of ACN-5 mM phosphate buffer, pH 7.0; 25°C; applied voltage +25 kV; detection wavelength, 214nm detection. Other conditions are the same as mentioned in Figure 2.
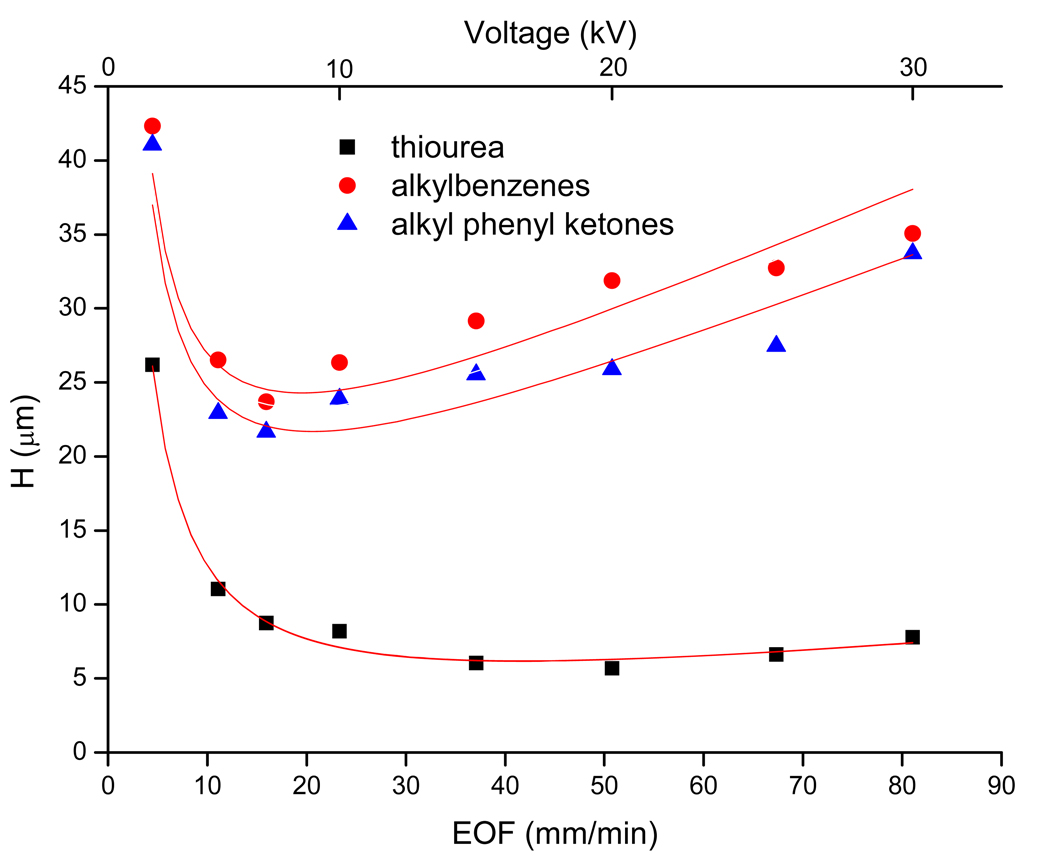
The peak efficiency of the monolithic column is also a critical parameter, which needs to be evaluated. To investigate the separation performance under different voltage, the plate height was measured as a function of mobile phase linear velocity by varying the applied voltage from 2 to 30 kV. Figure 9 demonstrates the dependence of the average plate height of ABs and APKs homologous and thiourea on the EOF and applied voltage. For thiourea, with the increase of applied voltage, the linear flow rate increased and the plate height decrease sharply at first. However, at voltage higher than 15 kV, the plate height almost kept constant. As expected, for ABs and APKs, their efficiencies were a little lower than thiourea at the same voltage. The hyperbolic shape of the Van Deemter curves and lowest H obtained for ABs and APKs at high flow velocity are similar trends to those reported in literature with other types of monolithic phases [41, 50]. On average, the plate heights were approximately 39 µm and 27 µm for ABs and APKs, respectively in the velocity range of the experiment.
Figure 9.
Van Deemter plots showing average plate height as a function of apparent mobile-phase flow velocity for thiourea, ABs and APKs on optimized column. The plate height is the average taken for the AB and APK homologues series. Conditions: mobile phase, 60% ACN in 5 mM phosphate buffer, pH 7.0; applied voltage was varied from +2 to +30 kV; detection, 214nm; sample concentration, 0.8 mg/ml; electrokinetic injection, 5 kV, 3 s. Other conditions are the same as mentioned in Figure 2.
3.3.5 Reproducibility of column preparation
The reproducibility of column preparation is a very important parameter for a new monolith. We assessed the reproducibility of column fabrication as (a) intra-batch (column to column) and (b) inter-batch (batch-to-batch). Three separate batches of the optimized monolithic column (column 3) were prepared and for each batch, three columns were made for a total of 9 columns. A new polymerization mixture was prepared for each of the three batches. The retention times of ABs and APKs were selected to evaluate the reproducibility of the fabrication process. From the data shown in Table 4, it can be seen that the RSD values of the retention time are lower than 3%. The intra-batch precision of retention time ranged from 0.98 to 2.14, whereas the inter-batch precision of retention time (calculated as the average of 3 batches) ranged from 0.79 to 2.75. In addition, the intra-batch reproducibility of the specific permeability was also evaluated and an RSD value of 3.4% was obtained suggesting that the preparation of the monolith is reproducible.
Table 4.
Intra-batch and Inter-batch reproducibility of retention time for ABs and APKs in CEC using the optimized monolithic column (column 3). Other conditions are the same as mentioned in Figure 2.
| Batch No. |
Monolithic columns |
tR (avg), min (%RSD) | ||||||||||
|---|---|---|---|---|---|---|---|---|---|---|---|---|
| A1 | A2 | A3 | A4 | A5 | B1 | B2 | B3 | B4 | B5 | B6 | ||
| 1 | 3 | 8.4 (2.1) |
9.0 (1.5) |
10.2 (1.7) |
12.3 (1.2) |
14.6 (2.0) |
6.9 (0.7) |
7.9 (1.4) |
9.2 (1.0) |
10.8 (1.1) |
16.0 (0.8) |
19.9 (1.3) |
| 2 | 3 | 8.5 (2.1) |
9.1 (1.9) |
10.2 (1.1) |
12.4 (1.0) |
14.8 (1.3) |
6.8 (0.6) |
7.8 (1.2) |
9.3 (1.1) |
10.9 (1.9) |
15.6 (1.0) |
19.7 (1.5) |
| 3 | 3 | 8.4 (2.0) |
8.9 (2.1) |
10.1 (1.2) |
12.2 (1.3) |
14.8 (1.8) |
6.9 (0.7) |
8.1 (1.0) |
9.1 (1.2) |
10.8 (2.0) |
16.1 (1.5) |
20.2 (1.2) |
| Over all |
9 | 8.4 (2.6) |
9.0 (2.9) |
10.2 (1.9) |
12.3 (1.4) |
14.7 (2.6) |
6.9 (0.8) |
7.8 (1.5) |
9.2 (1.6) |
10.9 (2.4) |
16.0 (2.3) |
19.9 (2.3) |
tR (avg): average retention time.
A1-A5: benzene, toluene, ethylbenzene, propylbenzene, butylbenzene;
B1-B6: acetophenon, propiophenone, butyrophenone, valerophenone, heptanophenone,octanophenone.
3.4 Separation of polar compounds
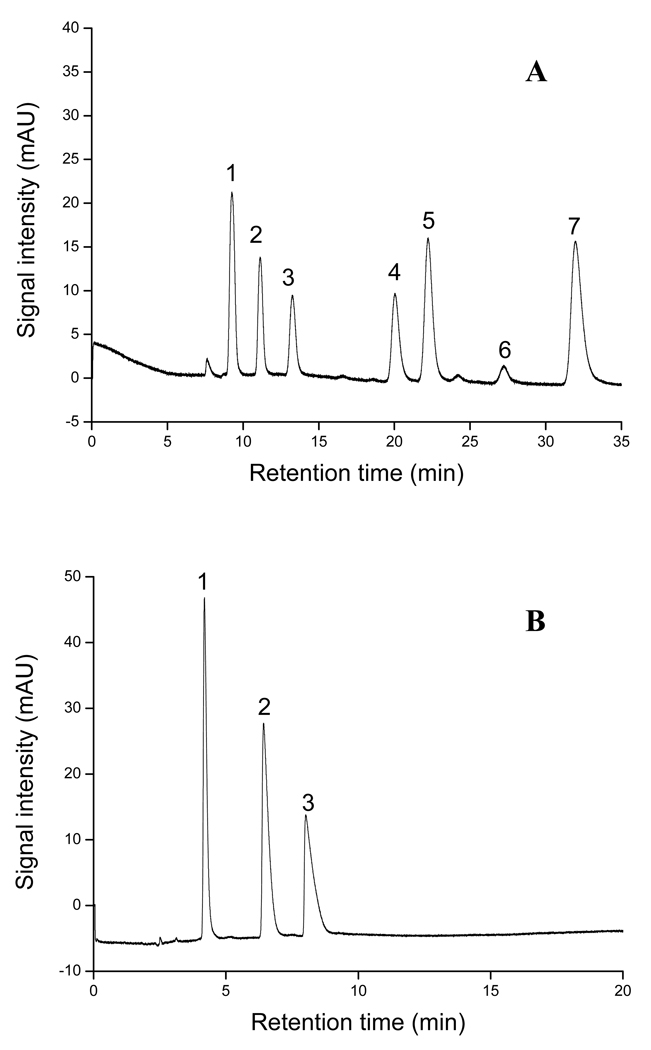
As mentioned earlier, the undecanoyl group and carboxyl groups of the monomer make this AAUA monolith a mixed-mode hydrophobic/weak cation-exchange stationary phase. This mixed-mode monolith was also evaluated by moderately polar NMCs pesticides. Figure 10A shows the electrochromatogram of seven NMCs on column 3 using 25kV and a mobile phase containing 30% ACN, 5mM ammonium acetate at pH 6.5. The average plate count per meter is 85,000. The efficiency as well as analysis time is comparable to the reported methods for NMCs separation by pCEC and CEC [51–53]. Compared to NMCs separation on ODS reverse stationary phase, changes of elution order for some pesticides (i.e., pirimicarb and propoxur) were seen with poly-AAUA stationary phase. For example, pirimicarb is more hydrophobic than propoxur, it eluted first with poly-AAUA but last under reversed-phase CEC conditions [52]. Because the pKa of pirimicarb is around 4.5, it should be in neutral form under the CEC mobile phase pH of 6.5. On the other hand, propoxur, with a pKa of 12.3, should be positively charged. Hence, because of electrostatic interaction between the propoxur and AAUA stationary phase, propoxur is retained longer than primicarb. Figure 10B shows the electrochromatogram of three phenyl imidazole isomers on column 3 using 25 kV and a mobile phase containing 5 mM phosphate buffer, pH 7.0 and 50% ACN. Utilizing the AAUA-EDMA monolith, all 3 phenylimidazole positional isomers could be easily separated in under 11 mins with an average resolution of 4.8. The elution order is according to the hydrophobicity of the analytes [i.e., log P 4-phenylimidazole (1.460) < 2-phenylimidazole (1.880) < 1-phenylimidazole (1.980)). However, when CZE is used, separation is only seen at pHs lower than 7.0 and the elution order was 2-phenylimidazole< 4-phenylimidazole< 1-phenylimidazole, which is consistent with their increasing pKas (data not shown).
Figure 10.
Separation of (A) N-methylcarbamates (NMCs) pesticides and (B) phenylimidazole isomers obtained on the optimized monolithic column. Conditions: optimized monolithic column, 45cm total length (30cm effective length)×100 εm ID; (A) mobile phase, 5mM ammonium acetate, pH 6.5, at 30% (v/v) ACN; applied voltage, +25 kV; UV detection, 220 nm; electrokinetic injection, +5kV for 3 s. Analytes: 1, oxamy; 2, methomyl; 3, thiofanox sulfon; 4, aldicarb; 5, primicarb ; 6, propoxur; 7, aminocarb. Each analytes was injected at a concentration of 0.5 mg/mL prepared in 30% ACN/H2O. (B): mobile phase, 5mM phosphate buffer, pH 7.0, at 50% (v/v) ACN; applied voltage, +25 kV; UV detection, 214 nm; electrokinetic injection, +5kV for 3 s. Analytes: 1, 4-phenylimidazole; 2, 2-phenylimidazole; 3, 1-phenylimidazole.
4 Concluding remarks
A novel surfactant based poly (AAUA-co-EDMA) monolith was prepared in one-step polymerization (after the synthesis of AAUA monomer). The optimization of the polymerization mixture (concentration of crosslinker, monomer and porogens) was achieved using D-optimal design. It was found that concentration of monomer (AAUA) and water are the two most important parameters in a successful monolith formation. The final optimized polymerization conditions predicted from the desirability function was tested. The experimental data were in very good to excellent agreement with the predicted results. The D-optimal seems to be a very promising approach to obtain a truly optimum polymerization conditions, allowing the successful development of new monolithic stationary phase. The physical and chromatographic properties of the optimized monolithic column were thoroughly investigated. The column presented typical polymer-based monolith morphology, excellent permeability and good mechanical stability. Furthermore, the inter- and intra-batch reproducibility of column fabrication was found to be excellent for practical applications. Although separation of non-polar compounds was according to their hydrophobicity, some polar and chargeable compounds showed unique mixed-mode selectivity compared to the reported separations [51–53]. Because this kind of new monolith has mixed-mode separation mechanism, it has great potential application for separation of polar molecules. Further studies are underway in our laboratory to explore this mechanism in more detail.
Supplementary Material
Acknowledgments
This work was supported by grant from the National Institutes of Health (Grant No. 2RO1-062314) and the American Chemical Society Petroleum Research Fund (PRF-47774-AC7).
Abbreviations
- AAUA
11-acrylaminoundecanoic acid
- EDMA
ethylene dimethacrylate
- ABs
alkylbenzenes
- APKs
alkyl phenyl ketones
REFERENCES
- 1.Svec F, Peters EC, Sykora D, Frechet JMJ. J. Chromatogr., A. 2000;887:3–29. doi: 10.1016/s0021-9673(99)01232-7. [DOI] [PubMed] [Google Scholar]
- 2.Eeltink S, Svec F. Electrophoresis. 2007;28:137–147. doi: 10.1002/elps.200600573. [DOI] [PubMed] [Google Scholar]
- 3.Stulik K, Pacakova V, Suchankova J, Coufal P. J. Chromatogr., B. 2006;841:79–87. doi: 10.1016/j.jchromb.2006.04.016. [DOI] [PubMed] [Google Scholar]
- 4.Klodzinska E, Moravcova D, Jandera P, Buszewski B. J. Chromatogr., A. 2006;1109:51–59. doi: 10.1016/j.chroma.2005.12.024. [DOI] [PubMed] [Google Scholar]
- 5.Ro KW, Nayak R, Knapp DR. Electrophoresis. 2006;27:3547–3558. doi: 10.1002/elps.200600058. [DOI] [PubMed] [Google Scholar]
- 6.Zhu G, Yuan H, Zhao P, Zhang L, Liang Z, Zhang W, Zhang Y. Electrophoresis. 2006;27:3578–3583. doi: 10.1002/elps.200600189. [DOI] [PubMed] [Google Scholar]
- 7.Barut M, Podgornik A, Brne P, Štrancar A. J. Sep. Sci. 2005;28:1876–1892. doi: 10.1002/jssc.200500246. [DOI] [PubMed] [Google Scholar]
- 8.Rieux L, Niederländer H, Verpoorte E, Bischoff R. J. Sep. Sci. 2005;28:1628–1641. doi: 10.1002/jssc.200500146. [DOI] [PubMed] [Google Scholar]
- 9.Premstaller A, Oefner PJ, Oberacher H, Huber CG. Anal. Chem. 2002;74:4688–4693. doi: 10.1021/ac020272f. [DOI] [PubMed] [Google Scholar]
- 10.Wu R, Zou H, Ye M, Lei Z, Ni J. Anal. Chem. 2001;73:4918–4923. doi: 10.1021/ac010413y. [DOI] [PubMed] [Google Scholar]
- 11.Jmeian Y, EI Rassi Z. J. Proteome Res. 2007;6:947–954. doi: 10.1021/pr060660o. [DOI] [PubMed] [Google Scholar]
- 12.Juan-Garcia A, Font G, Pico Y. J. Chromatogr., A. 2007;1153:104–113. doi: 10.1016/j.chroma.2007.01.129. [DOI] [PubMed] [Google Scholar]
- 13.Yu C, Svec F, Frechet JMJ. Electrophoresis. 2000;21:120–127. doi: 10.1002/(SICI)1522-2683(20000101)21:1<120::AID-ELPS120>3.0.CO;2-H. [DOI] [PubMed] [Google Scholar]
- 14.Pena A, Chmielova D, Lino CM, Solich P. J. Sep. Sci. 2007;30:2924–2928. doi: 10.1002/jssc.200700363. [DOI] [PubMed] [Google Scholar]
- 15.Detroyer A, Stokbroekx S, Bohets H, Lorreyne W, Timmerman P, Verboven P, Massart DL, VanderHeyden Y. Anal. Chem. 2004;76:7304–7309. doi: 10.1021/ac048944k. [DOI] [PubMed] [Google Scholar]
- 16.Detroyer A, VanderHeyden Y, Reynaert K, Massart DL. Anal. Chem. 2004;76:1903–1908. doi: 10.1021/ac030339e. [DOI] [PubMed] [Google Scholar]
- 17.Gübitz G, Schmid MG. Electrophoresis. 2004;25:3981–3996. doi: 10.1002/elps.200406173. [DOI] [PubMed] [Google Scholar]
- 18.Šatínskí D, Chocholouš P, Salabová M, Solich P. J. Sep. Sci. 2006;29:2494–2499. doi: 10.1002/jssc.200600204. [DOI] [PubMed] [Google Scholar]
- 19.Hsieh Y, Wang G, Wang Y, Chackalamannil S, Korfmacher WA. Anal. Chem. 2003;75:1812–1818. doi: 10.1021/ac020630e. [DOI] [PubMed] [Google Scholar]
- 20.Eeltink S, Hilder EF, Geiser L, Svec F, Fréchet JMJ, Rozing GP, Schoenmakers PJ, Kok WT. J. Sep. Sci. 2007;30:407–413. doi: 10.1002/jssc.200600316. [DOI] [PubMed] [Google Scholar]
- 21.Barrioulet MP, Delaunay-Bertoncini N, Demesmay C, Rocca JL. Electrophoresis. 2005;26:4104–4115. doi: 10.1002/elps.200500251. [DOI] [PubMed] [Google Scholar]
- 22.Chirica GS, Remcho VT. Anal. Chem. 2000;72:3605–3610. doi: 10.1021/ac000179w. [DOI] [PubMed] [Google Scholar]
- 23.Nordborg A, Hilder E. Anal. Bioanal. Chem. 2009;394:71–84. doi: 10.1007/s00216-009-2636-9. [DOI] [PubMed] [Google Scholar]
- 24.Tanret I, Mangelings D, Vander Heyden Y. J. Pharmaceut. Biomed. 2008;48:264–277. doi: 10.1016/j.jpba.2007.11.040. [DOI] [PubMed] [Google Scholar]
- 25.Hara T, Kobayashi H, Ikegami T, Nakanishi K, Tanaka N. Anal. Chem. 2006;78:7632–7642. doi: 10.1021/ac060770e. [DOI] [PubMed] [Google Scholar]
- 26.Eeltink S, Herrero-Martinez JM, Rozing GP, Schoenmakers PJ, Kok WT. Anal. Chem. 2005;77:7342–7347. doi: 10.1021/ac051093b. [DOI] [PubMed] [Google Scholar]
- 27.Lammerhofer M, Peters EC, Yu C, Svec F, Frechet JMJ, Lindner W. Anal. Chem. 2000;72:4614–4622. doi: 10.1021/ac000322l. [DOI] [PubMed] [Google Scholar]
- 28.Viklund C, Svec F, Frechet JMJ, Irgum K. Chem. Mater. 1996;8:744–750. [Google Scholar]
- 29.Lammerhofer M, Svec F, Frechet JMJ, Lindner W. J. Chromatogr., A. 2001;925:265–277. doi: 10.1016/s0021-9673(01)01034-2. [DOI] [PubMed] [Google Scholar]
- 30.Fraile R, Sánchez V. J. High Res. Chromatog. 1993;16:169–174. [Google Scholar]
- 31.Baranda AB, Etxebarria N, Jimenez RM, Alonso RM. Talanta. 2005;67:933–941. doi: 10.1016/j.talanta.2005.04.028. [DOI] [PubMed] [Google Scholar]
- 32.Candioti LV, Robles JC, Mantovani VE, Goicoechea HC. Talanta. 2006;69:140–147. doi: 10.1016/j.talanta.2005.09.021. [DOI] [PubMed] [Google Scholar]
- 33.Chang L-H, Jong T-T, Huang H-S, Nien Y-F, Chang C-MJ. Sep. Purif. Technol. 2006;47:119–125. [Google Scholar]
- 34.De Aragao NM, Veloso MCC, Bispo MS, Ferreira SLC, de Andrade JB. Talanta. 2005;67:1007–1013. doi: 10.1016/j.talanta.2005.04.066. [DOI] [PubMed] [Google Scholar]
- 35.De Faveri D, Torre P, Perego P, Converti A. J. Food Eng. 2004;61:407–412. [Google Scholar]
- 36.Furlanetto S, Orlandini S, Marra AM. Mura P, Pinzauti S. Electrophoresis. 2006;27:805–818. doi: 10.1002/elps.200500507. [DOI] [PubMed] [Google Scholar]
- 37.Yeoh KW, Chew CH, Gan LM, Koh LL. J. Macromol. Sci.-Chem., A. 1989;26:663–680. [Google Scholar]
- 38.Gu C, Lin L, Chen X, Jia J, Ren J, Fang N. J. Sep. Sci. 2007;30:1005–1012. doi: 10.1002/jssc.200600397. [DOI] [PubMed] [Google Scholar]
- 39.Gu C, Lin L, Chen X, Jia J, Ren J, Fang N. J. Chromatogr., A. 2007;1170:15–22. doi: 10.1016/j.chroma.2007.09.009. [DOI] [PubMed] [Google Scholar]
- 40.Peters EC, Petro M, Svec F, Frechet JMJ. Anal. Chem. 1998;70:2288–2295. doi: 10.1021/ac9713518. [DOI] [PubMed] [Google Scholar]
- 41.Gusev I, Huang X, Horváth C. J. Chromatogr., A. 1999;855:273–290. doi: 10.1016/s0021-9673(99)00697-4. [DOI] [PubMed] [Google Scholar]
- 42.Meyers VM. Practical High-Performance Liquid Chromatography. New Jersey: Wiley; 2005. p. 131. [Google Scholar]
- 43.http://www.mathworks.com/access/helpdesk/help/toolbox/stats
- 44.Anderson MJ, Whitcomb PJ. Rubber and plastic news. 2002 [Google Scholar]
- 45.Grafnetter J, Coufal P, Tesarova E, Suchankova J, Bosakova Z, Sevcik J. J.Chromatogr., A. 2004;1049:43–49. doi: 10.1016/j.chroma.2004.08.009. [DOI] [PubMed] [Google Scholar]
- 46.Chauhan B, Gupta R. Process Biochemistry. 2004;39:2115–2122. [Google Scholar]
- 47.Cong L, Huang B, Chen Q, Lu B, Zhang J, Ren Y. Anal. Chim. Acta. 2006;569:157–168. [Google Scholar]
- 48.Oberacher H, Huber CG. TrAC-Trend. Anal. Chem. 2002;21:166–174. [Google Scholar]
- 49.Ratnayake CK, Oh C, Henry MP. J. Chromatogr., A. 2000;887:277–285. doi: 10.1016/s0021-9673(99)01142-5. [DOI] [PubMed] [Google Scholar]
- 50.Bedair M, EI Rassi Z. J. Chromatogr., A. 2003;1013:35–45. doi: 10.1016/s0021-9673(03)01031-8. [DOI] [PubMed] [Google Scholar]
- 51.Starkey JA, Abrantes S, Mechref Y, Novotny MV. J. Sep. Sci. 2003;26:1635–1642. [Google Scholar]
- 52.Wu X, Wang L, Xie Z, Lu J, Yan C, Yang P, Chen G. Electrophoresis. 2006;27:768–777. doi: 10.1002/elps.200500615. [DOI] [PubMed] [Google Scholar]
- 53.Zhang M, EI Rassi Z. Electrophoresis. 2001;22:2593–2599. doi: 10.1002/1522-2683(200107)22:12<2593::AID-ELPS2593>3.0.CO;2-O. [DOI] [PubMed] [Google Scholar]
Associated Data
This section collects any data citations, data availability statements, or supplementary materials included in this article.


