

Abstract
Background
The utility of one of the most widely used subjective alcohol assessment tools, the Biphasic Alcohol Effects Scale (BAES) has been somewhat limited based on lack of psychometric studies in large and diverse samples, a range of alcohol doses, the length of the measure, and the original instructional set which precluded baseline measurement and disclosed to subjects that they received alcohol.
Method
The current study investigated the factor structure of the BAES with a modified instructional set at pre-drink baseline and after consumption of various doses of alcohol, in a sample of 190 men and women heavy and light social drinkers. This study also tested the psychometric properties of a brief BAES (B-BAES).
Results
Results demonstrated robust support of the stimulant and sedative constructs across all conditions, and demonstrated strong psychometric support for a six-item B-BAES.
Discussion
This is the first comprehensive study to expand the utility of the BAES by instructional set, baseline measurement, at various alcohol doses, and by drinking history and sex. In addition, the introduction of the B-BAES may further increase the utility of this scale, particularly in paradigms with repeated measurement or time constraints.
Keywords: Biphasic Alcohol Effects Scale (BAES), Brief-BAES (B-BAES), alcohol stimulation, subjective effects, psychometric properties
Introduction
The differential role of stimulation and sedation as measurable and distinct alcohol effects has formed the basis of many of the most prominent theories of risk for alcohol dependence. These theories of risk range from heightened stimulant and positive-like alcohol effects (Wise and Bozarth, 1987), low level of intoxicating and negative-like effects (Schuckit, 1984), and changes in incentive salience, i.e., drug “wanting,” distinct from rewarding effects, i.e., drug “liking” (Robinson and Berridge, 1993, 2001; Berridge, 2007). Additionally, the Differentiator Model (Newlin and Thomson, 1990) attempted to resolve competing theories by purporting that persons at risk for alcohol use disorders experience heightened positive-like effects of alcohol during the rising limb of the blood alcohol curve (BAC) and reduced sedative-like effects during the declining limb compared to their low-risk counterparts. These theories and related findings (Brunelle et al., 2007; Conrod et al., 1997, 2001; Erblich et al., 2003; Finn and Pihl, 1987; Finn et al., 1990; Holdstock et al., 2000; King et al., 2002; Schuckit, 1984, 1994) highlight the importance of accurately assessing and distinguishing the stimulant and sedative effects of alcohol.
The Biphasic Alcohol Effects Scale (BAES; Martin et al., 1993) was the first systematic acute alcohol assessment scale designed to measure self-reports of the stimulant and sedative effects of alcohol as separate and distinct constructs. Before the development of the BAES, alcohol effects were often measured with the use of non-standardized visual analogue scales lacking validity or reliability, scales evaluating mainly sedative-like intoxicating effects (e.g., Subjective High Assessment Scale; Judd et al., 1977; Alcohol Sensation Scale; Maisto et al., 1980), or scales with dichotomous response rating instruments which are limited in their capacity to capture variability of effects (e.g., Addiction Research Center Inventory; Haertzen et al., 1963). Further, some earlier studies relied on instruments that assess general mood states, which were not developed to specifically measure alcohol-related effects (e.g., Profile of Mood States; McNair et al., 1971; Positive and Negative Affect Schedule; Watson et al., 1988). Although these measures have demonstrated adequate psychometric properties, and are sensitive to some changes related to alcohol effects, the BAES was developed to specifically target alcohol's stimulant and sedative effects, which may vary by phase of the BAC for some individuals.
The BAES has been shown to possess strong psychometric properties, including good internal consistency reliability (α's ranging from 0.85 to 0.94 in Martin et al., 1993, and 0.73 to 0.97 in Earleywine and Erlbich, 1996), a factor structure that supports the distinctness of the stimulant and sedative constructs (Martin et al., 1993), and distinctness of each construct at the ascending and descending limbs (Earleywine and Erlbich, 1996). However, in spite of the strong psychometric support for the BAES, there remain some unanswered questions about the BAES that require further investigation. First, in the original validation study, there was no association between the stimulant and sedative constructs at baseline (i.e., sober ratings; r = 0.03; Martin et al., 1993), suggesting that these are unrelated, distinct, orthogonal constructs. However, with alcohol consumption, these correlations were positive in both validation studies (r's ranging from 0.27 to 0.46), suggesting a small to moderate positive relationship between these two constructs. These findings were difficult to interpret, and called into question the distinctiveness of alcohol-induced stimulation versus sedation, with the authors noting that the relationship between these constructs should be further investigated (Martin et al., 1993).
Second, in both validation studies published for the BAES, the scale is given only after alcohol consumption and participants were told to “rate the extent to which drinking alcohol has produced these feelings in you at the present time” (Earleywine and Erlbich, 1996; Martin et al., 1993). The rationale for these directive instructions was that this might avoid the problem of variable baseline ratings. However, there are inherent psychometric difficulties with this approach, as subjects may not be able to discern attribution of internal changes to those specifically produced by alcohol. In addition, this instructional set precludes measurement of pre- and post-change scores, and also may increase expectancy as subjects would know they received alcohol.
Third, both validation studies of the BAES utilized low-to-moderate alcohol doses (to peak rising limb BACs between 0.04 and 0.06 mg%) so it is unclear if the scale is valid at higher alcohol doses, i.e., those that produce reliable impairment (Brumback et al., 2007; King and Byars, 2004) and render blood alcohol concentrations at the legal limit for driving. Relatedly, the BAES validation studies examined predominantly males with moderate social drinking backgrounds. Thus, it would add to the psychometric support for the BAES to test the underlying structure with a larger sample, higher doses of alcohol, and across various subject groups, i.e., drinking history and sex. Fourth, a final limitation of the BAES is that its length (14 items) may not render it amenable to research paradigms with constraints on time, such as in studies examining various functional domains, in neuro-imaging research, or studies using ecological momentary techniques. In such circumstances, a shorter version of the BAES that retains the strong psychometric properties as the original version would be invaluable.
Thus, the four-fold purpose of the current investigation was to: (1) confirm the factor structure of the BAES using administration instructions that do not disclose alcohol content of beverage; (2) examine the factor structure of the BAES including a pre-consumption baseline; (3) test for invariance of structure across drinking history and sex; and (4) reduce the number of BAES items and test the psychometric properties of a brief version of the BAES. Based on the previous literature, it was predicted that there would be support for distinct stimulant and sedative constructs at both limbs of the BAC with a low and high dose of alcohol. It was further predicted that stimulant and sedative constructs would be observed at pre-drink baseline, which are distinct from stimulation and sedation over the BAC curve. Given the lack of prior data, examination of the psychometric properties of the BAES across drinking history and sex, and support for a brief version remained empirical questions.
Methods
Participants
Participants (N=190) were young adult social drinkers aged 21-35 enrolled in the larger Chicago Social Drinking Project (CSDP), which is a longitudinal study examining alcohol's effects in two distinct subgroups of social drinkers and their future risk for alcohol problems. Participants were nonalcoholic social drinkers who met criteria for either chronic binge heavy drinker (n=104, 41% female, consumed 10+ drinks/week with 1-5 binge episodes weekly) or light drinker (n=86, 49% female, consumed fewer than 6 drinks/week with rare or no binge drinking history) for the last two or more years. A ‘binge’ was operationally defined as consuming 5 or more drinks per occasion for men, 4 or more for women (SAMHSA, 2005). Moderate drinkers, i.e., those who did not meet criteria for either of these groups, were not included. Prior to participation, candidates underwent questionnaires and interviews to assess eligibility for alcohol drinking group and to rule-out those with past or current major medical or psychiatric conditions including alcohol or other substance dependence. Standard cut-off thresholds on the alcohol and other substance dependence modules of the Structured Clinical Interview for the DSM IV-Patient Version (SCID; First et al., 1995) and the Short Michigan Alcoholism Screening Test (SMAST; Selzer et al., 1975) were utilized to screen and exclude candidates with alcohol and/or substance dependence (for further details on the screening measures, see Brumback et al., 2007).
Procedure
The study included a within-subjects, double-blind, placebo-controlled human laboratory paradigm. There were three, 4-5 hour laboratory sessions separated by at least 48 hours. Sessions started between 3:00 – 5:00 pm and were identical except for the alcohol content of the beverage in each session. In order to reduce alcohol expectancy, during screening and at each session, the participant was told that the beverage might contain a stimulant, a sedative, alcohol, or a placebo, at varying doses, and/or two in combination.
Each participant was instructed to abstain from alcohol and medications for at least 48 hours, as well as caffeine, cigarettes, and food for 3 hours prior to each session. Upon arrival at each session, the participant consumed a low-fat snack (20% daily calories) to avoid hunger effects on mood state and to reduce the possibility of alcohol-induced nausea.
Thirty minutes after arrival, the participant completed several baseline subjective and objective measures as part of the larger CSDP. Next, the participant consumed the assigned session beverage over a 15-minute interval in the presence of the research assistant. The beverage was divided into two equal portions to consume over five minutes each with a 5-minute rest period between portions. Following beverage consumption, measures were repeated at regular intervals for the ensuing three hours. Between time points, the participant was allowed to relax in a living room-like subject room, watch television or movies, and/or read. At the end of the session, the participant was escorted home by a livery service. At the conclusion of the study, each subject was debriefed and compensated $150.00 plus a $50 bonus for study completion. The study was fully approved by the University of Chicago Institutional Review Board.
Beverage Administration
All beverages were served in opaque plastic glasses with lids (to reduce beverage identification and olfactory cues) and consumed through a straw. Beverage dosing consisted of a high alcohol dose beverage (0.8 g/kg), low alcohol dose beverage (0.4 g/kg), or placebo (1% alcohol per volume as taste mask), randomized and counterbalanced between groups. The beverages were prepared with Kool-Aid®, water, Splenda®, and the appropriate dose of 190-proof ethanol based on body weight. Adjustments were made for women to receive an approximate 85 percent dose for that of men due to differences in total body water affecting blood alcohol concentrations (Frezza et al., 1990; Sutker et al., 1983).
Subjective Measures
Subjective measures were administered via computer-based assessment at pre-drink baseline approximately 30 minutes prior to the drink interval and again at 30- and 120-minutes after the initiation of beverage consumption to capture the rising and declining phases of the blood alcohol curve.
Biphasic Alcohol Effects Scale (BAES; Martin et al., 1993)
The 14 adjective items comprising the BAES are sensitive to the stimulant- and sedative-like effects of alcohol. Participants indicate the extent to which they are feeling each adjective on an 11-point scale from not at all (0) to extremely (10). The Stimulation subscale is the summation of scores for the adjectives elated, energized, excited, stimulated, talkative, up, and vigorous. The Sedation subscale score is the summation of the descriptors down, heavy head, difficulty concentrating, inactive, sedated, slow thoughts, and sluggish. In this study, two modifications from the original BAES were employed: (1) Each item was presented individually on the computer monitor, in the same order as described for the paper-and-pencil version; (2) the instructions were modified to ask the subject to “Please rate the extent to which these words describe your feelings at the present time,” rather than ask subjects to discern which effects were produced by alcohol.
Addiction Research Center Inventory (ARCI; Haertzen et al., 1963)
The ARCI is a sensitive, reliable measure of drug effects consisting of 53 true/false statements summed to six empirically derived scale scores. Three of these scales were used to validate the BAES: positive-like effects via the Morphine-Benzedrine Group scale (MBG), which is a measure of drug-induced euphoria, and the Amphetamine scale (A), which is a measure of stimulant-like effects, and negative-like effects via the Pentobarbital-Chlorpromazine-Alcohol Group scale (PCAG), which measures sedative-like effects.
Positive and Negative Affect Schedule (PANAS; Watson et al., 1988)
The PANAS is a 20-item adjective rating scale that assesses the participant's current affective state. The Positive Affect scale reflects the degree to which a person feels joyful, active, elated, or strong, and the Negative Affect scale reflects the degree to which a person experiences negative arousal, such as distress, hostility, anger, or anxiety. Each item is rated from not at all (0) to extremely (5). The Positive Affect (PA) and Negative Affect (NA) scales were used to validate the BAES.
Objective Measure
BAC was obtained by expired breath samples utilizing an Alco-Sensor IV (Intoximeter Inc., St. Louis, MO). To ensure experimenter and subject blindness during the session, the breathalyzer was set to read .000 for all measures during testing with actual levels downloaded to a computer after the subject completed the study. Prior research by our group and others have shown that 30 and 120 minutes after initiation of beverage consumption approximate the rising and declining limbs of the BAC (Brumback et al., 2007; Brunelle et al., 2007; Fillmore et al., 2005; King et al., 2002; Martin et al., 1993).
Data Analytic Strategy
Underlying factor structure
The underlying structure of the BAES was tested with confirmatory factor analysis using AMOS 16.0 (Arbuckle, 2005). Replicating the analytic strategy of Earleywine and Erblich (1996), the same four competing models were tested at a lower dose of alcohol (i.e., comparable to the previous investigation) as well as at a higher dose of alcohol. For all four models, the 14 items of the BAES taken at both the ascending and descending limbs of the blood alcohol curve were included together. A fifth model, i.e., a six-factor model, was tested using the 14 items of the BAES taken at baseline, as well as at the ascending and descending limbs to test the distinctness of the stimulation and sedation constructs at pre-drink baseline and over the BAC curve. The standardized root mean square residual (SRMR) and the comparative fit index (CFI) were chosen as fit indices based on the strong recommendation of Hu and Bentler (1998). The criterion values for the SRMR and CFI that indicate an adequate fit is equal or less than 0.10 and equal or greater than 0.90, respectively. An excellent fit is indicated by SRMR values equal or less than 0.08 and CFI values equal or greater than 0.95 (Vandenberg and Lance, 2000).
Correlational analyses were used to address issues related to baseline dependence and the use of an instructional set that does not disclose the alcohol content of the beverage or require subjects to report on mood attributable to alcohol. Zero-order correlations between baseline ratings of BAES adjectives (i.e., in a sober state) and ratings of adjectives after beverage consumption (i.e., at ascending and descending limbs) were examined for the placebo, low dose, and high dose conditions. Correlations between baseline ratings and post-drink ratings that decrease in magnitude as alcohol dose increases would be consistent with the idea that BAES responses with this instructional set are independent of sober and/or baseline ratings.
Invariance of structure
The structure of the BAES was tested for invariance across drinking history and sex, separately at both doses of alcohol, using a two-group factor analysis. Following the sequential pattern of increasingly restrictive models recommended by Vandenberg and Lance (2000), a test of configural invariance (i.e., same basic factor structure across groups when factor loadings are unconstrained) was conducted, followed by a test of metric invariance (i.e., factor loadings constrained to be equal across groups). Improvement in fit between the unconstrained model (model with factor loadings freely varying) with a constrained model (model with factor loadings constrained to be equal) was tested for statistical significance by computing the differences in χ2 and differences in the degrees of freedom from the two models being compared.
Brief version of the BAES
The corrected item-total correlations (i.e., the extent to which each item correlates with the scale score without that item), and communality (i.e., the extent to which an item shares variance with the other items) from the reliability analysis were examined to identify items that contributed the least to the internal consistency of the subscales. The items with the lowest values on both indices were considered for exclusion (DeVellis, 1991). The final decision on retaining items was made based on the consistency with which items demonstrated the highest item-total correlations (Nunnally, 1978). The psychometric analyses on the brief version included a test of the internal consistency reliability of the new subscales using Cronbach's alphas, a test of the the underlying factor structure using confirmatory factor analysis, a test of criterion-related validity by comparing the shortened subscales to the corresponding subscales of the full version, and a test of convergent/discriminant validity by comparing the pattern of correlations with the PANAS scales and select ARCI scales.
Results
Participant Characteristics
The average age of the sample was 25.6 years (± 3.2 SD) and average education level was 16.1 years (± 1.8 SD). The sample was evenly distributed across sex (45% female), and was racially and ethnically diverse, with 77% Caucasian (n = 137), 11% African American (n = 20), 7% Asian American (n = 13), 6% Hispanic/Latino (n = 12), and 4% Other (n = 8). Based on the last six-month drinking patterns, subjects with light drinking history consumed alcohol 1.4 (0.7) times per week with a typical consumption of 1.9 (0.7) drinks per occasion with a maximum consumption on one occasion of 4.4 (1.7) drinks. Those with heavy drinking history consumed alcohol 3.7 (1.3) times per week with a typical consumption of 6.2 (3.6) drinks per occasion with a maximum consumption on one occasion of 14.8 (8.4) drinks. There were no statistical differences between men and women on these drinking parameters after controlling for differences in body water.
Underlying Factor Structure
The four-factor model, hypothesized to be the best-fitting model was tested first, by representing stimulant and sedative constructs at the ascending and descending limb. Thus, the 7 stimulation items from the ascending limb represented one latent construct (Ascending Stimulation), the 7 sedation items from the ascending limb represented the second latent construct (Ascending Sedation), the 7 stimulation items from the descending limb represented the third latent construct (Descending Stimulation) and the 7 sedation items from the descending limb represented the fourth latent construct (Descending Sedation). The results indicated that this model provided a good fit to the data at both the low dose and high dose (see Table 1). Further, the correlations between the stimulant and sedative constructs at ascending and descending limbs were -0.14 and -0.25 for low dose, and -0.34 and -.28 for high dose, respectively.
Table 1.
Test of 5 Competing Models Representing the Underlying Factor Structure of the BAES at Low and High Doses of Alcohol Consumption
| Low dose | High dose | |||
|---|---|---|---|---|
| Models tested | CFI | SRMR | CFI | SRMR |
| Model 1: 4-factor | 0.94 | 0.06 | 0.94 | 0.08 |
| Model 2: 2-factor (Limb) | 0.61 | 0.28 | 0.60 | 0.24 |
| Model 3: 2-factor (Effect) | 0.75 | 0.10 | 0.73 | 0.10 |
| Model 4: 1-factor model | 0.48 | 0.30 | 0.48 | 0.27 |
| Model 5: 6-factor model | 0.93 | 0.06 | 0.92 | 0.07 |
N= 190.
CFI, comparative fit index; SRMR, standardized root mean square residual.
Model 2 tested for two distinct factors representing alcohol effects at the ascending and descending limbs, without a distinction between stimulant and sedative effects. Thus, the 7 stimulation items and the 7 sedation items from the ascending limb represented one latent construct (Ascending Limb), and the 7 stimulation items and the 7 sedation items represented the second latent construct (Descending Limb). Model 3 tested for two distinct factors representing the stimulant and sedative effects of alcohol, without a distinction between the ascending or descending limbs. Thus, the 7 stimulation items from the ascending limb and the same 7 items from the descending limb represented one latent construct (Stimulation), and the 7 sedation items from both limbs represented the second latent construct (Sedation). Model 4 tested for one global factor representing alcohol effects, without a distinction between limb or effect. Thus, all 28 items were loaded onto one latent factor. All fit indices for these models indicated a poor fit to the data (Table 1). Model 5 tested for six distinct factors representing stimulation and sedation at baseline, and the ascending and descending limbs. The results indicated that this model provided a good fit to the data at both doses (Table 1). Further, the correlations between the stimulant and sedative constructs at baseline were -0.16 for low dose, and -0.09 for high dose.
To empirically address the utility of the BAES using an instructional set without reference to alcohol's effect and potential baseline dependence, zero-order correlations between baseline ratings and post-drink ratings were examined in the placebo, low dose, and high dose groups (see Table 2). Results showed that the magnitude of the correlations decreased as alcohol dose increased. As would be expected, the magnitude of the correlations between baseline ratings and post-drink ratings for stimulant effects were strong (Cohen, 1992) with a placebo beverage, since all ratings were made in a sober state. The magnitude of the correlations with a low alcohol content beverage was moderately strong to strong, but moderate with a high alcohol content beverage. The pattern of decreasing correlations with increasing dose held for ratings of sedative effects: the magnitude of the correlations were moderate for placebo beverage, small to moderate for low alcohol content beverage, and small for high alcohol content beverage (Cohen, 1992).
Table 2.
Correlations Between Baseline Ratings and Postdrink Ratings of Stimulation and Sedation on the Ascending and Descending Limbs of the BAC for Placebo, Low, and High Dose of Alcohol
| Stimulation | Sedation | |
|---|---|---|
| Placebo | ||
| Ascending | 0.85 | 0.62 |
| Descending | 0.79 | 0.54 |
| Low dose | ||
| Ascending | 0.74 | 0.34 |
| Descending | 0.75 | 0.40 |
| High dose | ||
| Ascending | 0.55 | 0.27 |
| Descending | 0.63 | 0.29 |
Invariance of Structure
The four-factor model was tested for invariance across drinking history and sex using a two-group approach, at both doses of alcohol. First, the four-factor model was tested with no constraints on the parameters, and results showed that this model provided an adequate fit to the data for light and heavy drinkers, and for men and women, at low and high doses of alcohol (CFI ranged from 0.90 to 0.91, and the SRMR ranged from 0.08 to 0.09). Next, the four-factor model was tested constraining the path coefficients to be equal across groups, which also provided an adequate fit to the data (CFI ranged from 0.90 to 0.91, and SRMR ranged from 0.08 to 0.09). Finally, the nested model comparison of the unconstrained with the constrained model demonstrated no statistical differences between models across drinking history and sex, at both doses. This demonstrates no improvement in fit by constraining path coefficients to be equal, suggesting invariance of structure across these groups.
Internal Consistency Reliability
The internal consistency reliability of the original BAES subscales was tested using Cronbach's alpha. After the low dose of alcohol, the Stimulation and Sedation subscales had alpha values of 0.94 and 0.90, respectively at the ascending limb, and 0.95 and 0.93, respectively at the descending limb. After the high dose of alcohol, the Stimulation and Sedation subscales had alpha values of 0.94 and 0.91, respectively at the ascending limb, and 0.95 and 0.93, respectively at the descending limb. These values were greater than or equal to the criterion value (alphas ≥ 0.90) supporting the possibility of assessing stimulant and sedative effects with fewer items (DeVellis, 1991); thus exploratory analyses were conducted to reduce the number of items of the BAES.
Psychometric Properties of the Brief-BAES
Item analyses of the BAES
An item analysis to reduce the number of items of the BAES was conducted using the item-total correlations and communalities at both the low and high dose of alcohol. This was done first for the full sample (see Table 3). Results consistently suggested that items 4 (Energized), 5 (Excited), and 13 (Up) met criteria for retaining in the Stimulation subscale, and items 8 (Sedated), 9 (Slow Thoughts), and 10 (Sluggish) met criteria for retaining in the Sedation subscale. These item analyses were repeated separately by drinking history and sex, and the results were consistent with those on the full sample. The only exception was found for the Sedation subscale for heavy drinkers at a high dose of alcohol, which did not find item 8 (Sedated) was as strong as items 9 (Slow Thoughts) and 10 (Sluggish). Taking all these results together, six of the original 14 items were retained for a brief version, referred to as the “Brief-BAES,” or B-BAES. The Stimulation subscale of the B-BAES (B-Stimulation) consisted of Energized, Excited, and Up, and the Sedation subscale of the BAES (B-Sedation) consisted of Sedated, Slow Thoughts, and Sluggish.
Table 3.
Item Analysis of the BAES at the Ascending and Descending Limbs of the Blood Alcohol Curve With Varying Dosage of Alcohol
| Low dose | High dose | ||||||||
|---|---|---|---|---|---|---|---|---|---|
| Ascending Limb | Descending Limb | Ascending Limb | Descending Limb | ||||||
| Subscales | Items | r | R2 | r | R2 | r | R2 | r | R2 |
| Stimulation | Elated | 0.69 | 0.51 | 0.74 | 0.64 | 0.70 | 0.54 | 0.73 | 0.56 |
| Energized | 0.86 | 0.81 | 0.90 | 0.85 | 0.88 | 0.82 | 0.89 | 0.85 | |
| Excited | 0.88 | 0.83 | 0.91 | 0.87 | 0.83 | 0.77 | 0.90 | 0.86 | |
| Stimulated | 0.74 | 0.56 | 0.81 | 0.69 | 0.73 | 0.58 | 0.77 | 0.61 | |
| Talkative | 0.78 | 0.68 | 0.76 | 0.68 | 0.77 | 0.65 | 0.80 | 0.72 | |
| Up | 0.87 | 0.82 | 0.88 | 0.82 | 0.89 | 0.83 | 0.89 | 0.82 | |
| Vigorous | 0.82 | 0.69 | 0.81 | 0.68 | 0.77 | 0.64 | 0.86 | 0.74 | |
| Sedation | Difficulty concentrating | 0.62 | 0.43 | 0.73 | 0.55 | 0.66 | 0.46 | 0.71 | 0.57 |
| Down | 0.53 | 0.29 | 0.65 | 0.45 | 0.54 | 0.30 | 0.65 | 0.49 | |
| Heavy head | 0.68 | 0.49 | 0.69 | 0.51 | 0.75 | 0.58 | 0.78 | 0.64 | |
| Inactive | 0.61 | 0.38 | 0.75 | 0.58 | 0.77 | 0.60 | 0.76 | 0.60 | |
| Sedated | 0.80 | 0.69 | 0.88 | 0.81 | 0.75 | 0.62 | 0.76 | 0.62 | |
| Slow thoughts | 0.84 | 0.75 | 0.89 | 0.81 | 0.87 | 0.77 | 0.90 | 0.84 | |
| Sluggish | 0.81 | 0.74 | 0.88 | 0.80 | 0.86 | 0.77 | 0.85 | 0.78 | |
r, corrected item-total correlation; R2, shared variance with all other items; items in bold font are the highest 3 statistics for each subscale.
Reliability and validity evidence for the Brief-BAES
A confirmatory factor analysis of the B-BAES was conducted testing the four-factor model previously demonstrated as the best-fitting model for the total sample at both low and high doses of alcohol. The CFI = 0.99, and the SRMR = 0.04 for both low and high dose, which suggest an excellent fit to the data. The correlations between the stimulant and sedative constructs at the ascending and descending limbs were -0.18 and -0.27 for the low dose, and -0.38 and -0.29 for the high dose, respectively. Additionally, the six-factor model, which included stimulant and sedative constructs at baseline, as well as the ascending and descending limbs, was also tested, and offered an excellent fit to the data at low dose (CFI = 0.99, and the SRMR = 0.04) and high dose (CFI = 0.98, and the SRMR = 0.04). The correlations between the stimulant and sedative constructs at baseline were -0.19 for the low dose, and -0.12 for the high dose. As with the original BAES, the internal consistencies of the B-Stimulation and B-Sedation subscales were excellent (alphas ranged from 0.91 to 0.95) at both low and high doses of alcohol.
Criterion-related validity of the B-BAES was tested by comparing the pattern of intercorrelations between the B-Stimulation and B-Sedation subscales with those from the original version. The correlations ranged from 0.95 to 0.98 (see Table 4). Figure 1 highlights the correlations between the original BAES and B-BAES Stimulation subscales at the ascending limb, and Sedation subscales at the descending limb, which may be of most relevance to biphasic alcohol effects studies. Next, convergent/discriminant validity was tested by investigating the pattern of correlations between subscales of the B-BAES with the PANAS scales and select ARCI scales. These were examined at both low and high doses of alcohol on the ascending and descending limbs (see Table 4). Supporting the convergent validity of the B-BAES, the B-Stimulation subscale was significantly and positively related with the Positive Affect (PA) scale of the PANAS, as well as the Morphine-Benzedrine Group (MBG) and Amphetamine (A) scales of the ARCI in all four analyses. In addition, the B-Sedation subscale was significantly and positively related to the Negative Affect (NA) scale of the PANAS in all four analyses, and was significantly related to the Pentobarbital-Chlorpromazine-Alcohol Group (PCAG) scale in three of four analyses. In addition, the B-Stimulation subscale was significantly but negatively related to the ARCI-PCAG, and the B-Sedation subscale was significantly but negatively related to the PANAS-PA. Supporting the discriminant validity of the B-BAES, the B-Stimulation subscale was not related to the PANAS-NA in all four analyses and the B-Sedation subscale was not related to the ARCI-A in three of four analyses.
Table 4.
Correlations Between the Brief-BAES Subscales With Corresponding Full BAES Subscales, and PANAS and ARCI Scales at Low and High Dose of Alcohol
| Ascending | Descending | ||||
|---|---|---|---|---|---|
| Dose | Scales | Stim | Sed | Stim | Sed |
| Low | Full BAES | 0.96** | 0.95** | 0.98** | 0.97** |
| PANAS Positive Affect | 0.83** | −0.20** | 0.86** | −0.29** | |
| PANAS Negative Affect | 0.07 | 0.30** | 0.01 | 0.38** | |
| ARCI-MBG scale | 0.48** | −0.08 | 0.27** | 0.03 | |
| ARCI-A scale | 0.45** | 0.03 | 0.23** | −0.02 | |
| ARCI-PCAG scale | −0.39** | 0.68** | −0.13 | 0.18* | |
| High | Full BAES | 0.97** | 0.96** | 0.97** | 0.96** |
| PANAS Positive Affect | 0.75** | −0.32** | 0.81** | −0.31** | |
| PANAS Negative Affect | 0.13 | 0.31** | 0.06 | 0.34** | |
| ARCI-MBG scale | 0.52** | −0.21** | 0.27** | 0.10 | |
| ARCI-A scale | 0.45** | −0.23** | 0.20** | 0.06 | |
| ARCI-PCAG scale | −0.48** | 0.76** | −0.10 | 0.02 | |
Stim, Sed = Stimulation and Sedation subscales using the Brief-BAES; correlations with the Full BAES are with corresponding subscales; MBG scale, Morphine-Benzedrine Group (Euphoria) subscale; A scale, Amphetamine (Stimulant) scale; PCAG scale, Pentobarbital-Chlorpromazine-Alcohol Group (Sedation) scale.
p < 0.05,
p < 0.01.
Figure 1.
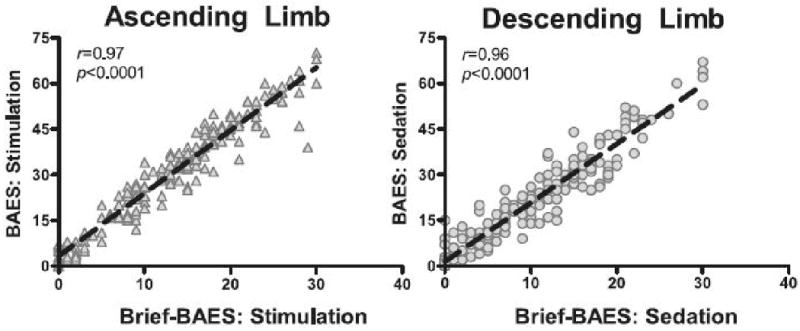
Correlation between Stimulation ratings measured from the Brief-BAES and the BAES during the rising limb of the BAC (30 minutes after the initiation of beverage consumption), and Sedation ratings during the declining limb of the BAC (120 minutes after the initiation of beverage consumption). Both correlations are from the high alcohol dose (0.8 g/kg).
Discussion
The results of the current investigation demonstrated support for the BAES as a measure of the stimulant- and sedative-like effects of alcohol in the context of a computerized, self-administered version of the scale. More specifically, confirmatory factor analyses demonstrated adequate support for a four-factor structure, i.e., stimulation and sedation at the ascending and descending limbs as distinct constructs, after ingestion of both a low (2-3 drink equivalent) and high (4-5 drink equivalent) dose of alcohol, which was invariant across drinking history and sex. The stimulation and sedation constructs were also supported at pre-consumption baseline in a six-factor model. In addition, the pattern of correlations between baseline ratings of adjectives and post-drink ratings of adjectives demonstrated the predicted decrease in magnitude as dose of alcohol increased. This supports the capacity to assess the biphasic effects of alcohol using the BAES without disclosing the alcohol content of the beverage.
Further, the present study's exploratory item analyses showed support for a 57% reduced version of the scale, the 6-item B-BAES. The items comprising the B-BAES include Energized, Excited, and Up on the B-Stimulation subscale, and Sedated, Slow Thoughts, and Sluggish on the B-Sedation subscale. Interestingly, the fit indices in the confirmatory factor analysis of the B-BAES were excellent, compared to those of the original BAES, which were adequate. Related, the internal consistency of the B-BAES subscales continued to be excellent, in spite of a reduction in items from seven to three per subscale. The correlations between the B-BAES subscales and the PANAS Positive and Negative Affect scales, and select scales of the ARCI demonstrated a pattern of associations in support of the two distinct constructs assessed. Combined with the very strong magnitude of the correlations between the B-BAES and full BAES subscale scores (r's > .95; see Table 4), these findings suggest that the B-BAES provides a parsimonious method to assess the stimulant- and sedative-like effects of alcohol. This reduction in items may increase the utility of the BAES for research designs that are constrained by time or paradigm factors, such as those employing functional brain imaging, ecological momentary assessment, or multiple timepoints, and/or constrained by time due to assessment of alcohol's effects on multiple domains.
To our knowledge, the current investigation is the first study that demonstrates the predicted factor structure of the BAES even when instructions do not disclose the beverage content or ask for subjects to rate mood specifically attributable to alcohol's effects. In addition, the pattern of correlations between baseline (i.e., sober) ratings and post-drink ratings is consistent with the idea that BAES responses with this instructional set are independent of ratings of mood when sober. Although the BAES was developed with the intention of assessing subjects' ratings of mood specifically related to alcohol's effect, numerous investigators have used modified instructions, and have employed a baseline pre-drink assessment (Blomqvist et al., 2002; Brunelle et al., 2007; Davidson et al., 2002; Epstein et al., 2007; Erblich and Earlywine, 2003; Erblich et al., 2003; King et al., 2002; Morzorati et al., 2002; Ray and Hutchison, 2007), and/or stressed the importance of baseline assessments if they were not taken (Thomas et al., 2004). However, use of these parameters has been beyond that of the original factor analytic studies (Earlywine & Erlich, 1996; Martin et al., 1993). The results of the current study support the use of the BAES without relying on subjects' ability to reliably discriminate between general mood states and those attributed to alcohol's effects.
There were several findings that were not related to the main purpose of the study that are also worthy of highlighting. First, there was an interesting pattern of findings in the correlations between pre-drink ratings at baseline (i.e., sober ratings) and post-drink ratings at the ascending and descending limb after alcohol consumption (Table 2): Stronger relationships were observed for the Stimulation subscale compared with Sedation subscale. We may speculate that baseline sober state mood within a nonclinical sample may be more strongly associated with the adjectives that comprise the Stimulation subscale (e.g., excited, talkative) and than the Sedation subscale (e.g., heavy-headed, sedated). Endorsement of positive-like adjectives versus negative-like adjectives at baseline may also be due to demand characteristics. Overall, the relationship between pre-drink ratings and post-drink ratings for both stimulation and sedation decreased as a function of alcohol dose, suggesting that BAES responses over the BAC curve are distinct from BAES responses when sober, even when using an instructional set that does not disclose alcohol content.
Another set of interesting results is related to the pattern of correlations between B-BAES subscales and other measures previously used in alcohol studies (Table 4). For the Stimulation subscale, the magnitude of the correlations with the ARCI Morphine-Benzedrine Group (MBG) and Amphetamine (A) scales was stronger at the ascending limb compared to the descending limb but the correlations with PANAS-Positive Affect (PA) scale were similar across limbs. We could speculate that the PANAS-PA may be capturing effects closer to the stimulant-like effects of alcohol than the ARCI scales. Similarly, the magnitude of the correlation between the B-Sedation subscale with the PANAS-Negative Affect (NA) scale was similar across limbs, but smaller in magnitude than the associations between the positive-like measures. In addition, the correlations between the B-Sedation subscale with the ARCI- Pentobarbital-Chlorpromazine-Alcohol Group (PCAG) scales were considerably weaker during the descending compared with ascending limb. This pattern of findings is consistent with the fact that the PANAS-NA and ARCI-PCAG are capturing constructs beyond the sedative-like effects of alcohol, e.g., hostility, anger and anxiety on the PANAS-NA, and reversed-scored stimulation items on the ARCI-PCAG. Taken together, these results highlight potential differences inherent in the use of these other measures, which are sensitive to some alcohol effects compared to the BAES, but may be capturing other biobehavioral aspects of alcohol effects beyond stimulation and sedation.
One final meaningful result involves a difference between this investigation and the two previous BAES psychometric investigations. In the current study, associations between the stimulant and sedative constructs were negative, suggesting that they represent inversely-related and potentially opposing constructs. However, the two previous investigations analyzing the factor structure of the BAES (Earlywine & Erblich, 1996; Martin et al., 1993) found positive correlations between these constructs. Some may argue that the subject's ability to discern mood effects influenced by alcohol compared with their typical mood state at that time may be unreliable. On the other hand, the converse could also be argued, i.e., assessing alcohol's effects on mood without specifying alcohol as the causal factor may be unreliable. Unfortunately, direct comparisons on the relationship between the subscales in the former studies with the current study is hampered by differences across the studies on subject characteristics (i.e., sex, age, level of social drinking, etc.), alcohol dose levels, and/or administration instructions, all of which may affect alcohol responses. Thus, more work should focus on clarifying the relationship between these two subscales. However, with the present study's findings, investigators should be able to use the BAES (or the B-BAES) without concerns about the psychometric properties of employing a pre-drink baseline, or assessing current mood state without disclosing the beverage content.
There were several strengths and limitations within the current study that can guide future research in this area. In terms of strengths, the factor structure was tested at both low and high alcohol doses within the same subjects using a confirmatory approach. Also, the sample was larger and more diverse, both in sex and race/ethnicity, than previous validation studies, which provides additional support for the generalizability of these findings across samples. However, in terms of limitations, the sample had neither sufficient numbers of racial/ethnic minorities nor extensive age ranges (i.e., middle age or older adults) to allow for full subgroup examination of alcohol responses. In addition, the exploratory examination of the B-BAES did not allow for cross-validation of it's psychometric properties in an independent sample. While the results of these analyses are promising, further tests to support and replicate the results with the briefer version may be needed before it can be used with confidence. Finally, the BAES does not thoroughly assess the host of alcohol's biobehavioral and mood effects; thus it may be important to use multiple measures to capture alcohol's wide-ranging effects.
In summary, the current investigation expands the utility of the BAES by demonstrating robust psychometric properties in pre-post change designs, using an instructional set that does not disclose the alcohol content of the beverage. Further, the BAES offers a reliable and valid measure of stimulation and sedation at lower and higher doses of alcohol, in lighter and heavier drinkers, and in men and women. The utility of the BAES is expanded by the introduction of a brief version (i.e., 3 items per subscale) that retains the strong psychometric properties of the original scale. However, while results of the B-BAES are promising, further research is warranted to test the psychometric properties of the B-BAES in an independent sample to ensure its reliability and validity in capturing the stimulant and sedative effects of alcohol.
Acknowledgments
Supported by NIH/NIAAA #R01-AA013746, Cancer Center P30-CA14599, National Center for Research Resources Grant # UL1RR024999
Footnotes
Presented in part at the 2007 Annual Meeting of the Research Society on Alcoholism, Chicago IL
References
- Arbuckle JL. Amos 6.0 User's Guide. SPSS Inc; Chicago: 2005. [Google Scholar]
- Berridge KC. The debate over dopamine's role in reward: The case for incentive salience. Psychopharmacology (Berlin) 2007;191:391–431. doi: 10.1007/s00213-006-0578-x. [DOI] [PubMed] [Google Scholar]
- Blomqvist O, Hernandez-Avila CA, Van Kirk J, Rose JE, Kranzler HR. Mecamylamine modifies the pharmacokinetics and reinforcing effects of alcohol. Alcohol Clin Exp Res. 2002;26:326–331. [PubMed] [Google Scholar]
- Brumback T, Cao D, King AC. Effects of alcohol on psychomotor performance and perceived impairment in heavy binge social drinkers. Drug Alcohol Depend. 2007;91:10–17. doi: 10.1016/j.drugalcdep.2007.04.013. [DOI] [PMC free article] [PubMed] [Google Scholar]
- Brunelle C, Barrett SP, Pihl RO. Relationship between the cardiac response to acute intoxication and alcohol-induced subjective effects throughout the blood alcohol concentration curve. Hum Psychopharmacol Clin Exp. 2007;22:437–443. doi: 10.1002/hup.866. [DOI] [PubMed] [Google Scholar]
- Cohen J. A power primer. Psychol Bull. 1992;112:155–159. doi: 10.1037//0033-2909.112.1.155. [DOI] [PubMed] [Google Scholar]
- Conrod PJ, Peterson JB, Pihl RO, Mankowski S. Biphasic effects of alcohol on heart rate are influenced by alcoholic family history and rate of alcohol ingestion. Alcohol Clin Exp Res. 1997;21:140–149. [PubMed] [Google Scholar]
- Conrod PJ, Peterson JB, Pihl RO. Reliability and validity of alcohol-induced heart rate increase as a measure of sensitivity to the stimulant properties of alcohol. Psycho alcohol-induced heart rate increase as a measure of sensitivity to the stimulant properties of alcohol. Psychopharmacology (Berl) 2001;157:20–30. doi: 10.1007/s002130100741. [DOI] [PubMed] [Google Scholar]
- Davidson D, Hutchison K, Dagon C, Swift R. Assessing the stimulant effects of alcohol in humans. Pharmacol Biochem Behav. 2002;72:151–156. doi: 10.1016/s0091-3057(01)00758-4. [DOI] [PubMed] [Google Scholar]
- DeVellis RF. Scale development: Theory and applications. Sage; Newbury Park: 1991. [Google Scholar]
- Earleywine M, Erblich J. A confirmed factor structure for the biphasic alcohol effects scale. Exp Clin Psychopharmcol. 1996;4:107–113. [Google Scholar]
- Epstein AM, Sher TG, Young MA, King AC. Tobacco chippers show robust increases in smoking urge after alcohol consumption. Psychopharm (Berlin) 2007;190:321–329. doi: 10.1007/s00213-006-0438-8. [DOI] [PubMed] [Google Scholar]
- Erblich J, Earleywine M. Behavioral undercontrol and subjective stimulant and sedative effects of alcohol intoxication: Independent predictors of drinking habits. Alcohol Clin Exp Res. 2003;27:44–50. doi: 10.1097/01.ALC.0000047300.46347.CE. [DOI] [PubMed] [Google Scholar]
- Erblich J, Earleywine M, Erblich B, Bovbjerg DH. Biphasic stimulant and sedative effects of ethanol: Are children of alcoholics really different. Addict Behav. 2003;28:1129–1139. doi: 10.1016/s0306-4603(02)00221-6. [DOI] [PubMed] [Google Scholar]
- Fillmore MT, Marczinski CA, Bowman AM. Acute tolerance to alcohol effects on inhibitory and activational mechanisms of behavioral control. J Stud Alcohol. 2005;66:663–672. doi: 10.15288/jsa.2005.66.663. [DOI] [PubMed] [Google Scholar]
- Finn PR, Pihl RO. Men at risk for alcoholism: The effect of alcohol on cardiovascular response to unavoidable shock. J Abnormal Psych. 1987;96:230–236. doi: 10.1037//0021-843x.96.3.230. [DOI] [PubMed] [Google Scholar]
- Finn PR, Zeitouni NC, Pihl RO. Effects of alcohol on psychophysiological hyperreactivity to nonaversive and aversive stimuli in men at high risk for alcoholism. J Abnormal Psych. 1990;99:79–85. doi: 10.1037//0021-843x.99.1.79. [DOI] [PubMed] [Google Scholar]
- Frezza M, di Padova C, Pozzato G, Terpin M, Baraona E, Lieber CS. High blood alcohol levels in women: the role of decreased gastric alcohol dehydrogenase activity and first-pass metabolism. N Engl J Med. 1990;322:95–99. doi: 10.1056/NEJM199001113220205. [DOI] [PubMed] [Google Scholar]
- Haertzen CA, Hill HE, Belleville RE. Development of the addiction research center inventory (arci): Selection of items that are sensitive to the effects of various drugs. Psychopharmacologia. 1963;4:155–166. doi: 10.1007/BF02584088. [DOI] [PubMed] [Google Scholar]
- Holdstock L, King AC, de Wit H. Subjective and objective responses to ethanol in moderate/heavy and light social drinkers. Alcohol Clin Exp Res. 2000;24:789–794. [PubMed] [Google Scholar]
- Hu L, Bentler PM. Fit indices in covariance structure modeling: Sensitivity to underparametized model misspecification. Psychol Methods. 1998;3:424–453. [Google Scholar]
- Judd LL, Hubbard RB, Huey LY, Atewell DA, Janowsky DS, Takahashi KI. Lithium carbonate and ethanol induced ‘highs’ in normal subjects. Arch Gen Psychiatry. 1977;34:463–467. doi: 10.1001/archpsyc.1977.01770160097008. [DOI] [PubMed] [Google Scholar]
- King AC, Houle T, de Wit H, Holdstock L, Schuster A. Biphasic alcohol response differs in heavy versus light drinkers. Alcohol Clin Exp Res. 2002;26:827–835. [PubMed] [Google Scholar]
- King AC, Byars JA. Alcohol-induced performance impairment in heavy episodic and light social drinkers. J Stud Alcohol. 2004;65:27–36. doi: 10.15288/jsa.2004.65.27. [DOI] [PubMed] [Google Scholar]
- Maisto S, Connors G, Tucker H, McCollam JB. Validation of the sensation scale, a measure of subjective physiological responses to alcohol. Behav Res Ther. 1980;18:37–41. doi: 10.1016/0005-7967(80)90067-4. [DOI] [PubMed] [Google Scholar]
- Martin CS, Earleywine M, Musty RE, Perrine MW, Swift RM. Development and validation of the biphasic alcohol effects scale. Alcohol Clin Exp Res. 1993;17:140–146. doi: 10.1111/j.1530-0277.1993.tb00739.x. [DOI] [PubMed] [Google Scholar]
- Morzorati SL, Ramchandani VA, Flury L, Li TK, O'Connor S. Self-reported subjective perception of intoxication reflects family history of alcoholism when breath alcohol levels are constant. Alcohol Clin Exp Res. 2002;26(8):1299–1306. doi: 10.1097/01.ALC.0000025886.41927.83. [DOI] [PubMed] [Google Scholar]
- McNair D, Lorr M, Droppleman L. Manual for the Profile of Mood States, Educational and Industrial Testing. San Diego: 1971. [Google Scholar]
- Newlin DB, Thomson JB. Alcohol challenge with sons of alcoholics: A critical review and analysis. Psychol Bull. 1990;108:383–402. doi: 10.1037/0033-2909.108.3.383. [DOI] [PubMed] [Google Scholar]
- Nunnally JC. Psychometric theory. 2 nd. McGraw-Hill Book Co; New York: 1978. [Google Scholar]
- Robinson TE, Berridge KC. The neural basis of drug craving: an incentive-sensitization theory of addiction. Brain Res Rev. 1993;18:247–291. doi: 10.1016/0165-0173(93)90013-p. [DOI] [PubMed] [Google Scholar]
- Ray LA, Hutchison KE. Effects of naltrexone on alcohol sensitivity and genetic moderators of medication response. Arch Gen Psychiatry. 2007;64(9):1069–1077. doi: 10.1001/archpsyc.64.9.1069. [DOI] [PubMed] [Google Scholar]
- Robinson TE, Berridge KC. Incentive-sensitization and addiction. Addiction (Abington, England) 2001;96:103–114. doi: 10.1046/j.1360-0443.2001.9611038.x. [DOI] [PubMed] [Google Scholar]
- SAMHSA. National Survey on Drug Use and Health. Office of Applied Studies; Bethesda, MD: 2005. [Google Scholar]
- Schukit MA. Subjective responses to alcohol in sons of alcoholics and control subjects. Arch Gen Psychiatry. 1984;41:879–884. doi: 10.1001/archpsyc.1984.01790200061008. [DOI] [PubMed] [Google Scholar]
- Schukit MA. Low level of response to alcohol as a predictor of future alcoholism. Am J Psychiatry. 1994;151:184–189. doi: 10.1176/ajp.151.2.184. [DOI] [PubMed] [Google Scholar]
- Sutker PB, Tabakoff B, Goist KC, Randall CL. Acute alcohol intoxication, mood states and alcohol metabolism in women and men. Pharmacol Biochem Behav. 1983;18(Supp):349–354. doi: 10.1016/0091-3057(83)90198-3. [DOI] [PubMed] [Google Scholar]
- Thomas SE, Drobes DJ, Voronin K, Anton RF. Following alcohol consumption, nontreatment-seeking alcoholics report greater stimulation but similar sedation compared with social drinkers. J Stud Alcohol. 2004;65:330–335. doi: 10.15288/jsa.2004.65.330. [DOI] [PubMed] [Google Scholar]
- Vandenberg RJ, Lance CE. A review and synthesis of the measurement invariance literature: Suggestions, practices, and recommendations for organizational research. Organ Res Meth. 2000;3:4–70. [Google Scholar]
- Watson D, Clark LA, Tellegen A. Development and validation of brief measures of positive and negative affect: The PANAS scales. J Pers Soc Psychol. 1988;54:1063–70. doi: 10.1037//0022-3514.54.6.1063. [DOI] [PubMed] [Google Scholar]
- Wise RA, Bozarth MA. A psychomotor stimulant theory of addiction. Psychol Rev. 1987;94:469–92. [PubMed] [Google Scholar]