

Abstract
Background
Adoptive transfer of naive T-lymphocyte subsets into lymphopenic mice initiates chronic gut inflammation that mimics several aspects of inflammatory bowel disease (IBD). Patients with IBD can have profound alterations in intestinal blood flow, but whether the same is true in the T-cell transfer model has yet to be determined.
Methods
In the current study, chronic intestinal inflammation was induced in recombinase-activating gene-1-deficient (RAG−/−) mice by adoptive transfer of CD4+ T-lymphocytes obtained from IL-10 deficient (IL-10−/−) mice.
Results
Four weeks later, widespread colonic inflammation was observed in the reconstituted recipients, in contrast to two control sets of mice injected with a different subset of lymphocytes or with vehicle alone. We observed that the resulting pathology induced in the reconstituted RAG−/− mice was divided distinctly into two subsets: one with blood flow near normal with very high inflammation scores, and the other with severely attenuated blood flow but with much lower signs of inflammation. Colonic and ileal blood flow rates in the latter subset of CD4+ mice averaged only ~30% compared to the mice with higher inflammation scores. The lower blood flow rates were associated with greatly reduced red blood cell concentrations in the tissue, suggesting a possible loss of vascular density.
Conclusions
In this model of chronic intestinal inflammation, mild inflammation was associated with significant decreases in blood flow.
Keywords: Crohn’s disease, colitis, arteriole, venule, perfusion
INTRODUCTION
Over thirty years ago, Hulten et al. (1)provided blood flow measurements from the colon and ileum of IBD patients. Incases of severe ulcerative colitis, colonic blood flow rates were highly elevated by more than a factor of three, but were decreased by 25–30% in mild colitis. In Crohn’s Disease patients, ileal blood flow rates were near normal in early exudative stages of disease, but decreased by 60–70% in the late fibrosing stages. Animal models have been developed to mimic IBD; however, with some of these models, there are few reports that detail whether there are alterations in blood flow. Alterations in vascular perfusion can influence nutrient and oxygen delivery, and also indirectly modify other aspects of microvascular function including blood cell adhesion to the endothelium and shear force-mediated production of endothelial-derived mediators such as nitric oxide.
In an earlier study (2), we examined via intravital microscopy the time course of altered hemodynamics in a mouse model of chronic gut inflammation. Arteriolar shear rates decreased dramatically (by more than 50%) throughout much of the 7–9 week protocol. Arteriolar flow rates decreased similarly with a peak decrease of at least 50%; however, these measurements were performed on individual arterioles via intra vital microscopy, and might not represent the total tissue perfusion if major changes were occurring in vascular density. Indeed, Chidlow et al. (3), using the same T-cell transfer model, reported approximate two-fold increases in vascular density by the end of their 8-week protocol. Therefore, if the number of small arteriolesis increased, the overall tissue perfusion could have been maintained despite the lower flow rates in individual arterioles. Therefore, the major purpose of the current study was to use Doppler flow measurements to measure regional blood flow (of both colon and ileum) in the T-cell transfer model of chronic gut inflammation.
METHODS
Animals
C57BL/6 wild type (WT), IL-10−/−, and RAG−/− mice were obtained from Jackson Labs. Animals were maintained on 12h/12h light/dark cycles in standard animal cages with filter tops under specific pathogen free (SPF) conditions in our animal care facility at LSUHSC-S and given standard laboratory rodent chow and water ad libitum. All experimental procedures involving the use of animals were reviewed and approved by the Institutional Animal Care and Use Committee of LSUHSC and performed according to the criteria outlined by the National Institutes of Health.
Induction of Chronic Intestinal Inflammation
Chronic colonic and ileal inflammation was induced in mice by the adoptive transfer of IL-10−/− CD4+ T-cells into RAG−/− recipients as previously described(4–6). Briefly, CD4+ T-cells obtained from IL-10−/− donor mice were enriched(>90%; from single cell suspensions of splenocytes)by negative selection using a commercially available kit (Dynal; Invitrogen; Carlsbad, CA) and injected (106 T-cells per mouse; i.p.) into RAG−/− recipients (N=10). The two control groups consisted of a PBS-injected RAG−/− group (Vehicle; N=9) and a group of RAG−/− mice injected with WT CD4+CD45RBlow T-cells (RBlow;N=7; 0.5 x 10⁶ cells per mouse). It is well known that adoptive transfer of CD45RBlow T-cells results in the engraftment of these lymphocytes within all lymphoid tissue and gut, but does not induce chronic gut inflammation (6). The CD45RBlow T-cells were purified by flow cytometry as previously described(6).
Microscopy and Doppler Flow Measurements
The mice were anesthetized with 150 mg/kg ketamine and 10 mg/kg xylazine, and the carotid artery was cannulated for measurements of mean arterial blood pressure. The ileum and proximal colon were then exteriorized and kept moist with warmed saline. A Doppler flow probe(Vasamedics LaserFlo Blood Perfusion Monitor BPM2; St. Paul, MN)was positioned over the exposed tissue, and measurements of blood flow rate, red blood cell volume (concentration), and red blood cell velocity were averaged over 10 sites for both colon and ileum. Astereo microscope (Zeiss; 6.4x magnification) with an attached video camera (Sony DXC-390 color camera) was used to capture images of the colonic and ileal first-order arterioles and venules leading into and out of the intestine. Diameters of the arterioles and venules (calibrated with a micrometer scale) were measured upon playback of the video. After obtaining the intravital data, the colon was excised and the mouse euthanized with 150 mg/kg pentobarbital sodium. The colons were weighed and measured for a weight-to-length ratio.
Tissue Staining
The excised colons were placed in cold phosphate-buffered saline (PBS), and processed as we have described previously (7), with one-half the lengthwise cut being used for fixed H&E sections, and the other half used for frozen immunohistochemistry. For the latter, frozen sections on the slides were washed in PBS plus 0.25% Triton X-100 (Sigma, St. Louis, MO) three times for five minutes each, then incubated with 10% normal goat serum in tris-buffered saline for two hours at room temperature to block non-specific binding. The sections were incubated overnight at 4 deg C with a 1:200 dilution of the primary antibody, rat antimouse CD31 (550274; BD Biosciences, Franklin Lakes, NJ), in PBS with 1% BSA. The sections were rinsed in PBS plus 0.25% Triton X-100 three times for five minutes each, then incubated for 1 hour at room temperature in the dark with FITC-conjugated secondary antibody, goat polyclonal antibody to rat IgG (ab7093-100, Abcam, Cambridge, MA) at a dilution of 1:250 in PBS and 1% BSA. After rinsing with PBS three times for five minutes each, the sections were mounted with a coverslip and Vectashield mounting medium containing DAPI as a nuclear counterstain. As a control, a section from each animal was labeled only with the secondary antibody. As described by Chidlow et al.(3), the number of pixels stained for PECAM-1 was divided by the number of pixels stained for DAPI in a PECAM-1/DAPI ratio.
Fixed H&E slides were scored by a blinded pathologist (S.Z.) in a method similar to that described by Pavlick et al. (8), based on the degree of inflammatory infiltrate in the lamina propria (0–3 scale), Goblet cell loss (0–2), neutrophils per 40x field (0–4), abnormal crypt architecture (0–3), number of crypt abscesses (0–1), mucosal to frank erosion (0–1), and submucosal to transmural involvement (0–3) for a total score ranging from 0–17.
Statistics
Student t-tests were used between two groups, and multiple groups were compared using analysis of variance (ANOVA) with Student-Newman-Keuls post-hoc corrections (GraphPad Instat software, San Diego, CA). Values are presented as means +/− standard error.
RESULTS
RAG−/− recipients were divided into three groups: 1) mice injected with IL-10−/− CD4+ T-cellsin PBS (IL-10−/− CD4+ ⇒ RAG−/−), 2) mice injected with PBS alone as a control(PBS ⇒ RAG−/−), and 3) mice injected with WT CD4+CD45RBlow T-cells as a second control(CD45RBlow⇒ RAG−/−). Over the following four-week period, PBS ⇒ RAG−/− mice gained slightly more weight (17 ± 1 %) than IL-10−/− CD4+ ⇒ RAG−/− or CD45RBlow ⇒ RAG−/− mice (10 ± 2 % and 10 ± 1 %, respectively; p<0.05).
The diameters of feed arterioles were measured in the three groups of mice. Arterioles in the colon of the IL-10−/− CD4+ ⇒ RAG−/− mice were dilated by ~50% compared to controls (Fig 1A); in the ileum, the vasodilation compared to controls was ~30–40% (Fig 1B). Considering that resistance to flow is inversely proportional to the fourth power of diameter, these 30–50% increases in diameter could decrease arteriolar flow resistance by a factor of 3–5, and could be expected to be associated with a dramatic increase in flow. However, as shown in Figure 2, there was not even a tendency for increased flow in either the colon or ileum in the IL-10−/−CD4+ ⇒ RAG−/− mice compared to controls.
Figure 1.
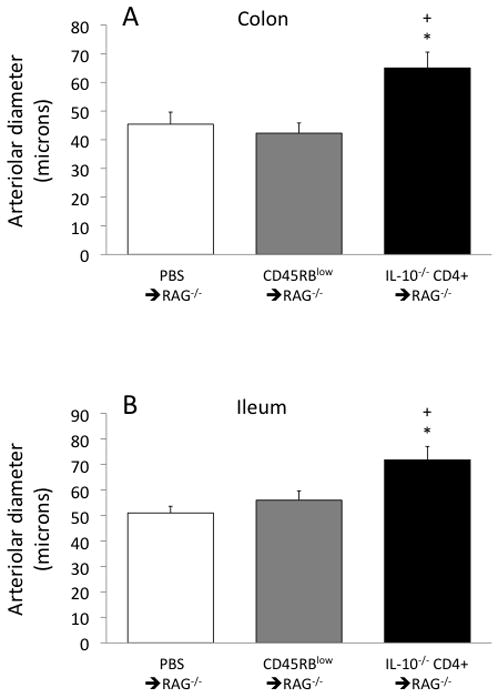
Arteriolar diameters in the colon (panel A) and ileum (panel B) in the three groups of mice. *p<0.05 vs PBS ⇒ RAG−/− and +p<0.05 vs CD45RBlow⇒ RAG−/−.
Figure 2.
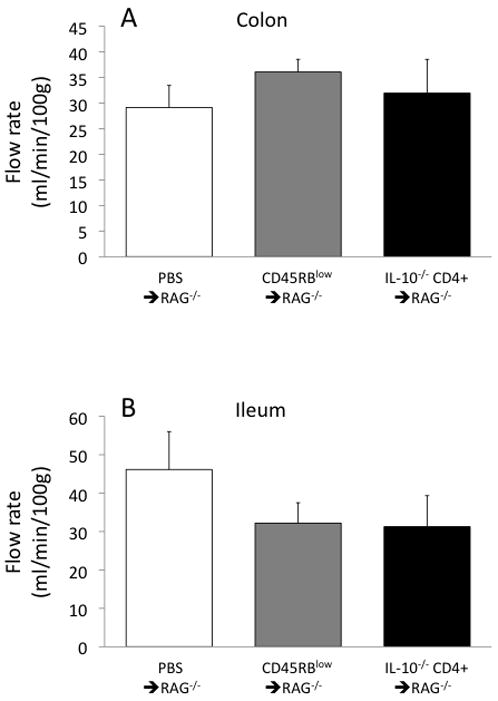
Blood flow ratesin the colon (panel A) and ileum (panel B) in the three groups of mice.
At least two explanations could be proposed for the lack of increased flow despite dramaticarteriolar dilation. The first explanation could be a substantial decrease in mean arterial pressure in the IL-10−/− CD4+ ⇒ RAG−/− mice, but the tendency for a decrease did not reach statistical significance(53 ± 3 mmHg in the IL-10−/− CD4+ ⇒ RAG−/− mice vs 62 ± 2 and 59 ± 4 mmHg in the PBS ⇒ RAG−/− and CD45RBlow⇒ RAG−/− groups, respectively). A second explanation could be that the arteriolar dilation is offset by an increased flow resistance in another segment of the microcirculation. However, smaller diameters (increased resistances) were not found for the first-order draining venules, which in the colon averaged 109 ± 8 microns for the IL-10−/− CD4+ ⇒ RAG−/− mice, compared to 92 ± 9 and 83 ± 8 microns for the PBS⇒ RAG−/− and CD45RBlow⇒ RAG−/− groups, respectively (no statistical differences). Similarly, in the ileum, venule diameters averaged 116 ± 8 microns in the IL-10−/− CD4+ ⇒ RAG−/− mice, compared to 96 ± 7 and 96 ± 5 microns in the PBS ⇒ RAG−/− and CD45RBlow⇒ RAG−/− groups (no statistical differences).
However, decreases in microvascular density, if they exist, could increase flow resistance and could offer at least a partial explanation for the lack of increase in flow despite substantial arteriolar vasodilation. One indicator of vascular density is the ratio of PECAM-1/DAPI staining in tissue cross-sections(3). As shown in Figure 3, the PECAM-1/DAPI ratio tended to be 18–26% lower in the IL-10−/− CD4+ ⇒ RAG−/− mice compared to the controls, but with substantial variability in the IL-10−/− CD4+ ⇒ RAG−/− group. Similarly, RBC volume, as measured with the Doppler flow meter, tended to be ~25% lower in the IL-10−/− CD4+ ⇒ RAG−/−mice (Fig 4), also suggesting a potential loss of microcirculation. Once again, however, there was substantial variability in the IL-10−/− CD4+ ⇒ RAG−/− group, which was further investigated as described below.
Figure 3.
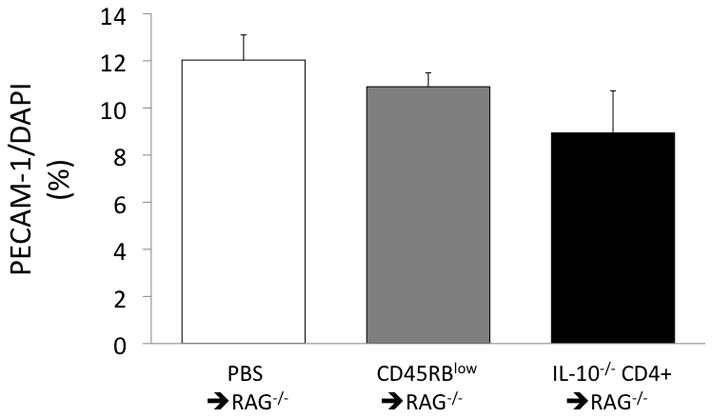
Ratio of PECAM-1 to DAPI staining (presented as %) of the colon in the three groups of mice.
Figure 4.
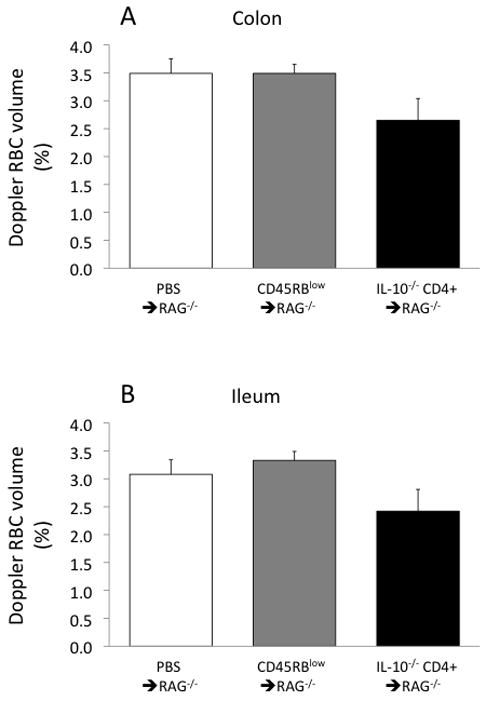
Red blood cell volume (concentration) in the colon (panel A) and ileum (panel B) in the three groups of mice.
The IL-10−/− CD4+ ⇒ RAG−/− group of mice had considerable variability in the inflammatory state of the colon as assessed via H&E staining. Pathological scores were very low in the two control groups, but were significantly higher in the IL-10−/− CD4+ ⇒ RAG−/− group. However, as shown in Figures 5 and 6, the inflammatory state of the IL-10−/− CD4+ ⇒ RAG−/−mice was divided into two distinct subsets consisting of mild inflammation (pathology score = 2–5) and severe inflammation (score = 13–16). Additionally, the colon weight-to-length ratio, which correlates well with blinded histopathology (6), was significantly more elevated in the severe inflammation subset than in the mild inflammation subset, but with the mild inflammation subset also significantly elevated compared to either of the control groups (Fig 7).
Figure 5.
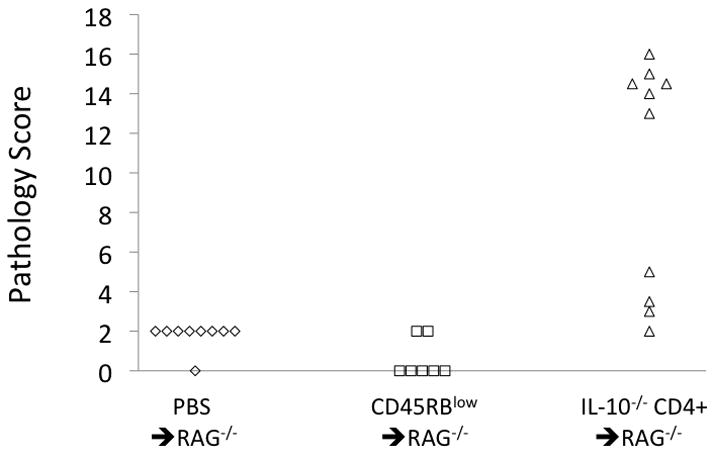
Pathology scores from H&E staining of the colon in the three groups of mice.
Figure 6.
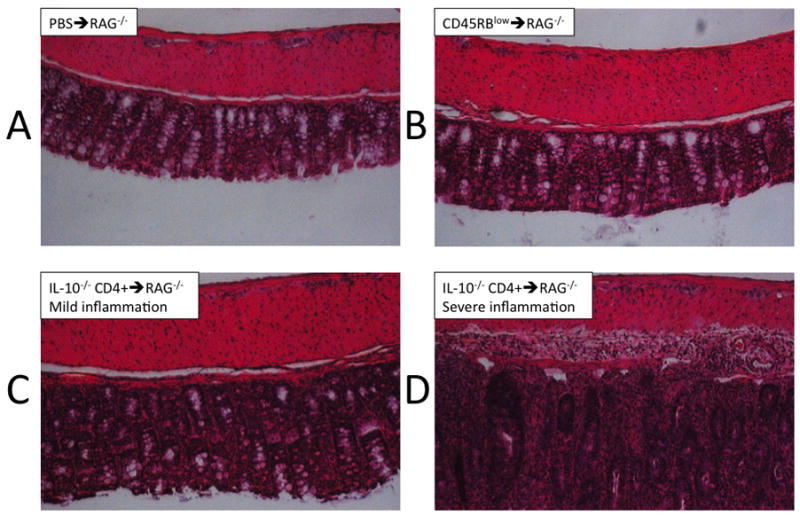
Photographs of H&E staining of the colon; examples are shown from both subsets of the IL- 10−/− CD4+ ⇒ RAG−/− mice as segregated by pathology score.
Figure 7.
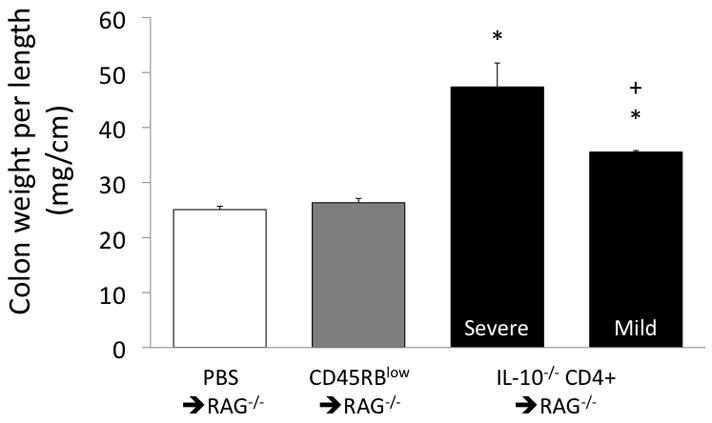
Colon weight per unit length in the groups of mice, with the IL-10−/− CD4+ ⇒ RAG−/− mice segregated by their H&E scores into mild and severe inflammation subsets. *p<0.05 vs both PBS⇒ RAG−/− and CD45RBlow⇒ RAG−/−; +p<0.05 vs the IL-10−/− CD4+ ⇒ RAG−/− severe inflammation subset.
This variability in the inflammatory state in the IL-10−/− CD4+ ⇒ RAG−/− mice correlated very closely with the data from the Doppler flow meter. As shown in Figure 8, colonic and ileal blood flow rates in the mild inflammation subset (12–16 ml/min/100g) were only a fraction of the blood flow rates in the severe inflammation subset (42–44 ml/min/100g). Similarly, colonic and ileal RBC volumes measured by the flow meter (Fig 9) were substantially lower in the mild inflammation subset (1.4–1.5%) compared to the severe inflammation subset (3.1–3.4%). RBC velocities ranged between 3.3 and 4.6 mm/s in the IL-10−/− CD4+ ⇒ RAG−/− mice and were not different between the mild and severe inflammation subsets, and were similar to the values obtained in the two control groups (range 2.1–4.3 mm/s; data not shown).
Figure 8.
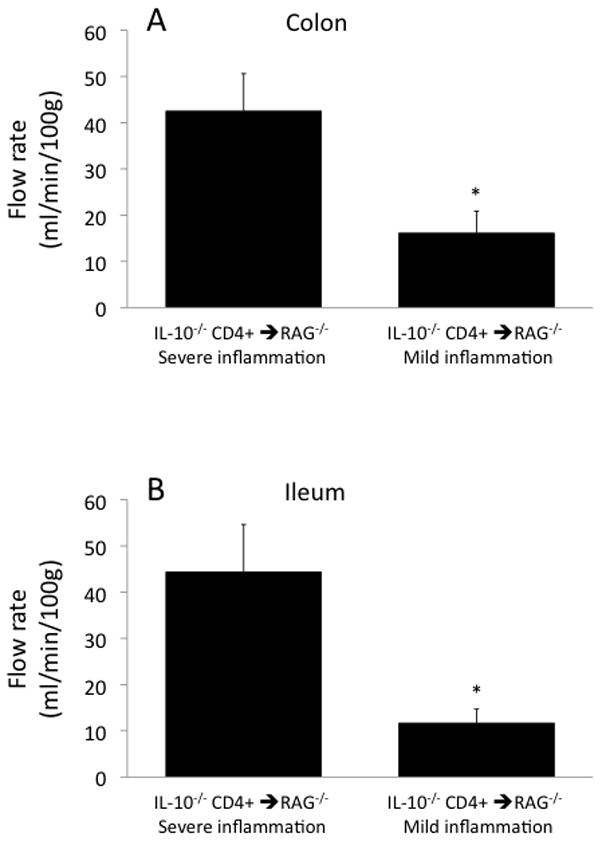
Blood flow ratesin the colon (panel A) and ileum (panel B) in the two subsets of IL-10−/− CD4+⇒ RAG−/− mice segregated by their H&E scores into mild and severe inflammation subsets. *p<0.05 vs the IL-10−/− CD4+ ⇒ RAG−/− severe inflammation subset.
Figure 9.
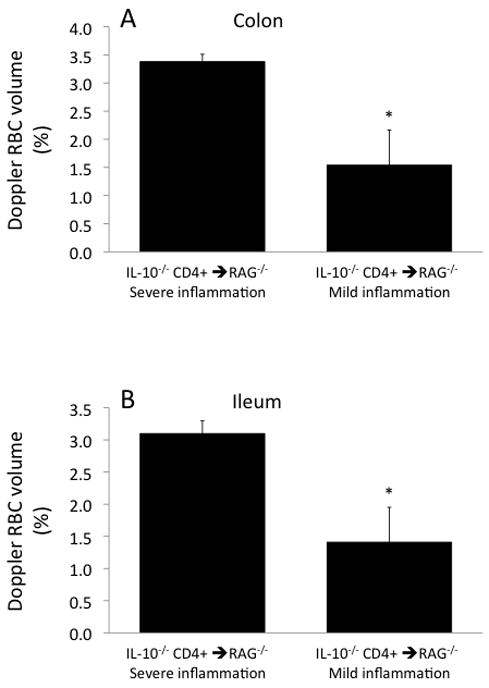
Red blood cell volume (concentration)in the colon (panel A) and ileum (panel B) in the two subsets of IL-10−/− CD4+ ⇒ RAG−/− mice segregated by their H&E scores into mild and severe inflammation subsets. *p<0.05 vs the IL-10−/− CD4+ ⇒ RAG−/− severe inflammation subset.
DISCUSSION
To date, very little information is available on the alterations in blood flow in adoptive T-cell transfer animal models of IBD. The data in this report present interesting associations in T-cell transfer mice of microvascular loss (lower blood flow rates, lower RBC concentrations, and possible loss of vascular density) correlating with lower indices of inflammation. In contrast, flow rates near, or slightly above, normal were found in the diseased mice with more severe inflammatory scores. These observations are similar to reports from human IBD patients, who have blood flow rates either above or below normal depending on the stage of the disease (1).
The dichotomy between the diseased mice having either low flow/mild inflammation or higher flow/severe inflammation prompts several questions. Were the two subsets of IL-10−/−CD4+ ⇒ RAG−/− mice on pathways of completely different outcomes? Alternatively, were their differences reflective of an ongoing cycle between low and high inflammation/flow states? Or instead of an ongoing cycle, was one subset of mice ahead of the other in a steady progression of disease, for example, does the low flow/mild inflammation state precede the higher flow/severe inflammation state in this animal model? Additionally, if the latter is true, how much if any does the low flow/low vascular density state contribute to a subsequent increase in vascularity and inflammation?
The T-cell transfer model shows transmural inflammation that extends into the ileum, as is the case with Crohn’s Disease (9). As reviewed by Thornton and Solomon (10), Crohn’s disease is associated with a reduction in the total volume of blood feeding various segments of the bowel, with evidence of ischemia contributing to the disease progression. Therefore, it is possible that the greatly reduced RBC concentrations and blood flow rate in the T-cell transfer mice may provide a good model of the pathological events occurring in humans.
The measurements of the microvascular parameters (flow rates, RBC concentrations, PECAM-1 density) may have prevented the potential incorrect interpretation that only 6/10 of the IL-10−/− CD4+ ⇒ RAG−/− transfer mice developed pathology (as could be suggested by scores of 2–5 in the mild inflammation subset compared with completely distinct scores of 13–16 in the severe inflammation subset). Indeed, a flow reduction >50% and a probable loss of capillary density (as indicated by >50% loss of RBC volume) could be speculated to initiate cellular dysfunction that may not be apparent in our scoring system, which primarily represents the inflammatory state.
In the T-cell transfer mouse model, it is possible that a phase of microvascular loss could precede and/or initiate increases in vascular endothelial growth factor (VEGF) and angiogenesis; however, this speculative progression is derived from two separate T-cell transfer models. As described by Chidlow et al. (3), 8 weeks following CD4+CD45RBhigh transfer into RAG−/− mice, there is a dramatic (~10–15 fold) increase in VEGF, and a two-fold increase in microvascular density (assessed by a lectin/DAPI ratio). At a time point of 4 weeks in our CD4+ transfer from IL-10−/− mice into RAG−/− mice, instead of a two-fold increase in vascular density, we found evidence of a decrease in vascular density (at least in a subset of the mice). Therefore, if the two different transfer models are qualitatively similar, it appears that microvascular loss may indeed precede a state of angiogenesis, although it remains to be tested whether the ischemic state initiates a pathway of hypoxia-and VEGF-mediated capillary growth.
A loss of microcirculation in IBD patients and in animal models of IBD could induce hypoxia and cell dysfunction. Whether the resulting production of hypoxia-inducible factors (HIFs) and growth factors are helpful or harmful is debatable, with the answer likely to be a mixture of both possibilities. Hypoxia-induced production of VEGF will stimulate microvascular growth that can aid tissue nutrient delivery; however, VEGF may also promote inflammation. Additionally, the HIFs that result from hypoxia have been hypothesized to be protective in IBD via induction of barrier-protective genes in the epithelium (11). It should also be mentioned that hypoxia could exist even in our subset of IL-10−/− CD4+ ⇒ RAG−/− mice with normal flow/severe inflammation, due to the large influx of oxygen-consuming active leukocytes (11).
In summary, CD4+ T-cell reconstitution of lymphopenic RAG−/− mice induced two distinct subsets of inflammatory states four weeks following the lymphocyte transfer. One subset exhibited robust inflammation with blood flow slightly above normal, while the other subset presented with milder gut inflammation but with blood flow rates and red blood cell concentrations well below normal.
Acknowledgments
This study was performed by funding from the National Institute of Diabetes and Digestive and Kidney Diseases (P01DK043785; Projects 1 and 2 plus Cores B and C).
References
- 1.Hulten L, Lindhagen J, Lundgren O, et al. Regional intestinal blood flow in ulcerative colitis and Crohn's disease. Gastroenterology. 1977;72:388–396. [PubMed] [Google Scholar]
- 2.Harris NR, Whatley JR, Carter PR, et al. Altered microvascular hemodynamics during the induction and perpetuation of chronic gut inflammation. Am J Physiol Gastrointest Liver Physiol. 2009;296:G750–754. doi: 10.1152/ajpgi.90702.2008. [DOI] [PMC free article] [PubMed] [Google Scholar]
- 3.Chidlow JH, Jr, Langston W, Greer JJ, et al. Differential angiogenic regulation of experimental colitis. Am J Pathol. 2006;169:2014–2030. doi: 10.2353/ajpath.2006.051021. [DOI] [PMC free article] [PubMed] [Google Scholar]
- 4.Rennick DM, Fort MM, Davidson NJ. Studies with IL-10−/− mice: an overview. J Leukoc Biol. 1997;61:389–396. doi: 10.1002/jlb.61.4.389. [DOI] [PubMed] [Google Scholar]
- 5.Yen D, Cheung J, Scheerens H, et al. IL-23 is essential for T cell-mediated colitis and promotes inflammation via IL-17 and IL-6. J Clin Invest. 2006;116:1310–1316. doi: 10.1172/JCI21404. [DOI] [PMC free article] [PubMed] [Google Scholar]
- 6.Ostanin DV, Bao J, Koboziev I, et al. T cell transfer model of chronic colitis: concepts, considerations, and tricks of the trade. Am J Physiol Gastrointest Liver Physiol. 2009;296:G135–146. doi: 10.1152/ajpgi.90462.2008. [DOI] [PMC free article] [PubMed] [Google Scholar]
- 7.Lee S, Carter PR, Watts MN, et al. Effects of the endothelin-converting enzyme inhibitor SM-19712 in a mouse model of dextran sodium sulfate-induced colitis. Inflamm Bowel Dis. 2009;15:1007–1013. doi: 10.1002/ibd.20877. [DOI] [PMC free article] [PubMed] [Google Scholar]
- 8.Pavlick KP, Ostanin DV, Furr KL, et al. Role of T-cell-associated lymphocyte function-associated antigen-1 in the pathogenesis of experimental colitis. Int Immunol. 2006;18:389–398. doi: 10.1093/intimm/dxh378. [DOI] [PubMed] [Google Scholar]
- 9.Ostanin DV, Pavlick KP, Bharwani S, et al. T cell-induced inflammation of the small and large intestine in immunodeficient mice. Am J Physiol Gastrointest Liver Physiol. 2006;290:G109–119. doi: 10.1152/ajpgi.00214.2005. [DOI] [PubMed] [Google Scholar]
- 10.Thornton M, Solomon MJ. Crohn's disease: in defense of a microvascular aetiology. Int J Colorectal Dis. 2002;17:287–297. doi: 10.1007/s00384-002-0408-5. [DOI] [PubMed] [Google Scholar]
- 11.Taylor CT, Colgan SP. Hypoxia and gastrointestinal disease. J Mol Med. 2007;85:1295–1300. doi: 10.1007/s00109-007-0277-z. [DOI] [PubMed] [Google Scholar]