

Abstract
Previously, we (McKerchar et al., 2009) showed that two-parameter hyperboloid models (Green and Myerson, 2004; Rachlin, 2006) provide significantly better fits to delay discounting data than simple, one-parameter hyperbolic and exponential models. Here, we extend this effort by comparing fits of the two-parameter hyperboloid models to data from a larger sample of participants (N = 171) who discounted probabilistic as well as delayed rewards. In particular, we examined the effects of amount on the exponents in the two hyperboloid models of delay and probability discounting in order to evaluate key theoretical predictions of the standard psychophysical scaling interpretation of these exponents. Both the Rachlin model and the Green and Myerson model provided very good fits to delay and probability discounting of both small and large amounts at both the group and individual levels (all R2s > .97 at the group level; all median R2s > .92 at the individual level). For delay discounting, the exponent in both models did not vary as a function of delayed amount, consistent with the psychophysical scaling interpretation. For probability discounting, however, the exponent in both models increased as the probabilistic amount increased—a finding inconsistent with the scaling interpretation.
Keywords: Delay discounting, Probability discounting, Hyperboloid, Model comparison, Scaling, Money, Humans
1. Introduction
Delay discounting refers to the decrease in the subjective value of a reward as the time until its receipt increases. Probability discounting refers to the decrease in the subjective value of a reward as the likelihood of its receipt decreases. In both cases, the value of a reward is assumed to be discounted with increasing delay or decreasing likelihood. Considerable research has examined the mathematical form of the discounting function (for a review, see Green and Myerson, 2004), and there is an emerging consensus that an exponential function (Samuelson, 1937) provides a relatively poor description of discounting data compared to a simple one-parameter hyperbola (Mazur, 1987). However, two-parameter hyperboloids often provide an even better fit, and the improvement in variance accounted for by such models is frequently significantly greater than would be expected based merely on the addition of a free parameter (Myerson and Green, 1995). Two such hyperboloid models have been proposed, and the present study examines the theoretical and empirical bases for these models.
The hyperboloid discounting model favored by Green and Myerson (2004; Myerson and Green, 1995) to describe the discounting of both delayed and probabilistic rewards is of the form:
| (1) |
where V is the subjective value of the reward, A is the amount of the reward, b is a parameter that reflects the rate of discounting (when s is constant), X represents the independent variable, and the exponent s is a nonlinear scaling parameter whose interpretation depends on whether the equation is used to describe delay or probability discounting. For delay discounting, X is the time until reward receipt and s reflects the nonlinear scaling of amount and time; for probability discounting, X is the odds against reward receipt (i.e., X = [1 - p]/p, where p is probability of receipt), and s reflects the nonlinear scaling of amount and the odds against receiving the reward. When s equals 1.0, Eq. (1) is a simple hyperbola (Mazur, 1987). When s is less than 1.0, as is often the case (see, e.g., Estle et al., 2006; Green and Myerson, 2004; McKerchar et al., 2009), subjective value decreases more steeply than predicted by a comparable simple hyperbola when X values are low, but then decreases less steeply than a simple hyperbola at larger values of X.
Rachlin (2006) also has proposed a hyperboloid model of delay and probability discounting. In contrast to Eq. (1), in which the entire denominator is raised to a power, only the independent variable (i.e., delay or odds against) is raised to a power in the Rachlin model:
| (2) |
Rachlin reported that at the group level, Eqs. (1) and (2) account for similarly high proportions of the variance in delay and probability discounting data.
Both Eqs. (1) and (2) explicitly incorporate Stevens's (1957) power law and are based on psychophysical scaling principles. Stevens showed that in a variety of sensory modalities the relation between the perceived and the objective magnitude of stimuli can be described by a power function whose exponent characterizes the degree to which the psychophysical scaling of objective magnitude departs from linearity. Such scaling may be seen clearly in Rachlin's (2006) equation, where s reflects the scaling of X (e.g., how perceived delay increases with objective delay). In Green and Myerson's (2004) equation, the interpretation of s is a little more complicated because both reward amount and the independent variable, X, are assumed to be nonlinearly scaled. According to Myerson and Green's (1995) derivation of Eq. (1), the exponent s actually represents the ratio of the exponents of two power functions – the exponent of the function that scales X divided by the exponent of the function that scales amount.
The hypothesized role of psychophysical scaling in both the Green and Myerson (2004) model and the Rachlin (2006) model has two important implications. First, the scaling interpretation predicts that the exponents in both models will be invariant of the magnitude being scaled. This is because scaling refers to the rule that describes the way that changes in some objective quantity affect the perceived quantity (Stevens, 1957), and although the perceived quantity will change with the objective quantity, the rule is assumed to remain constant. Therefore, if the rule for a particular variable (e.g., time) is described by a power function, then a scaling interpretation of the exponent in the psychophysical power function predicts that it will remain constant across changes in that variable. Thus, the value of s in Eq. (1) should remain constant because it is the ratio of two invariant exponents, and the value of s in Eq. (2) should remain constant because it represents a single invariant exponent. Although the rate parameter, b, in both models may be affected by the amount of the outcome, the exponent, s, should not be affected.
Second, a scaling interpretation places little constraint on the value of s in Eq. (1) but predicts that the value of s in Eq. (2) will not exceed 1.0. The value of s in Eq. (2) is constrained because the exponent of a scaling power function typically is less than 1.0. This is related to the law of diminishing returns: The size of the increase in the perceived amount of many variables, including money, time, and likelihood, decreases systematically with successive unit increases in objective amount. For example, the perceived difference between an anticipated delay of one month and a delay of two months is much greater than the difference between a delay of one year and a delay of 13 months. Such diminishing returns are mathematically described by a power function with an exponent less than 1.0. Thus, the exponent in Eq. (2), which is the exponent of the power function scaling the independent variable, should be less than 1.0. The exponent in Eq. (1) is less constrained because it describes the relative nonlinearity of two psychophysical scaling functions, and although the exponents of each function should be less than 1.0, their ratio could be less than or greater than 1.0.
The results of several studies support the scaling interpretation of the exponent in Eq. (1) as applied to delay discounting while raising problems for the scaling interpretation as applied to probability discounting. That is, while s remained relatively constant across increases in the amount of delayed reward, the value of s increased with increases in the amount of probabilistic reward (Estle et al., 2006; Myerson et al., 2003). At the individual level, the exponent of Eq. (1) almost never significantly exceeds 1.0 in either delay or probability discounting, but only one study (McKerchar et al., 2009) has addressed this issue with respect to Eq. (2), and that study only looked at delay discounting. The issues of the constancy and size of the exponent in Eq. (2) as applied to individuals' probability discounting have yet to be addressed.
In addition to analyzing group-level data from their experimental study of delay discounting, McKerchar et al. (2009) compared the proportions of variance accounted for by Eqs. (1) and (2) at the individual level. Consistent with Rachlin's (2006) findings, McKerchar et al. found that both hyperboloid models (i.e., Eqs. (1) and (2)) accounted for a similarly high proportion of the variance (R2s > .99) in delay discounting at the group level. Eqs. (1) and (2) also accounted for high proportions of the variance at the individual level (median R2s > .95). Furthermore, the scaling parameter (s) in both equations was significantly less than 1.0 at the group level as well as in the majority of individual cases, reflecting the important contribution of the exponent to the description of the discounting of delayed rewards.
The present study is the first to compare the Rachlin (2006) and Green and Myerson (2004) models of probability discounting at the individual level. Such a comparison is important because it is well known that patterns of individual behavior may not be reflected in group averages (see Estes, 1956; Lampl et al., 1992; Sidman, 1952). In addition, although McKerchar et al. (2009) examined the fits of Eqs. (1) and (2) to delay discounting data at both the group and individual levels, their analysis was limited to discounting of only one amount. In contrast, the present study extends the previous effort to two delayed and probabilistic amounts and thus allows for testing the hypothesized scaling interpretation of the exponents in both models.
We reanalyze the delay and probability discounting data from Myerson et al. (2003) in order to compare individual fits of Eq. (1) with fits of Eq. (2). In addition to evaluating how well these hyperboloid models describe the data, we focus on the issues of the value of the exponents and the way these exponents are affected by reward amount, and examine the implications for the psychophysical scaling interpretation of the exponents in the Green and Myerson (2004) and Rachlin (2006) models.
2. Methods
2.1. Participants
We reanalyzed the data from the larger of two samples studied by Myerson et al. (2003; Sample 2). The 171 participants were undergraduate students at Washington University in St. Louis, Missouri.
2.2. Procedure
All participants were tested individually on four separate discounting tasks: $200 delay discounting, $25,000 delay discounting, $200 probability discounting, and $25,000 probability discounting. The order of the four tasks was randomly determined for each participant. For the delay discounting tasks, participants made repeated choices between smaller hypothetical monetary amounts available immediately and larger ($200; $25,000) delayed amounts. For the probability discounting tasks, participants made repeated choices between smaller, certain amounts and larger ($200; $25,000) probabilistic amounts. Subjective value was determined for each individual at each delay and probability using an adjusting-amount staircase procedure.
The first choice at each delay and probability was between the delayed/probabilistic amount and an immediate/certain amount that was equal to half of the delayed/probabilistic amount (e.g., $200 in 1 month or $100 now). For each of the subsequent choices at that delay or probability, the amount of the immediate/certain reward was adjusted based on the participant's previous choice. If the participant chose the immediate/certain reward, then its amount was decreased on the following trial; if the participant chose the larger, delayed/probabilistic reward, then the amount of the immediate/certain reward on the next trial was increased. The size of the adjustment to the immediate/certain reward after the first choice was half of the initial amount of that reward. Subsequently, the size of the adjustment to the immediate/certain reward decreased with each successive choice and was always equal to half of the previous adjustment, rounded to the nearest dollar. This iterative procedure converged rapidly on the immediate/certain amount subjectively equivalent to the delayed/probabilistic amount (for full details, see Myerson et al., 2003).
The subjective value of each delayed amount was determined at each of seven delays (1 week, 1 month, 6 months, 1 year, 3 years, 5 years, and 10 years), and the subjective value of each probabilistic amount was determined at each of seven probabilities (.95, .90, .75, .50, .33, .10, and .05).
2.3 Data Analysis
The subjective values of the small and large delayed and probabilistic amounts were expressed as proportions of the corresponding objective amounts (i.e., $200 and $25,000). Eqs. (1) and (2) were fit to the group median data (i.e., the median relative subjective value at each delay or odds-against) and also to the data from each of the 171 participants using nonlinear least-squares regression in GraphPad Prism® 5.0, which provided parameter estimates and their standard errors, as well as the proportion of variance accounted (R2).
At both the group and individual levels, a t-ratio statistic was used to determine whether estimated values of the s parameter in Eqs. (1) and (2) deviated significantly from 1.0. For group-level analyses, we used the estimate of s and its standard error from the fit to the group median subjective values. The estimate of s was subtracted from 1.0, and the result was divided by the standard error of s. The resulting t ratio has (n - p) degrees of freedom, where n is the number of data points and p is the number of model parameters (Myerson and Green, 1995). The t-ratio for each individual's s parameter was calculated in a similar manner.
Wilcoxon matched-pairs signed-ranks tests were used to compare R2 values associated with the two hyperboloid models and also to determine whether changes in the amount of the delayed or probabilistic reward resulted in significant changes in the s parameter. These nonparametric tests were employed because the R2 values and the values of the s parameter were not normally distributed across individuals. It should be noted that statistical comparisons assessing the effects of amount on the discount rate parameter, b, are problematic with two-parameter models such as Eqs. (1) and (2) because estimates of b are not independent of estimates of the exponent, s (Myerson et al., 2001). Therefore, inferential statistics on the parameter estimates for Eqs. (1) and (2) were focused on the parameter of theoretical interest in the present study (i.e., the exponent).
3. Results
3.1. Discounting functions
Fig. 1 presents the group median subjective values of the delayed and probabilistic rewards, expressed as a proportion of the actual reward amounts (i.e., the median relative subjective values), for both the small ($200, left panels) and large ($25,000, right panels) reward amounts. The top panels show relative subjective value plotted as a function of the time until receipt of the delayed reward, and the bottom panels show relative subjective value plotted as a function of the odds against receipt of the probabilistic reward. The curves represent Eqs. (1) and (2) fit to the data, and as may be seen, are virtually indistinguishable to the eye. Indeed, both models provided excellent fits to the group median data from all four discounting tasks (all R2s > .97, see Table 1).
Fig. 1.
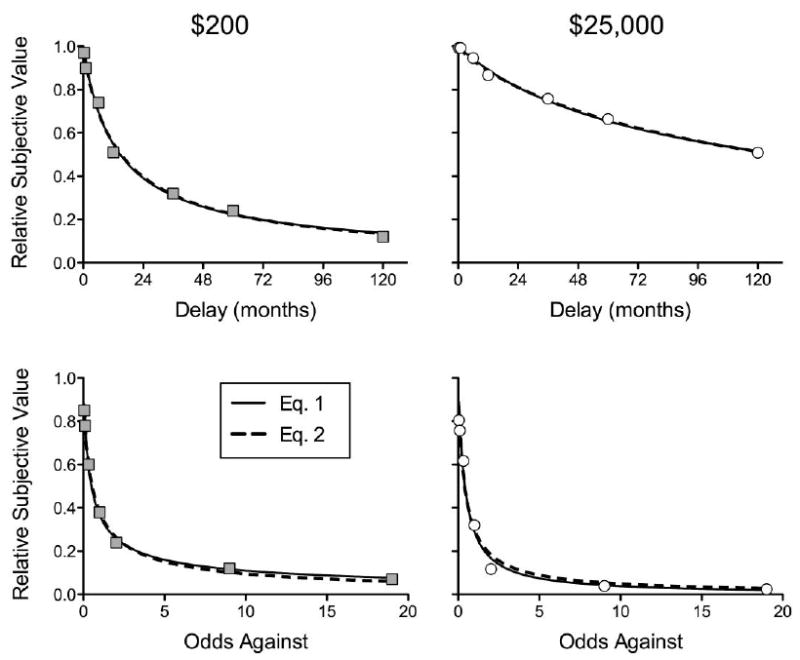
Group median subjective value expressed as a proportion of the small ($200, left column) and large ($25,000, right column) delayed (top row) and probabilistic (bottom row) outcomes. The curved lines represent fits of Eq. (1) (Green and Myerson, 2004; solid line) and Eq. (2) (Rachlin, 2006; dashed line).
Table 1.
Parameter estimates and fit statistics for Eq. 1 (Green and Myerson, 2004) and Eq. 2 (Rachlin, 2006) fit to the delay and probability discounting data at the small ($200) and large ($25,000) amounts.
| Group Median | Median of Individuals | ||||||||||||
|---|---|---|---|---|---|---|---|---|---|---|---|---|---|
| $200 | $25,000 | $200 | $25,000 | ||||||||||
| Task | Equation | R2 | b | s | R2 | b | s | R2 | b | s | R2 | b | s |
| Delay | Eq. 1 | .993 | 0.096 | 0.78 | .996 | 0.019 | 0.56 | .943 | 0.139 | 0.64 | .926 | 0.050 | 0.48 |
| Eq. 2 | .993 | 0.087 | 0.90 | .997 | 0.015 | 0.87 | .952 | 0.102 | 0.84 | .958 | 0.020 | 0.81 | |
| Probability | Eq. 1 | .997 | 4.919 | 0.56 | .977 | 2.338 | 1.02 | .951 | 4.918 | 0.59 | .955 | 2.740 | 0.88 |
| Eq. 2 | .998 | 1.624 | 0.77 | .979 | 2.303 | 0.93 | .958 | 1.635 | 0.78 | .964 | 2.365 | 0.90 | |
3.2. Analyses of individual delay discounting data
At the individual level, both Eq. (1) and Eq. (2) provided very good fits to the delay data (all median R2s > .92, see Table 1). Despite the small size of the differences in median R2s for the two equations, Wilcoxon matched-pairs signed-ranks tests revealed that Eq. (2) accounted for significantly more variance in individual discounting of both delayed reward amounts; both Zs > 2.94, ps < .005.
For Eq. (1), t-tests revealed that the s parameter was significantly less than 1.0 (i.e., t(5) > 2.57, p < .05) in 74 (43%) out of the 171 cases for the small delayed amount and 79 (46%) cases for the large amount; s was not significantly greater than 1.0 in any of the cases at either delayed amount. For Eq. (2), s was significantly less than 1.0 in 50 (29%) cases for the small delayed amount and 56 (33%) cases for the large amount. In contrast to the results for Eq. (1), s was significantly greater than 1.0 in 17 (10%) cases at the small amount and in 29 (17%) cases at the large amount for Eq. (2). Because the scaling interpretation of the s parameter in Eq. (2) predicts that s will not exceed 1.0, we conducted another Wilcoxon matched-pairs signed-ranks tests including only the R2s from those participants for whom s was not significantly greater than 1.0. This analysis revealed that the proportions of variance accounted for by Eqs. (1) and (2) did not differ significantly at either delayed reward amount (both Zs < 1.76).
3.3. Analyses of individual probability discounting data
At the individual level, both Eq. (1) and Eq. (2) provided very good fits to the probability data (all median R2s > .95, see Table 1). As with the delay discounting data, Wilcoxon matched-pairs signed-ranks tests revealed that Eq. (2) accounted for significantly more variance in individual discounting of both probabilistic reward amounts; both Zs > 3.96, ps < .001.
For Eq. (1), t-tests on the individual fits revealed that the s parameter was significantly less than 1.0 in 84 (49%) cases for the small probabilistic amount and 59 (35%) cases for the large amount; s was not significantly greater than 1.0 in any of the cases at either probabilistic amount. For Eq. (2), s was significantly less than 1.0 in 67 (39%) cases for the small amount and 54 (32%) cases for the large amount; s was significantly greater than 1.0 in 2 (1%) cases at the small amount and in 28 (16%) cases at the large amount. When R2 values for these participants were excluded, Eq. (2) still accounted for significantly more variance than Eq. (1) at both probabilistic amounts according to a Wilcoxon matched-pairs signed-ranks test; both Zs > 3.65, ps < .001.
3.4. Effects of amount on the exponents of Eqs. (1) and (2)
A final series of analyses focused on the question of whether the effects of amount on the s parameter were consistent with the assumptions underlying Eqs. (1) and (2). When the delay discounting data from all 171 participants were analyzed, the estimated values of s did not differ significantly between the small and large delayed amounts either for Eq. (1) or for Eq. (2); both Zs < 0.68. The same result was obtained when those participants with values of s significantly greater than 1.0 for Eq. (2) were excluded from the analyses; both Zs < 0.81. With respect to probability discounting, however, the values of s for the small and large amounts differed significantly for Eq. (1) and also for Eq. (2), regardless of whether data from participants whose s values were significantly greater than 1.0 were included or not; all Zs > 2.73, ps < .01. Out of all 171 participants, the estimated value of s was greater for the larger probabilistic amount than for the smaller probabilistic amount in 118 (69%) of the cases using Eq. (1) and in 109 (64%) of the cases using Eq. (2), both outcomes significantly greater than chance according to a binomial test.
4. Discussion
The present study compared two prominent models of discounting, the Green and Myerson (2004) two-parameter hyperboloid, Eq. (1), and the Rachlin (2006) two-parameter hyperboloid, Eq. (2), both of which we previously found to provide significantly better fits to delay discounting data than simple hyperbolic and exponential models (McKerchar et al., 2009). The present effort is the first to compare the two hyperboloid models at both the individual and group levels using data from both delay and probability discounting tasks. Rachlin pointed out that, given the excellent fits provided by the two models, one cannot choose between them based on the proportions of variance accounted for. Accordingly, the present study focused on the effect of amount of reward on the exponents in Eqs. (1) and (2) and, in particular, on the implications for the standard psychophysical scaling interpretation of these exponents. Discounting of both small and large reward amounts was assessed in order to determine whether, for either or both models, empirically obtained estimates of the exponent parameters are consistent with the psychophysical scaling interpretation. More specifically, we tested two key predictions of the scaling interpretation: First, that in both equations, estimates of the exponent should remain unchanged across the two amounts, and second, that estimates of the exponent parameter in Eq. (2) should not exceed 1.0.
At the group level, both hyperboloid models provided excellent and virtually indistinguishable fits to the data (see Fig. 1), and the estimates of the exponent parameters for both models were less than 1.0. At the individual level, Eq. (2) provided a significantly better fit than Eq. (1) to both the delay and probability discounting data, although the difference in R2 was typically only around 1%. Contrary to the scaling interpretation of the exponent in Eq. (2), however, estimates of the exponent parameter in Eq. (2) were significantly higher than 1.0 in many cases. With respect to delay discounting, when those subjects for whom s was significantly greater than 1.0 were excluded, there no longer was a significant difference in R2 between the models with respect to delay discounting. With respect to probability discounting, however, the difference in R2 remained even after subjects for whom s was significantly greater than 1.0 were excluded.
Prior research has shown that the exponent parameter (s) in Eq. (1) is unaffected by the amount of the delayed reward, consistent with the psychophysical scaling interpretation (Green and Myerson, 2004). The present results demonstrate that the exponent parameter in Eq. (2) also is unaffected by the amount of delayed reward. With respect to probability discounting, however, the exponents in Eqs. (1) and (2) both increased as a function of the amount of the probabilistic reward, contrary to the psychophysical scaling interpretation. An alternative interpretation would be to assume, following Kahneman and Tversky (1979), that these exponents govern decision weights and thus need not correspond to the subjective scaling of reward probabilities.
The lack of symmetry between the delay and probability domains replicates prior findings with Eq. (1) (Estle et al., 2006; Myerson et al., 2003). The present results are the first to show that a similar asymmetry is observed with Eq. (2). This finding is important because it suggests that, rather than being peculiar to one specific model, the observed asymmetry reflects a fundamental property of probability discounting. Moreover, this finding provides further evidence that delay and probability discounting involve different underlying processes (Green and Myerson, 2010). This is because if both forms of discounting involved the same processes, then experimental manipulations (e.g., variations in reward amount) would have the same effect on both delay and probability discounting.
The present results show that Eqs. (1) and (2) both provide excellent descriptive models of delay and probability discounting at the individual as well as the group levels. Our findings also support the theoretical basis of Eq. (1) with respect to the discounting of delayed outcomes. That is, the results were consistent with the prediction that follows from the psychophysical scaling interpretation of the exponent in Eq. (1), namely that the exponent would not change with the amount of the delayed reward. The results for Eq. (2), although consistent with the prediction that the exponent would not change with amount of delayed reward, were contrary to the other prediction of the psychophysical scaling interpretation of the exponent in this model, namely that the exponent not exceed 1.0.
With respect to the discounting of probabilistic outcomes, again there were a number of individuals for whom the exponent in Eq. (2) was significantly greater than 1.0. For both equations, the value of the exponent increased significantly when the amount of probabilistic reward was increased. This finding, which is contrary to the psychophysical scaling interpretation of the exponent, strongly suggests the need to reevaluate the theoretical interpretation of both the Green and Myerson (2004) and Rachlin (2006) models as applied to the discounting of probabilistic outcomes.
Acknowledgments
The research was supported by National Institutes of Health Grant MH055308 to Leonard Green and Joel Myerson.
Footnotes
Publisher's Disclaimer: This is a PDF file of an unedited manuscript that has been accepted for publication. As a service to our customers we are providing this early version of the manuscript. The manuscript will undergo copyediting, typesetting, and review of the resulting proof before it is published in its final citable form. Please note that during the production process errors may be discovered which could affect the content, and all legal disclaimers that apply to the journal pertain.
References
- Estes WK. The problem of inference from curves based on group data. Psychol Bull. 1956;53:134–140. doi: 10.1037/h0045156. [DOI] [PubMed] [Google Scholar]
- Estle SJ, Green L, Myerson J, Holt DD. Differential effects of amount on temporal and probability discounting of gains and losses. Mem Cognit. 2006;34:914–928. doi: 10.3758/bf03193437. [DOI] [PubMed] [Google Scholar]
- Green L, Myerson J. A discounting framework for choice with delayed and probabilistic rewards. Psychol Bull. 2004;130:769–792. doi: 10.1037/0033-2909.130.5.769. [DOI] [PMC free article] [PubMed] [Google Scholar]
- Green L, Myerson J. Experimental and correlational analyses of delay and probability discounting. In: Madden GJ, Bickel WK, editors. Impulsivity: The Behavioral and Neurological Science of Discounting. American Psychological Association; Washington, DC: 2010. pp. 67–92. [Google Scholar]
- Kahneman D, Tversky A. Prospect theory: An analysis of decision under risk. Econometrica. 1979;47:263–291. [Google Scholar]
- Lampl M, Veldhuis JD, Johnson ML. Saltation and stasis: a model of human growth. Science. 1992;258:801–803. doi: 10.1126/science.1439787. [DOI] [PubMed] [Google Scholar]
- Mazur JE. An adjusting procedure for studying delayed reinforcement. In: Commons ML, Mazur JE, Nevin JA, Rachlin H, editors. Quantitative Analyses of Behavior: The Effect of Delay and of Intervening Events on Reinforcement Value. Vol. 5. Erlbaum; Hillsdale, NJ: 1987. pp. 55–73. [Google Scholar]
- McKerchar TL, Green L, Myerson J, Pickford TS, Hill JC, Stout SC. A comparison of four models of delay discounting in humans. Behav Process. 2009;81:256–259. doi: 10.1016/j.beproc.2008.12.017. [DOI] [PMC free article] [PubMed] [Google Scholar]
- Myerson J, Green L. Discounting of delayed rewards: models of individual choice. J Exp Anal Behav. 1995;64:263–276. doi: 10.1901/jeab.1995.64-263. [DOI] [PMC free article] [PubMed] [Google Scholar]
- Myerson J, Green L, Warusawitharana M. Area under the curve as a measure of discounting. J Exp Anal Behav. 2001;76:235–243. doi: 10.1901/jeab.2001.76-235. [DOI] [PMC free article] [PubMed] [Google Scholar]
- Myerson J, Green L, Hanson JS, Holt DD, Estle SJ. Discounting delayed and probabilistic rewards: processes and traits. J Econ Psychol. 2003;24:619–635. [Google Scholar]
- Rachlin H. Notes on discounting. J Exp Anal Behav. 2006;85:425–435. doi: 10.1901/jeab.2006.85-05. [DOI] [PMC free article] [PubMed] [Google Scholar]
- Samuelson PA. A note on measurement of utility. Rev Econ Stud. 1937;4:155–161. [Google Scholar]
- Sidman M. A note on functional relations obtained from group data. Psychol Bull. 1952;49:263–269. doi: 10.1037/h0063643. [DOI] [PubMed] [Google Scholar]
- Stevens SS. On the psychophysical law. Psychol Rev. 1957;64:153–181. doi: 10.1037/h0046162. [DOI] [PubMed] [Google Scholar]