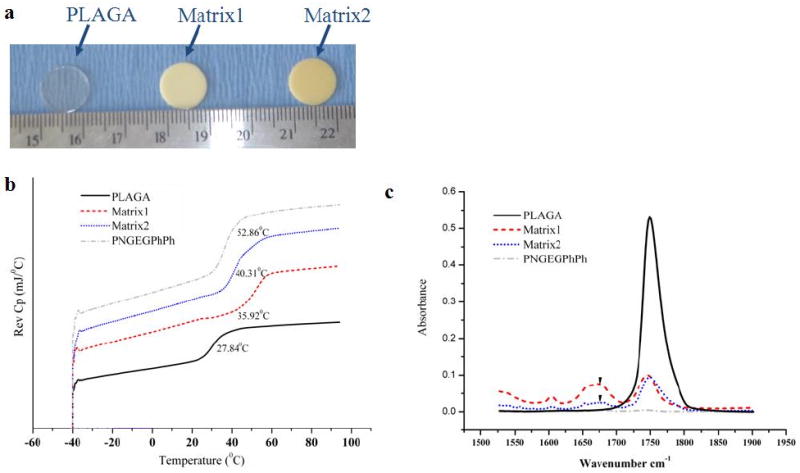
Figure 1.

Miscibility of blend matrices. (a) Optical micrographs of blend matrices; (b) DSC thermograms of the parent polymers and blends where the blends show a single Tg intermediate between those of the parent polymers; (c) FTIR spectra presenting carbonyl absorption region for blends and parent polymers. The C=O stretching vibrations of PNGEG/PhPh and PLAGA occur at ∼1743 and ∼1749 cm-1, respectively. For both blends, a second band develops at ∼1677 cm-1 indicating hydrogen bonded carbonyl groups.
