

Abstract
The inherent flexibility of rod-like tropomyosin coiled-coils is a significant factor that constrains tropomyosin’s complex positional dynamics on actin filaments. Flexibility of elongated straight molecules typically is assessed by persistence length, a measure of lengthwise thermal bending fluctuations. However, if a molecule’s equilibrium conformation is curved, this formulation yields an “apparent” persistence length (~100 nm for tropomyosin), measuring deviations from idealized straight conformations which then overestimate actual dynamic flexibility. To obtain the “dynamic” persistence length, a true measurement of flexural behavior, the average curvature of the molecule must be taken into account. Different methods used in our studies for measuring the dynamic persistence length directly from Molecular Dynamics (MD) simulations of tropomyosin are described here in detail. The dynamic persistence length found, 460 ± 40 nm, is ~12-times longer than tropomyosin and 5-times the apparent persistence length, showing that tropomyosin is considerably stiffer than previously thought. The longitudinal twisting behavior of tropomyosin during MD shows that the amplitude of end-to-end twisting fluctuation is ~30° when tropomyosin adopts its near-average conformation. The measured bending and twisting flexibilities are used to evaluate different models of tropomyosin motion on F-actin.
Keywords: actin, coiled-coils, Molecular Dynamics, persistence length, thin filaments, tropomyosin
Introduction
Tropomyosin is a prototypical coiled-coil structure, displaying a double α-helical motif that is common to many proteins. The tropomyosin coiled-coil wraps as a super-helix around the actin filament and in conjunction with troponin regulates the Ca2+-dependent activation and relaxation of muscle contraction. This regulation occurs by tropomyosin shifting its azimuthal position relative to the central axis of F-actin, exposing or blocking myosin binding sites on actin, thereby controlling myosin interaction and consequently contractility. Two simple structural models are consistent with this repositioning of tropomyosin: (1) a rolling of tropomyosin over the actin surface, which implies that tropomyosin is a rather flexible molecule, (2) a sliding of tropomyosin, which implies that tropomyosin is more rigid-body-like. These models are not mutually exclusive, and a combination of the two processes could be in play. In order to distinguish between these possibilities and better understand the underlying structural mechanism of muscle regulation, it therefore is crucial to characterize the degree of tropomyosin flexibility. Over the years, a number of studies examined tropomyosin flexibility by attempting to assess the molecule’s persistence length.
Persistence length (ξ), used to describe the “stiffness” or “flexibility” of a rod, is dependent on temperature, and is defined as the length along a rod over which its direction (i.e., its longitudinal tangent) becomes nearly uncorrelated (i.e. when the bending angle reaches 68.4° on average). Hence, a stiff rod has a larger persistence length than does a floppy one. The notion that tropomyosin might be highly flexible with a short persistence length has been suggested by numerous studies. Early studies that examined tropomyosin flexibility were based on observations of x-ray diffraction patterns of tropomyosin crystals (Phillips et al., 1980) while others studied fluorescence depolarization and birefringence decay of isolated tropomyosin molecules (Wahl et al., 1978, Swenson and Stellwagen, 1983). Hvidt et al. (1983) investigated coiled-coil flexibility for a number of double α-helical polypeptides (including myosin, paramyosin, light meromyosin, the S2 fragment of myosin and tropomyosin) by viscoelastic and capillary viscosity procedures. They concluded that these molecules have a persistence length (ξ) of about 130 ± 40 nm.
Later studies by Phillips and Chacko (1996) derived persistence length values from diffuse x-ray scattering of tropomyosin crystals equalling 150 nm at 4°C and 65 nm at 30°C. They concluded that at physiological temperatures, the cooperativity of Ca2+-induced tropomyosin shifts along thin filaments can at most be one to two tropomyosin lengths. More recently, Wolgemuth and Sun (2006) computed the persistence length of coiled coils, such as tropomyosin, using a simple coarse-grained elastic model and obtained a value of roughly 150 nm, in good agreement with experimental estimates. In summary, estimates of persistence length for striated muscle tropomyosin and other coiled-coil α-helices that were based on either theoretical or experimental studies have ranged between only about 2 to 4 times the length of the molecule, making it seem that tropomyosin is quite flexible. However, all of the above studies were based on the assumption that the tropomyosin coiled-coil is straight in its equilibrium conformation.
Crystal structures solved by the Maeda group suggest that residues 137 and 218 on tropomyosin might represent kinking-points that render the molecule floppy (Nitanai et al., 2007). Sumida et al. (2008) support the notion that tropomyosin may be particularly flexible at residue 137. In related work, mutational analysis coupled with calorimetry led to the additional suggestion that tropomyosin flexibility is necessary for the molecule to adapt to the helical contour of F-actin and to be able to bind to thin filaments (Singh and Hitchcock-DeGregori, 2003, 2006; Sumida et al., 2008). An alternative proposal is that tropomyosin has a pre-curved shape which allows it wrap super-helically around actin filaments without much flexible bending (Holmes and Lehman, 2008, Li et al., 2010). This pre-shaping would allow tropomyosin to be more rigid, which in turn would explain the high degree of cooperativity in the tropomyosin on-off steric switching mechanism, involving a high Hill coefficient (>4) for muscle activation associated with tropomyosin motion on actin (Shiner and Solaro, 1984; Tobacman, 1996).
Molecular Dynamics simulations are ideally suited to directly measure the flexibility of a molecule. Here, we use previously determined Molecular Dynamics conformers of tropomyosin (Li et al., 2010) to determine the average curvature and the dynamic flexibility of tropomyosin in depth. We find that the apparent persistence length (i.e. the value based on the assumption that the average MD shape of the molecule is straight) is in excellent agreement with the published persistence lengths mentioned above. Moreover, the same apparent persistence length was obtained when electron microscopy images of tropomyosin were analyzed (Sousa et al., 2009; Li et al., 2010), again validating the MD work. However, the MD simulations clearly show that the tropomyosin molecule is not straight on average. In fact, the mean curvature of tropomyosin is almost precisely the one of the Holmes-Lorenz model, which matches the contours of the F-actin helix (Lorenz et al., 1995). Consequently the standard assumption made in experimental determinations of persistence length, namely that the structure is straight on average breaks down in the case of tropomyosin. Hence, to meaningfully evaluate the flexibility of tropomyosin, it becomes necessary to distinguish between the apparent persistence length (based on the assumption of straightness) and the dynamic persistence length (which reflects the true deviations from the average curved structure). The simulations discussed below show that the dynamic persistence length of tropomyosin is ~430 nm, four times longer than values previously thought to describe its flexibility.
Material and Methods
Bending Flexibility
Consider a uniform straight rod of length s bent into an arc of a circle of radius R and angle θ (Fig. 1A, s = R·θ). The energy Earc required to perform this deformation is given by (Boal, 2002):
| (1) |
where kf is the flexural force constant of the rod. kf = Yη, where Y is Young’s modulus (which is a measure of the bulk elasticity of the material from which the rod is fabricated), and η is the moment of inertia of the cross section (which depends upon the geometry of the rod). c is the curvature, where c = 1/R. Mathematically, the curvature c is defined as or in vector form where is the unit norm vector and () is the unit vector tangent to the curve. The persistence length (ξ), which reflects the rigidity of the rod, is related to the flexural force constant by:
| (2) |
The persistence length can be visualized as the arc length at which the rod bends on average by an angle θ of 68.4° away from a straight rod standard due to thermal fluctuations (see equation 3 below, when 〈cos(θ)〉 = e−1 ⇒ θ ≈ 68.4°). From equation 2, it is obvious that persistence length deceases with increasing temperature.
Figure 1.
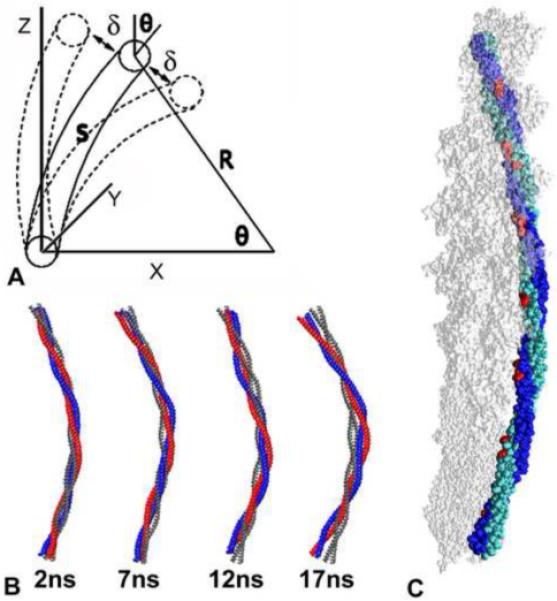
Tropomyosin bending. (A) Bending of an homogeneous curved rod. θ is the overall curvature, used to measure the flexibility of straight rods. δ is the angular deflection from the averaged curved shape, needed to measure the flexibility of curved rods. R is the curvature radius and s is the arc length, where R = s/θ. (B) The average structure of tropomyosin over 1 ns intervals taken at different times along the MD simulation. For comparison, the Lorenz-Holmes model is shown in grey. (C) The structure of tropomyosin averaged over the entire MD (chains A and B of the coiled coil in blue and cyan), shown docked onto F-actin. Amino acid residues facing actin are in red.
We calculated the persistence length of tropomyosin by three of the many different methods available. One is the tangent correlation method (Boal, 2002), expressed in the equation:
| (3) |
where the average <…>t is over time (t). We also applied the end-to-end distance () method (Boal, 2002):
where Lc is the contour length of the molecule. In addition, we used the radius of gyration (Rg) method (Bettini et al., 1980; Flory, 1969):
| (4) |
Persistence length calculations on DNA have shown that the value of the persistence length is determined not only by the rigidity of the molecule, but also by its intrinsic curvature ci (Trifonov et al., 1988, Schellmann and Harvey, 1995; Bednar et al., 1995). When a molecule is not straight on average, then each of the three methods mentioned above yield an “apparent” persistence length (ξa), which does not correctly reflect the flexural rigidity kf of the molecule. In contrast, a dynamic persistence length (ξd) can be defined, which correctly reflects the flexural rigidity expressed in equation 2. ξd is related to the intrinsic persistence length (ξi, obtained from equation 3 using the relationship θ = s · ci) and the experimentally determined apparent persistence length ξa by (Trifonov et al., 1988):
| (5) |
EM images
We adapted an approach previously used by Isambert et al. (1995) to obtain persistence length values of tropomyosin molecules preserved in negative stain (Li et al., 2010). Isambert et al. examined F-actin filaments undergoing thermal fluctuation at the light microscopy level, while we characterized single cardiac αα-tropomyosin captured at the EM level. The tangent correlation method (see above) was applied to our images to calculate the apparent persistence length using the relationship (Frontali et al., 1979):
| (6) |
where ξa is the apparent persistence length and s is the length taken along the tropomyosin EM images. The above formula is the same as equation 3, except that a factor 2 in the exponent corrects for the two-dimensionality, as EM images represent 2D projections of 3D objects. The average is made over all possible segments of length s along the molecule. Measurement errors inherent in such a determination result from the low contrast of the images and low definition of the molecular particle boundaries. Thus this method of analysis may somewhat underestimate the actual apparent persistence length.
Molecular Dynamics Simulations
Molecular Dynamics simulations of αα-tropomyosin were run for 30 ns at 300° K with Langevin dynamics and an implicit solvent model using the program CHARMM c33b2 (Brooks et al., 2009), as described previously (Li et al., 2010). As pointed out by Ruscio and Onufriev (2006), the implicit solvent scheme has the advantage that more conformational space can be explored per unit time (equivalent to a simulation as much as 100 times longer than a simulation done in explicit solvent). The Generalized Born solvent model (GBSW, implemented in CHARMM) was validated by comparing MD of a tropomyosin segment (residues 1 to 35 from PDB:1IC2) in the presence of explicit water molecules and also in the implicit solvent (Li et al., 2010). Flexibility, hydrogen bond strength and the general behavior of tropomyosin are essentially the same in both solvent types. For starting the MD simulations, a high-resolution atomic model of full length tropomyosin was built by combining the Lorenz-Holmes model structure of tropomyosin (Lorenz et al., 1995) with high-resolution crystal structure segments of tropomyosin (PDBs: 2D3E (Nitranai et al., 2007; 1IC2 (Brown et al., 2001); 2B9C (Brown et al., 2005)) (see Li et al., 2010 for details). After allowing the curvature fluctuations to stabilize for 8 ns (Li et al., 2010), the subsequent 22 ns served as a production run, during which the behavior of tropomyosin was analyzed. The radius, center line and other coiled-coil parameters of the tropomyosin MD conformers were obtained from a combination of algorithms described by Strelkov and Burkhard (2002) and Chothia et al. (1981). The curvature was computed using the method described in Crenshaw et al. (2000). The protocol used for determination of the average MD structure of tropomyosin has been described in Li et al. (2010).
Twisting stiffness
The objective here was to determine the fluctuations in twisting between the N- and C-terminal ends of tropomyosin during MD, and then relate the twisting to the bending amplitude and direction. The longitudinal end-to-end twisting angle at MD time t, ψ(t), was determined from the dihedral angle formed by four points (one point each for the A and B chains, both at the N- and C-terminal ends) of a given conformer: Points 1 and 2 are the center of residues 3 through 7 taken respectively on chains A and B at the N-terminus. Similarly, points 3 and 4 correspond to the centers of residues 278 through 281 at the C-terminus. The bending of each conformer was characterized by determining its C-terminal [x,y] coordinates while aligning the 15 N-terminal residues onto the z-axis (as illustrated in Fig. 1A). In Fig. 2A, the average of ψ(t) over time and [10Å×10Å] [x,y]-bins is shown in a colormaped 2D-histogram. The standard deviation of ψ(t) in each [x,y]-bin is shown in similar format in Fig. 2B. The maps in both Fig. 2A and 2B are smoothed by bi-cubic spline interpolation.
Figure 2.
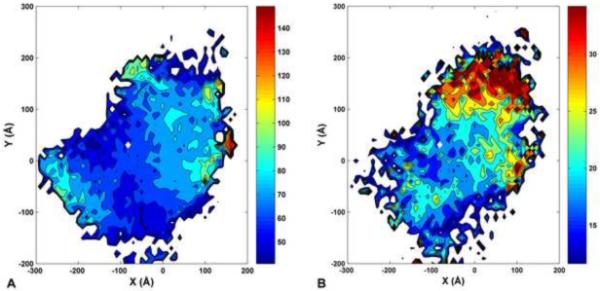
Fluctuations of tropomyosin twisting during MD. (A, B) The [x,y] coordinates correspond to the position of the tropomyosin C-terminus, after superposing the 15 N-terminal residues to a common reference oriented along the z-axis (i.e., the N-terminus projects to the [0,0] position). The position of the C-terminus in the average tropomyosin structure is [−82Å, 31Å] (indicated by a white diamond). A) The end-to-end twisting angle ψ observed in each [x, y] position (averaged over the MD, see Methods section) is shown as color map (dark blue: ψ=40°; dark red: ψ=150°). B) Same as panel A, but showing the standard deviation of ψ during the MD (dark blue: stdev(ψ)=10°; dark red: stdev(ψ)=35°).
Results
Average Structure of Tropomyosin
Molecular movies showing the motions of isolated tropomyosin during the MD simulation can be seen in the Supplementary Data section of Li et al. (2010) and under http://iwr.uni-heidelberg.de/groups/biocomp/fischer. After MD equilibration, the average end-to-end bending angle (θ, defined schematically in Fig. 1A) is 45 ± 3°, which corresponds to an apparent persistence length (ξa) equal to 121 ± 15 nm (found by approximating <cos θ> by cos <θ> in equation 3 and applying the end-to-end curvilinear length of tropomyosin, s = 418 Å). The more rigorous tangent correlation analysis of MD conformers yields an ξa of 101 nm (Li et al., 2010). This is in excellent agreement with the apparent persistence length obtained from the tangent correlation analysis of the EM images (Fig. 3), which gives an ξa of 102 nm. Since in silico and experimental values agree so well, these results indicate that tropomyosin behaved properly during the MD simulation.
Figure 3.
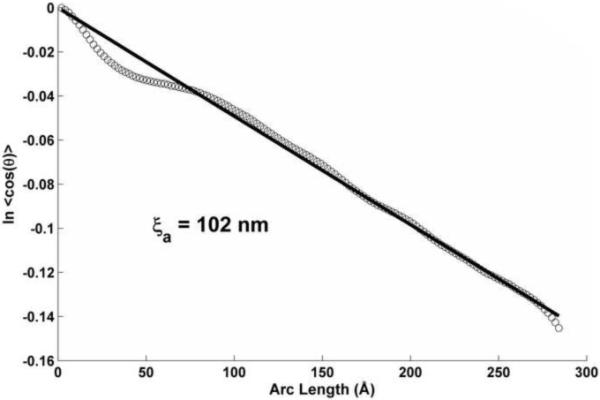
Tangent correlation plot of the angle θ(s) (see Fig. 1A) along EM images of negatively stained tropomyosin molecules, used to get the apparent persistence length ξa from the inverse slope of the linear regression (see Equation 6).
The average MD structures averaged over short 1 ns intervals are shown in Fig. 1B for periods starting at 2, 7, 12, and 17 ns after the simulation run was equilibrated. The four average structures are all smoothly curved, without any signs of sharp bends or kinks. Each is similar in shape to the Lorenz-Holmes model (Poole et al., 2006), which, in turn, fits ideally as a super-coil wrapped around actin. When the structure is averaged over the whole MD simulation (as described in Li et al., 2010), it is curved, as shown in Fig. 1C, with an end-to-end bending angle (θ) of 37° and very similar to the corresponding angle of 35° in the ideal Lorenz-Holmes model. The residues facing towards the concave side of the curved average structure are on the same side of tropomyosin as they are in the Lorenz-Holmes model (i.e. the side that would contact F-actin when tropomyosin is wrapped around it, see Fig. 1C).
Bending Flexibility
Since tropomyosin is not straight on average, we introduce a modified version of the tangent correlation method to obtain the dynamic persistence length ξd of a curved rod by adapting equation 3 as follows:
| (7) |
The angle, δ, now replacing θ in Equation 3, is the deviation from the average curved rod (see Fig. 1A), whereas θ is the deviation angle from the straight rod. The protocol to obtain δ for a given conformer segment (whose length s goes from residue i to i+n) is as follows: (1) Align (by rms fitting) the (i, i+15) residues of the conformer with the (i, i+15) residues of the average structure; (2) Take δ as the angle between the vector tangent to the central axis of the coiled-coil over residues (i+n–15, i+n) of the conformer (i.e., aligning ) and the corresponding vector of the average structure (i.e., ). The dynamic persistence length can then be calculated from the overall slope (1/ξd) of the data pairs [s, ln<cos{δ(s,t)}>t], where the average is over all conformers sampled during the MD (indicated by <…>t) and over all possible segments with a given curvilinear length s(n) within each conformer. The slope is obtained by linear regression through the origin, as shown in Fig. 4A. The resulting dynamic persistence length ξd equals 413 nm. Note that the plot in Fig. 4A deviates significantly from linearity, which reflects the fact that the flexibility of tropomyosin is not constant along the molecule (as will be shown below).
Figure 4.
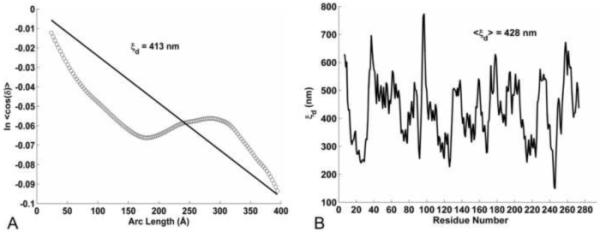
Dynamic persistence length of tropomyosin. (A) Tangent correlation plot of the angle δ(s,t) (see Fig. 1A) along conformers of the MD simulation, used to get the overall dynamic persistence length ξd from the inverse slope of the linear regression (see Equation 7). (B) The local dynamic persistence length, based on the fluctuations of δ(t) over a 9 residues window centered on each residue.
A simple, yet good, approximation of the dynamic persistence length can be obtained by examining only the last data pair of the above tangent correlation plot; i.e., aligning the 15 C-terminal residues of tropomyosin and taking the deviation angle (δ) of the vector tangent to the 15 N-terminal residues. The average deviation during the MD is a <δ> of 22° and a <cos(δ)> of 0.9059 (note: <cosδ> is not exactly the same as cos<δ>), which yields a ξd of 423 nm with equation 7. This value for the dynamic persistence length is nearly identical to the 413 nm determined from the rigorous tangent correlation analysis of δ(s).
Given the non-linearity of the tangent correlation plot of δ (Fig. 4A), the variation in the local flexibility along tropomyosin was examined by determining the dynamic persistence length over a 9 residue window around each residue i : By analogy to the end-to-end δ described above, residues [i-4, i] are first aligned between a MD conformer and the average structure, then the angle δi is taken between the vector along residues [i, i+4] of the MD conformer and the corresponding vector of the average structure. Approximating <cos(δi)> by cos<δi> in equation 7 and taking s equal to 14.4 Å (the length over 9 residues) yields the local dynamic persistence length ξd (i), which is shown plotted for each residue in Fig. 4B. This confirms that the flexibility indeed varies very much along tropomyosin. The average over all residues gives <ξd>i equal to 428 nm, consistent with the other methods to determine the overall ξd of tropomyosin.
Twisting flexibility
To be consistent with the highly cooperative regulatory motion of tropomyosin on F-actin, a “rolling –tropomyosin” model would require that the longitudinal torsional stiffness (not to be confused with the longitudinal bending stiffness discussed above) of tropomyosin be quite high, i.e., have small fluctuations in the longitudinal end-to-end twisting angle ψ (defined in the Materials and Methods section). Therefore, we have examined ψ (Fig. 2A) and its standard deviation (Fig. 2B) during the MD simulation. Figure 2B shows that the standard deviation of ψ is on the order of 15° to 20° for conformations near the average structure at [x,y] = [−82 Å, 31 Å] (i.e., for conformations that can fit well onto F-actin). The large twisting fluctuations of more than 30° observed around y = 150 Å are probably due to weakening of the coiled-coil structure when it over bends far away from its preferred conformation.
Discussion
The apparent persistence length of a rod cannot be considered a meaningful estimation of flexibility if the rod’s average shape is curved instead of straight. For example, consider the extreme case of an infinitely rigid, yet permanently curved rod: because of the permanent curvature, all measurements (theoretical and experimental) will yield a finite apparent persistence length, erroneously suggesting that the rod is flexible. In order to properly measure the real flexibility of a curved rod, its bending fluctuations need to be measured as angular deviations relative to its average (i.e., curved) structure. This yields the dynamic persistence length, a true measure of bending stiffness. For tropomyosin, the dynamic persistence length is ~5 times longer than its apparent persistence length, demonstrating that tropomyosin is much more rigid than suggested by all previous studies, where the average curvature was not taken into account. With a dynamic persistence length of ~460 nm (i.e. about 12 times its length), tropomyosin can be considered semi-rigid. But because the average conformation of tropomyosin is bent by ~37° end-to-end, it is pre-shaped to fit snugly onto the actin filament without needing much flexible deformation. In fact, the relatively high stiffness of wild-type tropomyosin that has been revealed in our studies does not prevent its binding to F-actin, but actually promotes such association (Holmes and Lehman, 2009; Li et al., 2010).
While tropomyosin is somewhat rigid, it is not so stiff that this semi-rigidity by itself would disallow the 30° azimuthal rotation around F-actin from the “blocked” position (B-state, found in the presence of Ca2+-free troponin) to the fully “open” position (M-state, when actin becomes fully accessible for myosin binding), even though this motion would involve an end-to-end bending away from its average structure of δ = 16° (as tropomyosin attempts to remain super-helically wrapped around F-actin). According to equation 1, this would amount to a deformation energy (with δ expressed in radians, ξd equal to 460 nm and s equal to 41.8 nm), i.e. less than the thermal energy, kBT. Thus, based only on the bending flexibility alone and ignoring the effect of interactions with actin and troponin, tropomyosin would be bendable enough to allow a rolling mechanism.
However, the azimuthal motion of tropomyosin around the central axis of F-actin during shifts between the “closed” position (C-state, close to the equilibrium state in the absence of troponin) and the “open” position is about 10° (McKillop and Geeves, 1993; Vibert et al., 1997; Geeves and Lehrer, 2002; Poole et al., 2006). If this motion were to be fully achieved by a “rolling” of tropomyosin over the surface of F-actin, then this would require a rotation of tropomyosin by 35.6° around its own axis (taking radius of 32 Å for the actin surface and 9 Å for the radius of tropomyosin). To allow for the high degree of filament-associated cooperativity, tropomyosin’s end-to-end twisting should fluctuate by significantly less than these 35.6°. We find here that this is not the case, since the fluctuation amplitudes of the twisting angle ψ (i.e. twice the standard deviation of ψ) is at least 30° (Fig. 2B). Therefore, given the low twisting stiffness of tropomyosin, a pure rolling model is not compatible with tropomyosin’s cooperative behavior. In contrast, a sliding model for the transition between open and closed states is compatible with both the mechanical properties of isolated tropomyosin and the cooperative nature of its transition on the actin filament.
A combination of biochemical and structural evidence suggests that tropomyosin oscillates azimuthally back and forth by about 10° degrees between closed and open states on troponin-free F-actin (McKillop and Geeves, 1993; Vibert et al., 1997; Geeves and Lehrer, 2002; Poole et al., 2006), while the blocked state remains unoccupied (McKillop and Geeves, 1993; Geeves and Lehrer, 2002). The larger (30°) azimuthal movement from open to the blocked state is not observed in the absence of troponin. It follows that thermally driven tropomyosin oscillations cannot reach the blocked-state position. This transition only takes place when tropomyosin is moved away from its equilibrium sites by Ca2+-free troponin. Whether movement to the blocking position occurs by sliding or rolling in regulated filaments cannot be concluded solely based on the mechanical properties of isolated tropomyosin presented here, because the motion presumably is dominated by interactions with F-actin, with troponin and with myosin, as well as by the end-end interaction with the adjacent tropomyosins, all of which impose their own set of structural constraints. The development of an atomic model of tropomyosin movement on F-actin is in progress.
We have shown here that the flexibility of tropomyosin varies significantly along the length of the molecule (see the variations of the local persistence length in Fig. 4B), as would be expected since tropomyosin is not an homogenous rod. The overall persistence length, as generally used for measuring flexibility, assumes an homogeneous molecule. However, the tangent correlation plot of [s, ln<cos{δ(s,t)}>t] yields a straight line only when the flexibility is constant along the length does. Tropomyosin’s flexibility is not constant, therefore the shape of its tangent correlation plot is not linear for an assessment of δ (Fig. 4A). This is in contrast to the mostly linear shape that is obtained for the tangent correlation plot of [s, ln<cos{θ(s,t)}>t] for an evaluation of θ (see supplemental data in Li et al., 2010). A plausible explanation for this linearity relates to the fact that θ(s,t) depends on both the flexibility and the average curvature (i.e., the average deviation from the straight shape), whereas δ(s,t) depends only on the flexibility (by the way it is constructed). Because tropomyosin’s average curvature (37° end-to-end) is nearly twice larger than its flexible deviations (the end-to-end <δ> is only 22°, Li et al., 2010), the values of θ(s,t) are dominated by the average curvature, which in turn is mostly constant along the molecule. Therefore, the tangent correlation plot with θ(s,t) is essentially the plot that one would obtain for the average conformer, and it has a mostly straight shape because the curvature along that average conformer is mostly constant.
Acknowledgements
This work was supported by grants from the National Institutes of Health to W.L. (HL86655 and HL36153). Figure 1 is adapted from Li et al. (2010), with permission.
Footnotes
Publisher's Disclaimer: This is a PDF file of an unedited manuscript that has been accepted for publication. As a service to our customers we are providing this early version of the manuscript. The manuscript will undergo copyediting, typesetting, and review of the resulting proof before it is published in its final citable form. Please note that during the production process errors may be discovered which could affect the content, and all legal disclaimers that apply to the journal pertain.
References
- Bednar J, Furrer P, Katritch V, Stasiak AZ, Dubochet J, Stasiak A. Determination of DNA persistence length by cryo-electron microscopy. Separation of the static and dynamic contributions to the apparent persistence length of DNA. J. Mol. Biol. 1995;254:579–594. doi: 10.1006/jmbi.1995.0640. [DOI] [PubMed] [Google Scholar]
- Bettini A, Pozzan MR, Valdevit E, Frontali C. Microscopic persistence length of native DNA: its relation to average molecular dimensions. Biopolymers. 1980;19:1689–1694. [Google Scholar]
- Boal DH. Mechanics of the Cell. Cambridge University Press; Cambridge, UK: 2002. [Google Scholar]
- Brooks BR, Brooks CL, 3rd, Mackerell AD, Jr., Nilsson L, Petrella RJ, Roux B, Won Y, Archontis G, Bartels C, Boresch S, et al. CHARMM: The biomolecular simulation program. J. Comput. Chem. 2009;30:1545–1614. doi: 10.1002/jcc.21287. [DOI] [PMC free article] [PubMed] [Google Scholar]
- Brown JH, Kim K, Jun G, Greenfield NJ, Domingues R, Volkmann N, Hitchcock-DeGregori SE, Cohen C. Deciphering the design of the tropomyosin molecule. Proc. Natl. Acad. Sci. USA. 2001;98:8496–8501. doi: 10.1073/pnas.131219198. [DOI] [PMC free article] [PubMed] [Google Scholar]
- Brown JH, Zhou Z, Reshetnikova L, Robinson H, Yammani RD, Tobacman LS, Cohen C. Structure of tropomyosin’s mid-region: bending and binding sites for actin. Proc. Natl. Acad. Sci. USA. 2005;102:18878–18883. doi: 10.1073/pnas.0509269102. [DOI] [PMC free article] [PubMed] [Google Scholar]
- Chothia C, Levitt M, Richardson D. Helix to helix packing in proteins. J. Mol. Biol. 1981;145:215–250. doi: 10.1016/0022-2836(81)90341-7. [DOI] [PubMed] [Google Scholar]
- Crenshaw HC, Ciampaglio CN, McHenry M. Analysis of the three-dimensional trajectorys of organisms: estimates for the velocity, curvature and torsion from positional information. J. Exp. Biol. 2000;203:961–982. doi: 10.1242/jeb.203.6.961. [DOI] [PubMed] [Google Scholar]
- Flory PJ. Statistical Mechanics of Chain Molecules. Interscience; New York: 1969. [Google Scholar]
- Frontali C, Dore E, Ferrrauto A, Gratton E, Bettini A, Pozzan MR, Valdevit E. An absolute method for the determination of the persistence length of native DNA from electron micrographs. Biopolymers. 1979;18:1353–1373. doi: 10.1002/bip.1979.360180604. [DOI] [PubMed] [Google Scholar]
- Geeves MA, Lehrer SS. Modeling thin filament cooperativity. Biophys. J. 2002;82:1677–1681. doi: 10.1016/S0006-3495(02)75518-5. [DOI] [PMC free article] [PubMed] [Google Scholar]
- Holmes KC, Lehman W. Gestalt-binding of tropomyosin to actin filaments. J. Muscle Res. Cell Motil. 2008;29:213–219. doi: 10.1007/s10974-008-9157-6. [DOI] [PubMed] [Google Scholar]
- Hvidt S, Ferry JD, Roelke DL, Greaser ML. Flexibility of light meromyosin and other coiled-coil α-helical proteins. Macromolecules. 1983;16:740–745. [Google Scholar]
- Isambert H, Venier P, Maggs AC, Fattoum A, Kassab R, Pantaloni D, Carlier M. Flexibility of actin filaments derived from thermal fluctuations. J. Biol. Chem. 1995;270:11437–11444. doi: 10.1074/jbc.270.19.11437. [DOI] [PubMed] [Google Scholar]
- Li X, Holmes KC, Lehman W, Jung H, Fischer S. The shape and flexibility of tropomyosin coiled-coils: implications for actin filament assembly and regulation. J. Mol. Biol. 2010;395:327–339. doi: 10.1016/j.jmb.2009.10.060. [DOI] [PubMed] [Google Scholar]
- Lorenz M, Poole KJV, Popp D, Rosenbaum G, Holmes KC. An atomic model of the unregulated thin filament obtained by X-ray fiber diffraction on oriented actin-tropomyosin gels. J. Mol. Biol. 1995;246:108–119. doi: 10.1006/jmbi.1994.0070. [DOI] [PubMed] [Google Scholar]
- McKillop D, Geeves M. Regulation of the interaction between actin and myosin subfragment 1: evidence for three states of the thin filament. Biophys. J. 1993;65:693–701. doi: 10.1016/S0006-3495(93)81110-X. [DOI] [PMC free article] [PubMed] [Google Scholar]
- Nitanai Y, Minakata S, Maeda K, Oda N, Maeda Y. Crystal structures of tropomyosin: flexible coiled-coil. In: Ebashi S, Ohtsuki I, editors. Regulatory Mechanisms of Striated Muscle Contraction. Springer; Japan: 2007. pp. 137–151. [DOI] [PubMed] [Google Scholar]
- Phillips GN, Fillers JP, Cohen C. Motions of tropomyosin: crystal as metaphor. Biophys. J. 1980;32:485. doi: 10.1016/S0006-3495(80)84985-X. [DOI] [PMC free article] [PubMed] [Google Scholar]
- Phillips GN, Chacko S. Mechanical properties of tropomyosin and implications for muscle regulation. Biopolymers. 1996;38:89–95. doi: 10.1002/(SICI)1097-0282(199601)38:1%3C89::AID-BIP7%3E3.0.CO;2-S. [DOI] [PubMed] [Google Scholar]
- Poole KJ, Lorenz M, Evans G, Rosenbaum G, Pirani A, Craig R, Tobacman LS, Lehman W, Holmes KC. A comparison of muscle thin filament models obtained from electron microscopy reconstructions and low-angle X-ray fibre diagrams from non-overlap muscle. J. Struct. Biol. 2006;155:273–284. doi: 10.1016/j.jsb.2006.02.020. [DOI] [PubMed] [Google Scholar]
- Ruscio JZ, Onufriev A. A Computational Study of Nucleosomal DNA Flexibility. Biophys. J. 2006;91:4121–4132. doi: 10.1529/biophysj.106.082099. [DOI] [PMC free article] [PubMed] [Google Scholar]
- Schellmann JA, Harvey SC. Static Contributions to the persistence length of DNA and dynamic contributions to DNA curvature. Biophys. Chem. 1995;55:95–114. doi: 10.1016/0301-4622(94)00144-9. [DOI] [PubMed] [Google Scholar]
- Shiner J, Solaro R. The Hill coefficient for the Ca2+-activation of striated muscle contraction. Biophys. J. 1984;46:541–543. doi: 10.1016/S0006-3495(84)84051-5. [DOI] [PMC free article] [PubMed] [Google Scholar]
- Singh A, Hitchcock-DeGregori SE. Local destabilization of the tropomyosin coiled coil gives the molecular flexibility required for actin binding. Biochemistry. 2003;42:14114–14121. doi: 10.1021/bi0348462. [DOI] [PubMed] [Google Scholar]
- Singh A, Hitchcock-DeGregori SE. Dual requirement for flexibility and specificity for binding of the coilel-coil tropomyosin to Its target, actin. Structure. 2006;14:43–50. doi: 10.1016/j.str.2005.09.016. [DOI] [PubMed] [Google Scholar]
- Sousa D, Li X, Singh A, Jung H, Tobacman LS, Craig R, Hitchcock-DeGregori S, Lehman W. Tropomyosin flexibility evaluated by electron microscopy image analysis. Biophys. J. 2009;96:231a. [Google Scholar]
- Strelkov SV, Burkhard P. Analysis of α-helical coiled coils with the program TWISTER reveals a structure mechanism for stutter compensation. J. Struct. Biol. 2002;137:54–64. doi: 10.1006/jsbi.2002.4454. [DOI] [PubMed] [Google Scholar]
- Sumida JP, Wu E, Lehrer SS. Conserved ASP 137 imparts flexibility to tropomyosin and affects function. J. Biol. Chem. 2008;283:6728–6734. doi: 10.1074/jbc.M707485200. [DOI] [PubMed] [Google Scholar]
- Swenson CA, Stellwagen NC. Flexibility of smooth and skeletal tropomyosins. Biopolymers. 1989;28:955–963. doi: 10.1002/bip.360280504. [DOI] [PubMed] [Google Scholar]
- Tobacman LS. Thin filament-mediated regulation of cardiac contraction. Annu. Rev. Physiol. 1996;58:447–481. doi: 10.1146/annurev.ph.58.030196.002311. [DOI] [PubMed] [Google Scholar]
- Trifonov EN, Tan RKZ, Harvey SC. Static persistence length of DNA. In: Olson WK, Sarma MH, Sarma RH, Sundaralinjam MS, editors. Structure and Expression. Adenine Press; Albany, N.Y.: 1988. pp. 243–254. [Google Scholar]
- Vibert P, Craig R, Lehman W. Steric-model for activation of muscle thin filaments. J. Mol. Biol. 1997;266:8–14. doi: 10.1006/jmbi.1996.0800. [DOI] [PubMed] [Google Scholar]
- Wahl P, Tawada K, Auchet JC. Study of tropomyosin labelled with a fluorescent probe by pulse fluorimetry in polarized light. Interaction of that protein with troponin and actin. Eur. J. Biochem. 1978;88:421–424. doi: 10.1111/j.1432-1033.1978.tb12464.x. [DOI] [PubMed] [Google Scholar]
- Wolgemuth CW, Sun SX. Elasticity of α-Helical Coiled Coils. Phys. Rev. Lett. 2006;97:248101. doi: 10.1103/PhysRevLett.97.248101. [DOI] [PubMed] [Google Scholar]