

Abstract
In cryocrystallography, rapid sample cooling is generally deemed essential to prevent solvent crystallization and associated sample damage. We show that by carefully and completely removing all external solvent, many protein crystals can be successfully cooled to T=100 K at only 0.1 K/s without additional penetrating cryoprotectants. Slow cooling provides an alternative when flash cooling fails, and enables diffraction studies of protein structure and function at all temperatures between T=300 K and T=100 K.
Keywords: cryocrystallography, cryoprotectant, flash cooling, hyperquenching, protein crystallography, vitrification, variable temperature, temperature controlled crystallography, kinetic crystallography
Introduction
Since the introduction of cryocrystallographic methods more than twenty years ago (Zeitler, 1982; Hope, 1988; 1990), flash cooling followed by data collection at T=100 K have become standard practice in protein structure determination (Rodgers, 1994; Chayen et al., 1996; Garman & Schneider, 1997, Garman, 1999; Pflugrath, 2004). Cooling crystals to liquid-nitrogen temperatures simplifies storage and transport, immobilizes the crystal during data collection and reduces radiation sensitivity (Garman et al., 2006; Kmetko et al., 2006).
However, the solvent within a crystal and the external solvent that clings to its surface can crystallize on cooling. Solvent crystallization produces sharp rings in the diffraction pattern, disorders the protein lattice and reduces the quality of the structural information that can be obtained (Juers & Matthews, 2004; Lovelace et al., 2006). Penetrating cryoprotectants (e.g., glycerol) are added to protein crystallization solutions and soaked into crystals after growth to reduce the rate of ice formation, and non-penetrating cryoprotectants (e.g., oils) are used to remove external solvent. These steps complicate the search for optimal growth conditions and increase the time required to prepare each sample for measurement. Even when penetrating cryoprotectants successfully prevent ice formation, there may be temperature-dependent structural changes in the protein and in the crystal lattice due to changes in protein-solvent and protein-protein interactions and in solvent structure, and these may disorder the crystal on cooling.
Fast or slow cooling?
Most if not all properties of the protein (conformation, crystal packing), solvent (activity, pH, density, phase) and solutes (solubilities) vary with temperature. One can thus imagine two favorable limits for cooling protein crystals to T=100 K. The first is to cool extremely rapidly, so that ice crystal nucleation cannot occur, solvent and solutes have no time to redistribute, and all but the fastest local protein conformation and lattice changes are frozen out. Thermal gradients within the sample and differential contraction of the protein lattice and solvent may still produce some cracking, mosaicity broadening and low-temperature disorder, but local order most relevant to B factors and resolution may be preserved.
A second favorable limit is to cool so slowly that the crystal and its constituents remain in quasi-equilibrium throughout (Drew et al. 1982). In the absence of structural phase transitions, the internal solvent and solute concentrations, protein conformation and crystal packing may then evolve smoothly so as to minimize stresses (Kriminski et al., 2003) and to produce a well-ordered low-temperature state.
Fast Cooling
Conventional cooling methods used in cryocrystallography give cooling rates of 102-103 K/s, (Teng & Moffat, 1998; Walker et al., 1998) and cooling times to 100 K are typically several tenths of a second, in neither of the favorable limits described above. The cooling rate of a sample depends upon the sample’s size, heat capacity and thermal conductivity, on the cooling medium’s thermal properties (heat capacity, viscosity, thermal conductivity), and on the speed with which the sample is moved through the cooling medium (Ryan, 1992; Kriminski, 2003).
We previously showed that, for samples of the size typically used in protein crystallography, cooling rates during plunge cooling in liquid nitrogen are limited not by cooling in the liquid, but by cooling in the cold gas layer that forms above it (Berejnov et al., 2006; Warkentin et al., 2006; Warkentin & Thorne, 2007). By blowing this cold gas layer away, cooling rates can be dramatically increased. Measured rates of 20,000 K/s for 80 μm samples suggest that rates in excess of 100,000 K/s for 20 μm and smaller samples should be possible. These much faster cooling rates dramatically reduce cryoprotectant concentrations required to prevent ice formation in aqueous solutions. To vitrify a drop of a water-glycerol solution using conventional plunge cooling requires a glycerol concentration of at least 30% (Berejnov et al., 2006), but this drops to 6% (Warkentin et al., 2006) when the cold gas layer is removed.
This “hyperquenching” method provides more reliable and consistent diffraction outcomes than conventional plunge cooling. Experiments on a dozen proteins (including current structural genomics targets) mounted without added penetrating cryoprotectants have yielded T=100 K mosaicities comparable to or slightly better than the best previously reported values. This suggests that ice-free cooling of cryoprotectant-free crystals of most proteins (perhaps excluding those with the largest solvent channels) should be possible. This should allow crystallization screen compositions to be simplified and post-growth manipulations to be reduced.
Slow cooling
The slow cooling limit might also give favorable diffraction outcomes, but how can one avoid the lattice-destroying effects of ice crystallization? As shown in Figure 1, the time for ice to nucleate has a minimum near T=200 K of 10−5 s. Ice-free cooling of pure water thus requires cooling rates of >106 K/s.
Figure 1.

The time required for significant (5 %) ice formation in pure water as a function of temperature. Data at ~240 K are from Wood & Walton (1970), at ~200 K from Bartell & Huang (1994) and Huang & Bartell (1995), at ~140 K are from Hage et al., (1994), and the line from 110 to 140 K was estimated from Dowell & Rinfret (1960). The red dotted lines are guides to the eye illustrating an approximately exponential dependence of the transformation time on temperature both above and below the minimum at ~200 K. The minimum ice formation time cannot be significantly less than ~10 μs because pure water can be vitrified with cooling rates in the range 105 - 106 K/s (Mayer, 1985; Johari et al., 1987) Note that hexagonal ice forms at high temperatures (~240 K), whereas cubic ice forms at lower temperatures.
However, experiments on hydrated protein powders (Sartor et al., 1995) show that proteins themselves are extremely effective cryoprotectants, especially at the very large concentrations found within protein crystals. Like cryoprotectants, they interact with water molecules in a way that inhibits their ability to form crystalline nuclei.
Motivated by this fact and by our success in fast-cooling so many proteins without penetrating cryoprotectants, we attempted to slowly cool crystals from room temperature to T=100 K (Warkentin & Thorne, 2009). Crystals are dipped in a highly viscous oil to prevent dehydration, and then cooled from T=295 K to T=100 K in 33 minutes by programming the gas stream controller. The resulting cooling rate – 0.1 K/s – is 103-104 times smaller than in conventional flash cooling and ~106 times smaller than in the hyperquenching.
Figure 2 shows diffraction patterns at selected temperatures obtained from a cubic urease crystal (4.9 × 10⁶ Å3 cell volume, 48% solvent content) during cooling at 0.1 K/s. The diffraction pattern shows no evidence of crystalline ice formation, and diffraction from the protein lattice does not change appreciably. Tetragonal thaumatin, cubic insulin, orthorhombic trypsin and tetragonal lysozyme crystals have also been successfully cooled at 0.1 K/s to T=100 K. Table 1 shows that in most cases mosaicity increases on cooling, but for insulin the mosaicity remained at its room temperature value of 0.06° all the way down to T=100 K.
Figure 2.
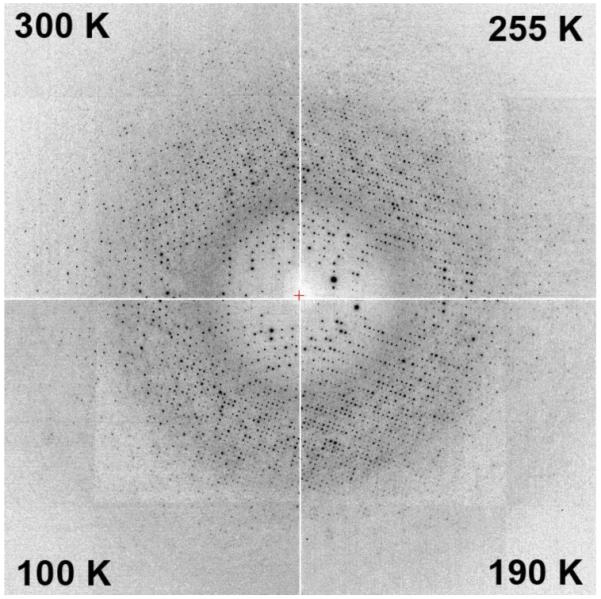
Diffraction patterns from a urease crystal at four temperatures acquired during slow cooling at 0.1 K/s. No ice rings and no qualitative changes in the diffraction quality are observed.
Table 1.
Lowest mosaicity at T=100 K (out of 3-5 trials) and the cryoprotective components of the mother liquor for five proteins that have been successfully slow cooled. No cryoprotectants beyond those present in the mother liquor were added prior to slow cooling
| Protein | Lowest T=100 K Mosaicity |
Cryoprotective components of mother liquor |
|---|---|---|
| Insulin | 0.06° | 12.5 % (w/v) ethylene glycol |
| Urease | 0.35° | 1.6 M Li2SO4 |
| Thaumatin | 0.11° | 1.5 M Na-K-Tartrate |
| Lysozyme | 0.4° | 1.2 M NaCl |
| Trypsin | 0.9° | 25 % (w/v) PEG 8000 0.2 M ammonium sulfate |
For all five proteins, ice-ring-free diffraction was obtained without adding any penetrating cryoprotectants beyond the very modest amounts contained in the mother liquor (and indicated in Table 1.) In all cases, crystalline protein appears to be much more effective than hydrated powders in suppressing ice nucleation at any temperature. This suggests that nucleation is additionally suppressed by confining the solvent to the regular nm-size channels of the crystal, consistent with studies in porous glass (Rault et al., 2003).
The key to successful slow cooling of protein crystals is to carefully and completely remove all of the protein-poor solvent from the surface of the crystal. This solvent rapidly crystallizes on cooling, and may then seed ice growth within the protein crystal itself. External solvent can be removed by transferring the crystal between successive drops of oil. Solvent present at the crystal surface produces a large refractive index mismatch and strong reflections. When all solvent has been removed, the crystal becomes nearly invisible due to the close index match between oil and crystal.
Compared with flash cooling, slow cooling is more time consuming, requires somewhat more sample manipulation, and may be ill-suited to crystals with very large solvent channels or that undergo structural transitions at lower temperatures. Flash cooling thus seems likely to remain the method of choice for routine structure determinations.
However, as we found for insulin, slow cooling may in some cases give significantly better low-temperature mosaicity and diffraction. Edayathumangalam & Luger (2005) flash cooled nucleosome crystals in liquid propane held at different temperatures and then collected diffraction data at T=100 K. They found that a higher propane temperature (T=153 K) - which gave a slower cooling rate – yielded the best T=100 K diffraction.
Temperature-controlled crystallography
Studies of protein structure at different temperatures can in principle provide information about the protein’s energy landscape, protein-solvent interactions and other properties relevant to a mechanistic understanding of protein function.
In one classic study, Rasmussen et al. (1992) found that ribonuclease A deactivates below T~220 K, and that this can not be explained by a change in the average atomic positions. The slope of the B-factor versus temperature shows a transition near 220 K, indicating a crossover from anharmonic to harmonic motions (Tilton et al., 1992). Anharmonic (liquid-like) motions were thus concluded to be essential for enzymatic activity.
As illustrated in Figure 1, in the temperature range between 180 K and 220 K where these motions “turn on”, water is most unstable to formation of cubic ice (on warming) or hexagonal ice (on cooling). As a result, most temperature-dependent diffraction studies including those of Rasmussen et al. (1992), Tilton et al. (1992) (who use the same data) and Chong et al., (2001) report no data in this temperature range. What data has been obtained in this temperature range has required the use of extremely high cryoprotectant concentrations (e.g., 50% methanol) or of molecules like crambin (Teeter et al., 2001) and a B-DNA dodecamer (Drew et al., 1982) that have very small unit cells and very low solvent contents.
Our experiments on slow cooling show that temperature-controlled studies of protein structure and dynamics in the crystalline state are possible at any temperature between 300 K and 100 K, and without the disruptive presence of crystalline ice or large cryoprotectant concentrations. Since protein crystals can be slowly cooled through any temperature between 300 K and 100 K, they can be cooled to any temperature, and held there for data collection. This may prove particularly useful in kinetic crystallography, (Bourgeois & Royant, 2005), where temperature is used to control the progress of reactions within a crystal (Colletier et al., 2008).
As a first application of this approach, we have examined the temperature dependence of radiation damage. Crystals of lysozyme, trypsin and thaumatin were examined at temperatures of 300, 270, 240, 220, 210, 200, 190, 170, 150 and 100 K. At each temperature, approximately 100 frames of data, sufficient in most cases for a full structure determination, were collected in roughly 30 minutes. The crystals were either cooled as-grown, or after soaking to 40 % glycerol. In no case and at no temperature were ice diffraction rings or significant cooling-related degradation of overall diffraction observed. The results of this study are currently in preparation for publication elsewhere.
Conclusions
Two simple methods have been developed for ultra-fast and ultra-slow cooling of protein crystals. They provide cooling rates varying over six orders of magnitude, and control over an important variable affecting T=100 K crystal order. These methods may prove most useful in solving the structure of “high value targets” when conventional cooling methods have failed.
We also have demonstrated that at least some protein crystals can cooled to and held at any temperature between T=300 K and T=100 K (including near T=200 K) long enough for a complete structural examination. The key is to carefully and completely remove all external solvent, and to rely on the excellent cryoprotective properties of the protein lattice itself to inhibit ice nucleation within it. The ability to cool at any rate and collect data at any temperature promises to provide detailed new insight into protein structure and dynamics.
Summary.
By removing all external solvent, many protein crystals can be cooled at only 0.1 K/s from T=300 K to T=100 K, providing an alternative to flash cooling and allowing structural data sets to be collected at any temperature.
Acknowledgements
We wish to thank P. Andrew Karplus for suggesting the study of urease, and MacCHESS staff for their assistance. This work was supported by the NIH under award GM065981-05A1.
References
- Bartell LS, Huang JF. Journal of Physical Chemistry. 1994;98:7455–7457. [Google Scholar]
- Berejnov V, Husseini NS, Alsaied OA, Thorne RE. Journal of Applied Crystallography. 2006;39:244–251. doi: 10.1107/S0021889806037484. [DOI] [PMC free article] [PubMed] [Google Scholar]
- Bourgeois D, Royant A. Current Opinion in Structural Biology. 2005;15:538–547. doi: 10.1016/j.sbi.2005.08.002. [DOI] [PubMed] [Google Scholar]
- Chayen NE, Boggon TJ, Cassetta A, Deacon A, Gleichmann T, Habash J, Harrop SJ, Helliwell JR, Nieh YP, Peterson MR, Raftery J, Snell EH, Hadener A, Niemann AC, Siddons DP, Stojanoff V, Thompson AW, Ursby T, Wulff M. Quarterly Reviews of Biophysics. 1996;29:227–278. doi: 10.1017/s0033583500005837. [DOI] [PubMed] [Google Scholar]
- Chong SH, Joti Y, Kidera A, Go N, Ostermann A, Gassmann A, Parak F. European Biophysics Journal with Biophysics Letters. 2001;30:319–329. doi: 10.1007/s002490100152. [DOI] [PubMed] [Google Scholar]
- Colletier JP, Bourgeois D, Sanson B, Fournier D, Sussman JL, Silman I, Weik M. Proceedings of the National Academy of Sciences of the United States of America. 2008;105:11742–11747. doi: 10.1073/pnas.0804828105. [DOI] [PMC free article] [PubMed] [Google Scholar]
- Dowell LG, Rinfret AP. Nature. 1960;188:1144–1148. [Google Scholar]
- Drew HR, Samson S, Dickerson RE. Proceedings of the National Academy of Sciences of the United States of America-Biological Sciences. 1982;79:4040–4044. doi: 10.1073/pnas.79.13.4040. [DOI] [PMC free article] [PubMed] [Google Scholar]
- Edayathumangalam RS, Luger K. Acta Crystallographica Section D-Biological Crystallography. 2005;61:891–898. doi: 10.1107/S0907444905008541. [DOI] [PubMed] [Google Scholar]
- Garman E. Acta Crystallographica Section D-Biological Crystallography. 1999;55:1641–1653. doi: 10.1107/s0907444999008653. [DOI] [PubMed] [Google Scholar]
- Garman EF, Schneider TR. Journal of Applied Crystallography. 1997;30:211–237. [Google Scholar]
- Garman EF, Owen RL. Acta Crystallogr. D. Biol. Crystallogr. 2006;62:32–47. doi: 10.1107/S0907444905034207. [DOI] [PubMed] [Google Scholar]
- Hage W, Hallbrucker A, Mayer E, Johari GP. Journal of Chemical Physics. 1994;100:2743–2747. [Google Scholar]
- Hope H. Acta Crystallographica Section B-Structural Science. 1988;44:22–26. doi: 10.1107/s0108768187008632. [DOI] [PubMed] [Google Scholar]
- Hope H. Annual Review of Biophysics and Biophysical Chemistry. 1990;19:107–126. doi: 10.1146/annurev.bb.19.060190.000543. [DOI] [PubMed] [Google Scholar]
- Huang JF, Bartell LS. Journal of Physical Chemistry. 1995;99:3924–3931. [Google Scholar]
- Johari GP, Hallbrucker A, Mayer E. Nature. 1987;330:552–553. [Google Scholar]
- Juers DH, Matthews BW. Quarterly Reviews of Biophysics. 2004;37:105–119. doi: 10.1017/s0033583504004007. [DOI] [PubMed] [Google Scholar]
- Kmetko J, Husseini NS, Naides M, Kalinin Y, Thorne RE. Acta Crystallographica Section D-Biological Crystallography. 2006;62:1030–1038. doi: 10.1107/S0907444906023869. [DOI] [PubMed] [Google Scholar]
- Kriminski S, Kazmierczak M, Thorne RE. Acta Crystallographica Section D-Biological Crystallography. 2003;59:697–708. doi: 10.1107/s0907444903002713. [DOI] [PubMed] [Google Scholar]
- Lovelace JJ, Murphy CR, Pahl R, Keith B, Borgstahl GEO. Journal of Applied Crystallography. 2006;39:425–432. [Google Scholar]
- Mayer E. Journal of Applied Physics. 1985;58:663–667. [Google Scholar]
- Pflugrath JW. Methods. 2004;34:415–423. doi: 10.1016/j.ymeth.2004.03.032. [DOI] [PubMed] [Google Scholar]
- Rasmussen BF, Stock AM, Ringe D, Petsko GA. Nature. 1992;357:423–424. doi: 10.1038/357423a0. [DOI] [PubMed] [Google Scholar]
- Rault J, Neffati R, Judeinstein P. European Physical Journal B. 2003;36:627–637. [Google Scholar]
- Rodgers DW. Structure. 1994;2:1135–1140. doi: 10.1016/s0969-2126(94)00116-2. [DOI] [PubMed] [Google Scholar]
- Ryan KP. Scanning Microscopy. 1992;6:715–743. [Google Scholar]
- Sartor G, Hallbrucker A, Mayer E. Biophysical Journal. 1995;69:2679–2694. doi: 10.1016/S0006-3495(95)80139-6. [DOI] [PMC free article] [PubMed] [Google Scholar]
- Teeter MM, Yamano A, Stec B, Mohanty U. Proceedings of the National Academy of Sciences of the United States of America. 2001;98:11242–11247. doi: 10.1073/pnas.201404398. [DOI] [PMC free article] [PubMed] [Google Scholar]
- Teng TY, Moffat K. Journal of Applied Crystallography. 1998;31:252–257. [Google Scholar]
- Tilton RF, Dewan JC, Petsko GA. Biochemistry. 1992;31:2469–2481. doi: 10.1021/bi00124a006. [DOI] [PubMed] [Google Scholar]
- Walker LJ, Moreno PO, Hope H. Journal of Applied Crystallography. 1998;31:954–956. [Google Scholar]
- Warkentin M, Berejnov V, Husseini NS, Thorne RE. Journal of Applied Crystallography. 2006;39:805–811. doi: 10.1107/S0021889806037484. [DOI] [PMC free article] [PubMed] [Google Scholar]
- Warkentin M, Stanislavskaia V, Hammes K, Thorne RE. Journal of Applied Crystallography. 2008;41:791–797. doi: 10.1107/S0021889808018451. [DOI] [PMC free article] [PubMed] [Google Scholar]
- Wood GR, Walton AG. Journal of Applied Physics. 1970;41:3027–3037. [Google Scholar]
- Zeitler E. Journal of Ultrastructure Research. 1982;81:397. [Google Scholar]