

Abstract
Although the etiology of schizophrenia remains unknown, diverse neuropathological evidence suggests a disorder of synaptic connectivity. Apoptosis is a form of cell death that helps determine synaptic circuitry during neurodevelopment and altered regulation of apoptosis has been implicated in schizophrenia. Prostate apoptosis response-4 (Par-4) is an upstream regulator of apoptosis preferentially localized to synapses. Brain Par-4 levels are upregulated in response to pro-apoptotic stimuli in rodent models and in patients with classic neurodegenerative diseases. Recently, Par-4 was also found to form a complex with the dopamine D2 receptor (D2DR) in competition with the calcium-binding protein calmodulin, implicating Par-4 as an important regulatory component in normal dopamine signaling. Interestingly, mutant mice with disrupted Par-4/D2DR interaction demonstrated depressive-like behaviors, suggesting a potential role for Par-4 in both depression and schizophrenia. In this study, Par-4, D2DR and calmodulin protein levels were measured using semiquantitative Western blotting in postmortem temporal cortex in subjects with schizophrenia, major depression and bipolar disorder. Compared to normal controls, mean Par-4 levels appeared slightly lower in schizophrenia and bipolar disorder. However, in major depression, Par-4 was decreased by 67% compared to normal controls. No differences were found between any groups for calmodulin or for the D2DR 48 kDa band. The D2DR 98 kDa band was lower by 50% in the schizophrenia compared to control groups. Changes in the Par-4/D2DR signaling pathway represent a novel mechanism that may link apoptotic and dopamine signaling pathways in major depression and schizophrenia.
Keywords: calmodulin, postmortem, apoptosis, major depression, cortex, synaptophysin
1. Introduction
A number of consistent neuropathological findings in the cortex of subjects with schizophrenia have emerged. These include smaller neurons (Rajkowska et al., 1998; Pierri et al., 2001), reduced gray matter volume (Wright et al., 2000), decreased neuropil (Selemon and Goldman-Rakic, 1999) and an absence of gliosis (Benes et al., 1991). Furthermore, longitudinal neuroimaging studies indicate that some gray matter loss is progressive, especially early in the course of the illness (DeLisi et al., 1997; Cahn et al., 2002). While large scale reductions in cortical neuronal populations have not been found (Akbarian et al., 1995; Rajkowska et al., 1998), regional and layer-specific reductions have been reported (Benes et al., 1991; Benes et al., 2001), as well as reductions in glial populations (Cotter et al., 2001; Stark et al., 2004). In addition, findings of decreased synaptic markers (Eastwood and Harrison, 1995; Glantz and Lewis, 1997) and decreased dendritic length and spine density (Garey et al., 1998; Glantz and Lewis, 2000) suggest that cortical synaptic circuitry is altered. While the pathophysiological basis of these deficits remains unknown, a role for apoptosis in schizophrenia has previously been proposed (reviewed by Glantz et al., 2006).
Apoptosis is a form of cell death that is pervasive during prenatal development of the human central nervous system (CNS), serving to eliminate excess neurons so as to refine synaptic connectivity within and between brain regions. Apoptotic mechanisms can also exert direct effects on local synaptic elimination in a process sometimes called synaptic apoptosis (Glantz et al., 2006). The rate of neuronal apoptosis in the CNS slows dramatically during later development, but can be activated in order to eliminate injured or diseased neurons. Prostate apoptosis response-4 (Par-4) is a pro-apoptotic protein first identified in prostate cancer cells undergoing apoptosis (Sells et al., 1994). Par-4 is expressed in neurons – but not glia – with preferential localization to synapses in most cortical regions (Boghaert et al., 1997; Guo et al., 1998; Guo et al., 2001). Levels of Par-4 are increased in multiple brain and spinal cord regions in patients with classic neurodegenerative illnesses such as Alzheimer's disease (Guo et al., 1998) and amyotrophic lateral sclerosis (Pedersen et al., 2000). Neuronal levels of Par-4 are rapidly increased following exposure to pro-apoptotic stimuli such as neurotrophic factor deprivation and hypoxia/ischemia (Guo et al., 1998; Duan et al., 1999). Par-4 upregulation is also known to suppress expression of the neuroprotective anti-apoptotic Bcl-2 protein in transgenic cells (Camandola and Mattson, 2000), potentially contributing to reduced Bcl-2 levels found in postmortem temporal cortex in schizophrenia (Jarskog et al., 2004; Jarskog et al., 2000). During apoptosis, Par-4 is thought to regulate mitochondrial function and caspase cleavage via its leucine zipper domain (Guo et al., 1998; Chan et al., 1999; Duan et al., 1999). Interestingly, a recent study found that Par-4, together with calmodulin, also exerts a physiological role in dopamine D2 receptor (D2DR) signaling (Park et al., 2005).
Given these converging lines of data, Par-4, calmodulin and D2DR were measured in postmortem temporal cortex of subjects with schizophrenia, major depression, bipolar disorder and in normal controls. It was hypothesized that evidence for altered cortical Par-4 levels could represent a mechanism relating apoptotic dysregulation to deficits in dopamine signaling in schizophrenia.
2. Materials and Methods
2.1 Subjects
Frozen temporal cortical specimens from 60 human brains were obtained from the Stanley Foundation Neuropathology Consortium (Bethesda, Maryland). Brain tissue was collected as described in detail by Torrey et al. (2000). In brief, the Stanley Foundation received specimens from four state medical examiners that were collected using standardized protocols for tissue procurement and processing. DSM-IV diagnoses were determined by two senior psychiatrists using all available medical records and from family interviews. Subjects over 68 years of age were excluded from the collection to reduce the likelihood of comorbid neurological disorders.
Samples were group-matched for age, gender, ethnicity, brain hemisphere, brain pH, and postmortem interval (PMI) and consisted of four diagnoses: normal control, schizophrenia, bipolar disorder, and major depressive disorder (Torrey et al., 2000), see Table 1 and online supplementary information for additional demographic and biochemical data for each postmortem subject. Groups consisted of 15 subjects each except for the following experiments where certain groups were decreased in number due to limited tissue availability: synaptophysin (schizophrenia = 14; bipolar disorder = 14); D2DR (normal control = 14; schizophrenia = 14; bipolar disorder = 14); and calmodulin (normal control = 14; schizophrenia = 13; bipolar disorder = 13). All samples were stored at -80°C until use. All procedures were approved by the Institutional Review Board of the University of North Carolina School of Medicine.
Table 1.
Summary Characteristics of Subject Groups in the Stanley Foundation Neuropathology Consortium
| Diagnosis | N | Gender | Race | Age Mean (SD) | PMI (hrs) Mean (SD) | pH Mean (SD) | Duration of illness (yrs) Mean (SD) |
|---|---|---|---|---|---|---|---|
| Normal Control | 15 | 9 M / 6 F | 14 C / 1 AA | 48.1 (10.7) | 23.7 (9.9) | 6.27 (0.2) | N/A |
| Schizophrenia | 15 | 9 M / 6 F | 13 C / 2 A | 44.5 (13.1) | 33.7 (14.6) | 6.16 (0.3) | 21.3 (11.4) |
| Bipolar Disorder | 15 | 9 M / 6 F | 14 C / 1 AA | 42.3 (11.7) | 32.5 (16.1) | 6.17 (0.2) | 20.1 (9.7) |
| Major Depression | 15 | 9 M / 6 F | 15 C | 46.5 (9.3) | 27.5 (10.7) | 6.18(0.2) | 12.7 (11.1) |
Abbreviations: F, female; M, male; A, Asian; AA, African-American; C, Caucasian; R, right; L, left; PMI, postmortem interval; SD, standard deviation; N/A, not applicable.
2.2 Western Blot Procedures
Tissue blocks (100-300 mg) from temporal cortex (Brodmann area 21) were placed in 10 volumes of 10 mM HEPES buffer (pH 7.0) with 0.32 M sucrose, 0.1 mM phenylmethylsulfonyl fluoride (PMSF), 10 μg/ml aprotinin, 5 μg/ml pepstatin A, 1 mM benzamidine, 0.1 mM benzethenium chloride. Samples were homogenized (PowerGen 125, Fisher Scientific) on ice for 30 sec and sonicated (Sonic Dismembrator 60, Fisher Scientific) for 10 sec at 10 mV. Samples were centrifuged for 15 min at 15,000 x g at 4°C. Supernatants were assayed for total protein by the BCA method (Pierce, Rockford IL). All chemicals were obtained from Sigma-Aldrich (St. Louis, MO).
Western blotting experiments were performed to measure the relative levels of Par-4, D2DR and calmodulin. Synaptophysin was also measured to control for total synaptic content. For each protein, three separate Western blot experiments were run for all 60 samples. Samples were separated on 10% (synaptophysin and Par-4), 4-12% (D2DR) or 10-20% (calmodulin) Tris-glycine polyacrylamide gels using a mini-cell electrophoresis unit (Invitrogen, Carlsbad CA). Equal amounts of protein (Par-4, D2DR: 100 μg; synaptophysin: 1 μg; calmodulin: 10 μg) were boiled for 5 min and loaded into wells. All gels were run with a low-range molecular weight marker (Rainbow MW Marker, Amersham Pharmacia, Piscataway NJ or Magic Mark XP, Invitrogen, Carlsbad CA). Par-4-stained gels were run with Par-4 protein (Santa Cruz Biotechnology, Santa Cruz CA) controls and D2DR-stained gels were run with SK-N-SH cell lysate (Santa Cruz Biotechnology). Separated proteins were transferred to polyvinylidene difluoride (PVDF) membranes (Immobilon-P, Millipore MA) at 25V for 90 min and complete and uniform transfer was verified by staining membranes with Ponceau S. Non-specific protein binding was blocked with 5% milk in 0.1% Tween TBS. Membranes were incubated overnight at 4°C with primary antibodies as follows: rabbit polyclonal Par-4 (1:1000; Santa Cruz Biotechnology), mouse monoclonal synaptophysin (1:2000; Sigma-Aldrich), goat polyclonal D2DR (1:100; Santa Cruz Biotechnology) and rabbit polyclonal calmodulin (1:8000; Abcam Inc., Cambridge MA) in 5% milk. Membranes were then washed and incubated for 1 hr with a HRP-conjugated secondary antibody in 5% milk (Par-4: 1:2000, Synaptophysin: 1:4000, calmodulin: 1:3000, Amersham Pharmacia; D2DR: 1:3000, Sigma-Aldrich). Membranes were washed and then immunoreactivity was visualized using chemiluminescence (ECL, Amersham Pharmacia) and proteins bands were detected on radiographic film (Hyperfilm ECL, Amersham Pharmacia). Optical densitometry measurements were performed in a blinded manner and integrated optical density (OD) was determined using a computerized image analysis system (Bioquant, Nashville TN). Raw ODs were normalized to a pooled control sample consisting of equal protein amounts of each brain sample which was applied to each blot to allow for intergel comparisons. Membranes were also stripped using IgG Elution Buffer (Fisher Scientific) and reprobed with a polyclonal rabbit antibody to glyceraldehyde 3-phosphate dehydrogenase (GAPDH) (1:60,000, Imgenex, San Diego CA) in order to confirm equal loading across samples. GAPDH levels were unchanged across diagnostic groups by ANOVA (F3,55=0.67, P=0.58). In addition, a standard curve of the pooled control sample was immunoblotted to ascertain that tissue samples fell within the linear portion of the densitometric curve (data not shown).
2.3 Par-4 Immunohistochemistry
To provide a qualitative assessment of the cellular and subcellular distribution of Par-4 in human cortex, sections from control subjects were processed for Par-4 immunohistochemistry. Tissue sections from the same temporal cortical area used for the Western blot experiments were not available. However, frozen sections (14 μm thick) from prefrontal cortex from the same control group subjects were available for this study. Sections were pretreated in aqueous 1% hydrogen peroxide for 30 min at room temperature in order to remove endogenous peroxidase activity, washed, and then incubated at room temperature for 30 min in phosphate-buffered saline (PBS) containing 0.3% Triton X-100 and 4.5% normal goat serum. Sections were incubated overnight at 4°C in PBS containing 0.3% Triton X-100, 0.05% bovine serum albumin, 3% normal goat serum and a polyclonal antibody that specifically recognizes Par-4 (1:1000; Santa Cruz Biotechnology, Santa Cruz CA; Boghaert et al. 1997). Sections were then processed using a standard Vectastain ABC kit (Vector Laboratories, Burlingame CA) and diaminobenzidine.
2.4 Rat Models of Postmortem Stability and Antidepressant Treatment Effects
In order to determine the effects of postmortem interval on the proteins analyzed in this study, male Sprague-Dawley rats (150-200 g, Charles River, Raleigh NC) were killed and, in one group (n=6), frontal cortex was dissected and immediately frozen at -80°C. To approximate the human postmortem condition, heads of the other group (n=7) were kept at 25°C for 6 h and then at 4°C for 18 h, after which the frontal cortex was dissected out and frozen.
To determine whether antidepressant medication influenced protein levels, cortical tissue homogenates were obtained from Flinders Sensitive Line (FSL) rats, a preclinical model of depression (Overstreet et al., 2005), and Flinders Resistant Line (FRL) rats (n=8 per group). FRL rats served as a control group for the FSL condition. FSL rats received daily intraperitoneal injections for 14 days with vehicle or desmethylimipramine (5 mg/kg) while FRL rats received vehicle only.
All rat tissues were homogenized and sonicated, and Western blots of Par-4, D2DR and calmodulin were performed as described in section 2.2 with the following exceptions for the Par-4 Westerns: 25 ug total protein per sample was loaded onto 4-12% Tris-glycine gels and the primary Par-4 antibody dilution was 1:2000.
2.5 Statistical Analysis
Western blot data from human and rat tissue were analyzed by one-way analysis of variance (ANOVA) with significance set at α=0.05. Post hoc analyses using the Tukey's multiple comparison test were performed using two-tailed P values considered significant at α= 0.05. Statistical analysis was performed using GraphPad Prism (Version 4.01 GraphPad Software, San Diego CA).
3. Results
3.1 Par-4 Western Blot
Par-4-immunoreactive bands were visualized in each cortical sample, demonstrating a migration pattern similar to previous Western blot studies (Park et al., 2005). Antibody specificity was confirmed using a Par-4 positive control fusion protein (Figure 1). Par-4 levels demonstrated a significant effect of diagnosis by ANOVA (F3,56=2.9, P<0.05; Figure 2). Although mean Par-4 band immunoreactivity in subjects with schizophrenia and bipolar disorder were 46% and 31% lower than controls, respectively, these differences were not significant using post hoc Tukey's multiple comparison tests. However, mean Par-4 band immunoreactivity was 67% lower in subjects with major depression compared to normal control subjects (P<0.05). Par-4 values did not correlate with PMI or pH.
Figure 1.

Representative Western blot of Par-4 protein in temporal cortex in patients with schizophrenia (S), bipolar disorder (B), major depression (MD) and in normal control (N) subjects. Equal amounts of total protein were resolved on a 10% Tris-glycine polyacrylamide gel, transferred to a PVDF membrane and incubated with a primary Par-4 antibody. Immunoreactive bands migrated to ∼45 kDa. Lane P contained a sample of pooled cortical homogenates and lane C contained a positive control for Par-4, expressed in E. coli as a 50 kDa polyhistidine-tagged fusion protein.
Figure 2.

Scatter plot of normalized optical densities (nOD) of Par-4 immunoreactive bands and respective mean values in temporal cortex in patients with schizophrenia (Scz), bipolar disorder (BD), major depression (MD), and in normal control (Con) subjects (n=15 per group). Par-4 demonstrated an effect of diagnosis by ANOVA (F3,56=2.9, P<0.05). A post hoc Tukey's multiple comparison test showed mean Par-4 level in patients with major depression was 67% lower compared to normal controls (P<0.05).
3.2 D2DR Western Blot
Two prominent bands were identified for D2DR at 48 and 98 kDa (Figure 3). The 48 kDa band represents the receptor monomer and the 98 kDa band is the receptor dimer, consistent with prior Western blot studies of D2DR in human brain (Zawarynski et al., 1998). For the 48 kDa band, no differences were seen between the subject groups by ANOVA (F3,53=0.998, P=0.4; Figure 4A). However, for the 98 kDa band, a significant effect of diagnosis was seen by ANOVA (F3,53=3.3, P<0.05; Figure 4B). A post hoc Tukey's multiple comparison test found that mean D2DR 98 kDa band level was lower by 55% (P<0.05) in subjects with schizophrenia compared to normal control subjects. Numerically, 98 kDa levels were also lower for bipolar disorder (50%) and major depression (53%) compared to normal controls but these differences did not reach statistical significance. Par-4 values and the 98 kDa band showed a positive linear correlation across all samples (F1,55=12.2, P<0.05, r2=0.18). The 98 kDa levels did not correlate with PMI or pH.
Figure 3.

Representative Western blot of D2 dopamine receptor (D2DR) protein in temporal cortex in patients with schizophrenia (S), bipolar disorder (B), major depression (MD) and in normal control (C) subjects. Equal amounts of total protein were resolved on a 4-12% Tris-glycine polyacrylamide gel, transferred to a PVDF membrane and incubated with a primary antibody for D2DR. Immunoreactive bands migrating to 48 kD and 98 kD are consistent with D2DR monomers and dimers. Lane P contained a sample of pooled cortical homogenates.
Figure 4.

Scatter plots of normalized optical densities (nOD) of (A) 48 kDa immunoreactive bands and (B) 98 kDa immunoreactive bands of D2DR and respective mean values in postmortem temporal cortex in patients with schizophrenia (Scz, n=14), bipolar disorder (BD, n=14), major depression (MD, n=15), and in normal control (Con, n=14) subjects. D2DR 98 kDa demonstrated an effect of diagnosis by ANOVA (F3,53=3.3, P<0.05). A post hoc Tukey's multiple comparison test showed mean D2DR 98 kDa levels were 55% lower in patients with schizophrenia compared to normal controls (P<0.05).
3.3 Calmodulin Western Blot
Calmodulin-immunoreactive bands were seen at the expected molecular weight of 17 kDa in each of the samples. Mean calmodulin levels did not differ across diagnostic groups by ANOVA (F3,51=0.48, P=0.70; Figure 5). Par-4 and calmodulin levels did not correlate (F1,53=1.6, P=0.21, r2=0.03).
Figure 5.

Scatter plot of normalized optical densities (nOD) of calmodulin-immunoreactive bands and respective mean values in postmortem temporal cortex in patients with schizophrenia (Scz, n=13), bipolar disorder (BD, n=13), major depression (MD, n=15), and in normal control (Con, n=14) subjects. Calmodulin demonstrated no effect of diagnosis by ANOVA (F3,51=0.48, P=0.70).
3.4 Synaptophysin Western Blot
Synaptophysin-immunoreactive bands were seen at the predicted molecular weight of 38 kDa (data not shown). Mean synaptophysin levels did not differ across diagnostic groups by ANOVA (F3,54=1.92, P=0.14; Figure 6). Numerically, mean synaptophysin levels in subjects with schizophrenia, bipolar disorder and major depression were 41%, 45% and 1% lower compared to normal control subjects but these differences were not statistically significant. These findings suggest that the decrease in Par-4 levels in subjects with major depression compared to normal controls is not secondary to reduced synapses in this region.
Figure 6.

Scatter plot of normalized optical densities (nOD) of synaptophysin-immunoreactive bands and respective mean values in postmortem temporal cortex in patients with schizophrenia (Scz, n=14), bipolar disorder (BD, n=14), major depression (MD, n=15), and in normal control (Con, n=15) subjects. Synaptophysin demonstrated no effect of diagnosis by ANOVA (F3,54=1.92, P=0.14).
3.5 Par-4 Immunohistochemistry
Immunohistochemistry of frozen prefrontal cortical sections demonstrated a subset of Par-4 immunoreactive neurons in normal control subjects (see Figure 7). Some of these neurons exhibited a pyramidal shape. Par-4 immunoreactivity could be seen in the cell body, extending into the proximal pyramidal and basilar dendrites. Other immunoreactive neurons were smaller and round, presumably representing nonpyramidal neurons since in vitro and animal studies indicate that Par-4 is not expressed in glia. In addition, immunoreactivity within the cortical neuropil exhibited a punctate pattern, consistent with synaptic localization of Par-4 protein. The distribution of Par-4 in human cortex is not known to have been demonstrated previously.
Figure 7.
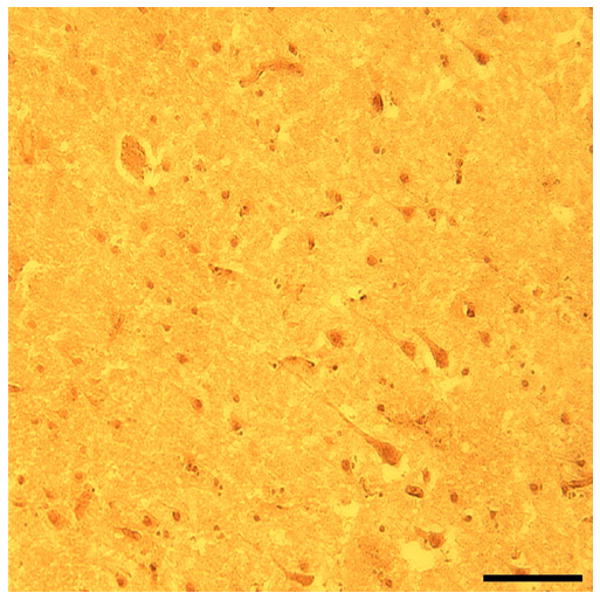
Brightfield photomicrograph from prefrontal cortex of Par-4 immunoreactivity in a 14 μm thick frozen section in a 29 year old normal control subject. Scale bar = 100 μm.
3.6 Protein Postmortem Stability
In order to determine whether PMI affected Par-4 and D2DR levels, rodent brains were subjected to a PMI of 0 or 24 hours. Using this model, Par-4 levels were decreased by 54% after 24 hours PMI (t=0.006, P<0.05). Neither the 48 kDa band (t=0.85, P>0.05) nor the 98 kDa band (t=0.08, P>0.05) of the D2DR showed significant effects of PMI.
3.7 Effects of Antidepressant Medication on Protein Levels
Because Par-4 levels were decreased in subjects with major depression, we examined the potential effects of antidepressant medication on Par-4 in two ways. First, Par-4 levels were compared between those subjects with major depression who were (n=10) and were not (n=5) receiving antidepressants at the time of death. No differences were found between these two groups (t=0.07, P>0.05). Second, Par-4 was measured in the FSL rat model of depression (Overstreet et al., 2005) as follows: FSL antidepressant-treated, FSL vehicle-treated and FRL control rats. No differences in Par-4 levels were found among these 3 groups (Figure 8). D2DR and calmodulin levels were also examined in these three groups and no differences were seen (data not shown). These represent several lines of evidence that antidepressant treatment did not confound the human postmortem data.
Figure 8.
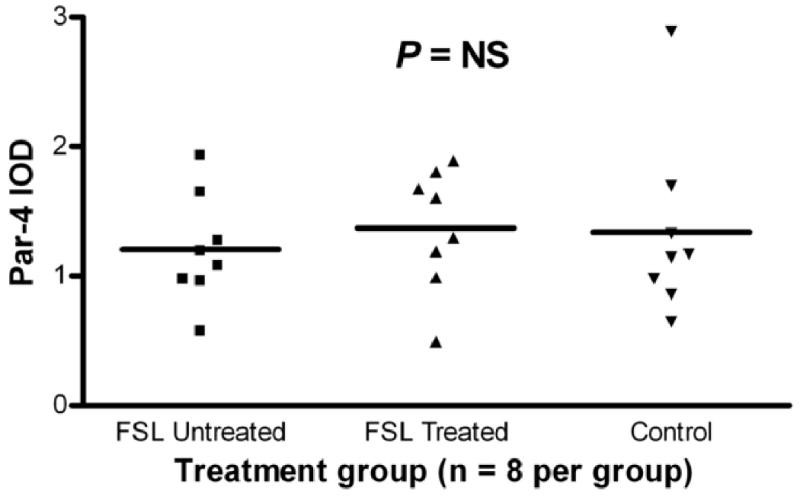
Scatter plot of integrated optical densities (IOD) of Par-4-immunoreactive bands and respective mean values in the cortex of Flinders Sensitive Line (FSL), a rat model of depression, and Flinders Resistant Line (FRL) rats as controls. FSL “treated” rats received daily i.p. desmethylimipramine for 2 weeks, FSL “untreated” rats received vehicle for 2 weeks and FRL “control” rats received 2 weeks vehicle. Par-4 demonstrated no effect of treatment between the 3 groups.
4. Discussion
The known functions of Par-4 include well-established pro-apoptotic effects (Guo et al., 1998) as well as more recently discovered involvement in D2DR signaling (Park et al., 2005). In this study, we sought to determine whether Par-4 protein was altered in temporal cortex of subjects with schizophrenia, major depression and bipolar disorder. Although Par-4 levels appeared somewhat lower in subjects with schizophrenia and bipolar disorder compared to normal controls, these differences did not reach statistical significance. However, mean Par-4 levels were decreased by 67% in major depression compared to controls. Interestingly, this supports a Par-4 mutant mouse model of depression in which Par-4 binding to D2DR is disrupted, effectively reducing Par-4 availability for normal D2DR signaling (Park et al., 2005). Par-4 mutant mouse behavioral phenotype included increased immobility during the forced swim test, increased latency to contact novel food, and decreased open-field exploration. The substantial reduction of Par-4 abundance in postmortem cortex in major depression may functionally replicate altered Par-4/D2DR signaling seen in the Par-4 mouse model and suggests pathophysiological relevance of low cortical Par-4 levels.
Cortical levels of the D2DR 98 kDa dimer were approximately 50% lower in schizophrenia, major depression and bipolar disorder compared to normal controls, although only the schizophrenia group reached statistical significance. A role for dopamine dysregulation has long been demonstrated in schizophrenia (reviewed by Guillin et al., 2007), including several lines of evidence for altered D2DR signaling in temporal cortex, such as PET studies of D2/3 receptors showing decreased binding in the temporal cortex of drug-naïve subjects (Tuppurainen et al., 2003; Buchsbaum et al., 2006) altered distribution of D2DR in postmortem temporal lobe (Goldsmith et al., 1997) and reduced Akt1 levels, an anti-apoptotic protein downstream from D2DR that helps regulate dopamine neurotransmission in frontal cortex and hippocampus (Chang et al., 2003; Beaulieu et al., 2005; Emamian et al., 2004; Zhao et al., 2006). Additionally, Par-4 and D2DR levels were positively correlated across all samples, further evidence supporting a functional interaction between these two factors. Calmodulin, which competes with Par-4 for D2DR binding, was unchanged across the diagnostic groups. Taken together, the data suggest that the Par-4/D2DR signaling pathway is altered in major depression and, to a lesser extent, in schizophrenia, potentially involving mechanisms of both apoptosis and dopamine signaling.
cAMP is a well established second messenger of D2DR signaling. Normally, D2DR activity is associated with inhibition of cAMP signaling (Bonci and Hopf, 2005). However, when Par-4 expression was knocked down by RNA interference, D2DR activation increased cAMP activity suggesting that Par-4 is necessary for optimizing D2DR efficacy. The Par-4 mouse model of depression lacking the leucine zipper domain where Par-4 interacts with the D2DR had increased cAMP levels (Park et al., 2005). It should be noted that the leucine zipper domain of Par-4 could potentially interact with proteins other than D2DR (Sells et al., 1997; Guo et al., 1998) although in a yeast two-hybrid assay the Par-4/D2DR interaction appeared relatively specific (Park et al., 2005). These data demonstrate how the integrity of Par-4/D2DR interactions can directly affect cAMP signaling, providing additional insight into the mechanism by which Par-4 deficits may contribute to major depression.
Several other groups have also studied Par-4 in psychiatric illnesses. Par-4 protein levels in lymphocytes and in postmortem frontal cortex of subjects with schizophrenia and bipolar disorder were unchanged compared to normal matched controls (Amar et al., 2008). No evidence for variation in the Par-4 gene was found in Japanese patients with schizophrenia, bipolar disorder or major depression (Kishi et al., 2008). However, Chinese female patients with schizophrenia were found to have two missense single nucleotide polymorphisms of the Par-4 gene (Wang et al., 2008).
Transgenic mice overexpressing Par-4 have demonstrated that Par-4 inhibits the DNA-binding activity of NF-κB (Camandola and Mattson, 2000; El-Guendy and Rangnekar, 2003), an anti-apoptotic transcription factor (Won et al., 2002). Interestingly, increased levels of NF-κB have been found in the frontal cortex of patients with schizophrenia, bipolar disorder, and major depression compared to normal control subjects (Sun et al., 2001). Our findings of decreased Par-4 in subjects with major depression could potentially contribute to evidence for a reciprocal increase in NF-κB expression. In addition, levels of anti-apoptotic Bcl-2 protein were decreased in the temporal cortex of the same subjects with schizophrenia that were examined in the current study (Jarskog et al., 2000). On the other hand, since Par-4 upregulation is known to suppress Bcl-2 expression (Camandola and Mattson, 2000), the current data indicate that Par-4 likely did not account for low cortical Bcl-2 in schizophrenia. In fact, the evidence for slightly lower Par-4 in schizophrenia is consistent with data that apoptosis may be downregulated in schizophrenia, at least in later stages of illness, including postmortem studies showing reduced DNA fragmentation in cingulate cortex (Benes et al., 2003), downregulation of multiple pro-apoptotic genes in hippocampus (Benes et al., 2006), and reduced ARTS/Sept 4 protein in frontal cortex (Gottfried et al., 2007).
Several potentially confounding variables were considered. Because Par-4 is preferentially localized to the postsynaptic density (Guo et al., 2001), decreased Par-4 could potentially reflect the effects of reduced synaptic density. A number of studies have demonstrated decreased cortical levels of synaptic marker proteins such as synaptophysin (Perrone-Bizzozero et al., 1996; Glantz and Lewis, 1997) and SNAP-25 (Thompson et al., 1998; Karson et al., 1999) in schizophrenia compared to controls. However, the current study found no difference in synaptophysin levels in any of the patient groups compared to normal controls, even when stratifying for antidepressant treatment at the time of death. The effects of psychotropic treatment were also considered. Rats that received 2 weeks of daily antidepressant treatment showed no effect on cortical Par-4 levels. Further, previous studies indicate that D2DR binding is upregulated (not downregulated) in monkey prefrontal and temporal cortices after antipsychotic treatment (Lidow and Goldman-Rakic, 1994), suggesting that antipsychotic treatment did not confound the evidence for lower D2DR levels in schizophrenia. Postmortem stability of Par-4 showed a reduction of 54% in Par-4 levels over 24 hours PMI. While this is a substantial reduction, the diagnostic groups were matched for PMI and it is unlikely that PMI exerted a differentially greater effect on Par-4 in the major depression group compared to the other groups. D2DR levels showed no change over 24 hours PMI. Finally, while samples were also group-matched on age, gender, ethnicity, brain hemisphere, and brain pH, the duration of illness was significantly shorter in the depression group compared to the schizophrenia and bipolar groups. A linear regression analysis found no association between duration of illness and Par-4 levels (r=0.019, p=0.898). Considered together, these potentially confounding variables do not appear to have exerted a significant effect on the results.
In summary, this study found changes in the Par-4/D2DR receptor pathway in postmortem temporal cortex in patients with major depression, with more subtle changes also found in patients with schizophrenia. The pathophysiological significance of low Par-4 levels remains uncertain; however, mechanisms involving both the regulation of apoptosis and dopamine signaling must be considered. Given that the current findings appear to support the Par-4 mouse model of depression, further study of Par-4 in model systems and in human postmortem brain tissue is warranted.
Supplementary Material
Footnotes
Publisher's Disclaimer: This is a PDF file of an unedited manuscript that has been accepted for publication. As a service to our customers we are providing this early version of the manuscript. The manuscript will undergo copyediting, typesetting, and review of the resulting proof before it is published in its final citable form. Please note that during the production process errors may be discovered which could affect the content, and all legal disclaimers that apply to the journal pertain.
Reference List
- Akbarian S, Kim JJ, Potkin SG, Hagman JO, Tafazzoli A, Bunney WE, Jr, Jones EG. Gene expression for glutamic acid decarboxylase is reduced without loss of neurons in prefrontal cortex of schizophrenics. Arch Gen Psychiatry. 1995;52(4):258–266. doi: 10.1001/archpsyc.1995.03950160008002. [DOI] [PubMed] [Google Scholar]
- Amar S, Shaltiel G, Mann L, Shamir A, Dean B, Scarr E, Bersudsky Y, Belmaker RH, Agam G. Possible involvement of post-dopamine D2 receptor signalling components in the pathophysiology of schizophrenia. Int J Neuropsychopharmacol. 2008;11(2):197–205. doi: 10.1017/S1461145707007948. [DOI] [PubMed] [Google Scholar]
- Beaulieu JM, Sotnikova TD, Marion S, Lefkowitz RJ, Gainetdinov RR, Caron MG. An Akt/beta-arrestin 2/PP2A signaling complex mediates dopaminergic neurotransmission and behavior. Cell. 2005;122(2):261–273. doi: 10.1016/j.cell.2005.05.012. [DOI] [PubMed] [Google Scholar]
- Benes FM, Matzilevich D, Burke RE, Walsh J. The expression of proapoptosis genes is increased in bipolar disorder, but not in schizophrenia. Mol Psychiatry. 2006;11(3):241–251. doi: 10.1038/sj.mp.4001758. [DOI] [PubMed] [Google Scholar]
- Benes FM, McSparren J, Bird ED, SanGiovanni JP, Vincent SL. Deficits in small interneurons in prefrontal and cingulate cortices of schizophrenic and schizoaffective patients. Arch Gen Psychiatry. 1991;48(11):996–1001. doi: 10.1001/archpsyc.1991.01810350036005. [DOI] [PubMed] [Google Scholar]
- Benes FM, Vincent SL, Todtenkopf M. The density of pyramidal and nonpyramidal neurons in anterior cingulate cortex of schizophrenic and bipolar subjects. Biol Psychiatry. 2001;50(6):395–406. doi: 10.1016/s0006-3223(01)01084-8. [DOI] [PubMed] [Google Scholar]
- Benes FM, Walsh J, Bhattacharyya S, Sheth A, Berretta S. DNA fragmentation decreased in schizophrenia but not bipolar disorder. Arch Gen Psychiatry. 2003;60(4):359–364. doi: 10.1001/archpsyc.60.4.359. [DOI] [PubMed] [Google Scholar]
- Boghaert ER, Sells SF, Walid AJ, Malone P, Williams NM, Weinstein MH, Strange R, Rangnekar VM. Immunohistochemical analysis of the proapoptotic protein Par-4 in normal rat tissues. Cell Growth Differ. 1997;8(8):881–890. [PubMed] [Google Scholar]
- Bonci A, Hopf FW. The dopamine D2 receptor: new surprises from an old friend. Neuron. 2005;47(3):335–338. doi: 10.1016/j.neuron.2005.07.015. [DOI] [PubMed] [Google Scholar]
- Buchsbaum MS, Christian BT, Lehrer DS, Narayanan TK, Shi B, Mantil J, Kemether E, Oakes TR, Mukherjee J. D2/D3 dopamine receptor binding with [F-18]fallypride in thalamus and cortex of patients with schizophrenia. Schizophr Res. 2006;85(1-3):232–244. doi: 10.1016/j.schres.2006.03.042. [DOI] [PubMed] [Google Scholar]
- Cahn W, Hulshoff Pol HE, Lems EBTE, van Haren NEM, Schnack HG, van der Linden JA, Schothorst PF, van Engeland H, Kahn RS. Brain volume changes in first-episode schizophrenia: a 1-year follow-up study. Arch Gen Psychiatry. 2002;59(11):1002–1010. doi: 10.1001/archpsyc.59.11.1002. [DOI] [PubMed] [Google Scholar]
- Camandola S, Mattson MP. Pro-apoptotic action of PAR-4 involves inhibition of NF-kappaB activity and suppression of BCL-2 expression. J Neurosci Res. 2000;61(2):134–139. doi: 10.1002/1097-4547(20000715)61:2<134::AID-JNR3>3.0.CO;2-P. [DOI] [PubMed] [Google Scholar]
- Chan SL, Tammariello SP, Estus S, Mattson MP. Prostate apoptosis response-4 mediates trophic factor withdrawal-induced apoptosis of hippocampal neurons: actions prior to mitochondrial dysfunction and caspase activation. J Neurochem. 1999;73(2):502–512. doi: 10.1046/j.1471-4159.1999.0730502.x. [DOI] [PubMed] [Google Scholar]
- Chang F, Lee JT, Navolanic PM, Steelman LS, Shelton JG, Blalock WL, Franklin RA, McCubrey JA. Involvement of PI3K/Akt pathway in cell cycle progression, apoptosis, and neoplastic transformation: a target for cancer chemotherapy. Leukemia. 2003;17(3):590–603. doi: 10.1038/sj.leu.2402824. [DOI] [PubMed] [Google Scholar]
- Cotter DR, Pariante CM, Everall IP. Glial cell abnormalities in major psychiatric disorders: the evidence and implications. Brain Res Bull. 2001;55(5):585–595. doi: 10.1016/s0361-9230(01)00527-5. [DOI] [PubMed] [Google Scholar]
- DeLisi LE, Sakuma M, Tew W, Kushner M, Hoff AL, Grimson R. Schizophrenia as a chronic active brain process: a study of progressive brain structural change subsequent to the onset of schizophrenia. Psychiatry Res. 1997;74(3):129–140. doi: 10.1016/s0925-4927(97)00012-7. [DOI] [PubMed] [Google Scholar]
- Duan W, Rangnekar VM, Mattson MP. Prostate apoptosis response-4 production in synaptic compartments following apoptotic and excitotoxic insults: evidence for a pivotal role in mitochondrial dysfunction and neuronal degeneration. J Neurochem. 1999;72(6):2312–2322. doi: 10.1046/j.1471-4159.1999.0722312.x. [DOI] [PubMed] [Google Scholar]
- Eastwood SL, Harrison PJ. Decreased synaptophysin in the medial temporal lobe in schizophrenia demonstrated using immunoautoradiography. Neuroscience. 1995;69(2):339–343. doi: 10.1016/0306-4522(95)00324-c. [DOI] [PubMed] [Google Scholar]
- El-Guendy N, Rangnekar VM. Apoptosis by Par-4 in cancer and neurodegenerative diseases. Exp Cell Res. 2003;283(1):51–66. doi: 10.1016/s0014-4827(02)00016-2. [DOI] [PubMed] [Google Scholar]
- Emamian ES, Hall D, Birnbaum MJ, Karayiorgou M, Gogos JA. Convergent evidence for impaired AKT1-GSK3beta signaling in schizophrenia. Nat Genet. 2004;36(2):131–137. doi: 10.1038/ng1296. [DOI] [PubMed] [Google Scholar]
- Garey LJ, Ong WY, Patel TS, Kanani M, Davis A, Mortimer AM, Barnes TR, Hirsch SR. Reduced dendritic spine density on cerebral cortical pyramidal neurons in schizophrenia. J Neurol Neurosurg Psychiatry. 1998;65(4):446–453. doi: 10.1136/jnnp.65.4.446. [DOI] [PMC free article] [PubMed] [Google Scholar]
- Glantz LA, Gilmore JH, Lieberman JA, Jarskog LF. Apoptotic mechanisms and the synaptic pathology of schizophrenia. Schizophr Res. 2006;81(1):47–63. doi: 10.1016/j.schres.2005.08.014. [DOI] [PubMed] [Google Scholar]
- Glantz LA, Lewis DA. Reduction of synaptophysin immunoreactivity in the prefrontal cortex of subjects with schizophrenia. Regional and diagnostic specificity. Arch Gen Psychiatry. 1997;54(10):943–952. doi: 10.1001/archpsyc.1997.01830220065010. [DOI] [PubMed] [Google Scholar]
- Glantz LA, Lewis DA. Decreased dendritic spine density on prefrontal cortical pyramidal neurons in schizophrenia. Arch Gen Psychiatry. 2000;57(1):65–73. doi: 10.1001/archpsyc.57.1.65. [DOI] [PubMed] [Google Scholar]
- Goldsmith SK, Shapiro RM, Joyce JN. Disrupted pattern of D2 dopamine receptors in the temporal lobe in schizophrenia. A postmortem study. Arch Gen Psychiatry. 1997;54(7):649–658. doi: 10.1001/archpsyc.1997.01830190077008. [DOI] [PubMed] [Google Scholar]
- Gottfried Y, Rotem A, Klein E, Larisch S. The pro-apoptotic ARTS/Sept4 protein is significantly reduced in post-mortem brains from schizophrenic patients. Schizophr Res. 2007;96(1-3):257–266. doi: 10.1016/j.schres.2007.05.031. [DOI] [PubMed] [Google Scholar]
- Guillin O, Abi-Dargham A, Laruelle M. Neurobiology of dopamine in schizophrenia. Int Rev Neurobiol. 2007;78:1–39. doi: 10.1016/S0074-7742(06)78001-1. [DOI] [PubMed] [Google Scholar]
- Guo Q, Fu W, Xie J, Luo H, Sells SF, Geddes JW, Bondada V, Rangnekar VM, Mattson MP. Par-4 is a mediator of neuronal degeneration associated with the pathogenesis of Alzheimer disease. Nat Med. 1998;4(8):957–962. doi: 10.1038/nm0898-957. [DOI] [PubMed] [Google Scholar]
- Guo Q, Xie J, Chang X, Zhang X, Du H. Par-4 is a synaptic protein that regulates neurite outgrowth by altering calcium homeostasis and transcription factor AP-1 activation. Brain Res. 2001;903(1-2):13–25. doi: 10.1016/s0006-8993(01)02304-6. [DOI] [PubMed] [Google Scholar]
- Jarskog LF, Gilmore JH, Selinger ES, Lieberman JA. Cortical bcl-2 protein expression and apoptotic regulation in schizophrenia. Biol Psychiatry. 2000;48(7):641–650. doi: 10.1016/s0006-3223(00)00988-4. [DOI] [PubMed] [Google Scholar]
- Jarskog LF, Selinger ES, Lieberman JA, Gilmore JH. Apoptotic proteins in the temporal cortex in schizophrenia: high Bax/Bcl-2 ratio without caspase-3 activation. Am J Psychiatry. 2004;161(1):109–115. doi: 10.1176/appi.ajp.161.1.109. [DOI] [PubMed] [Google Scholar]
- Karson CN, Mrak RE, Schluterman KO, Sturner WQ, Sheng JG, Griffin WS. Alterations in synaptic proteins and their encoding mRNAs in prefrontal cortex in schizophrenia: a possible neurochemical basis for ‘hypofrontality’. Mol Psychiatry. 1999;4(1):39–45. doi: 10.1038/sj.mp.4000459. [DOI] [PubMed] [Google Scholar]
- Kishi T, Ikeda M, Kitajima T, Suzuki T, Yamanouchi Y, Kinoshita Y, Kawashima K, Ozaki N, Iwata N. No association between prostate apoptosis response 4 gene (PAWR) in schizophrenia and mood disorders in a Japanese population. Am J Med Genet B Neuropsychiatr Genet. 2008;147B(4):531–534. doi: 10.1002/ajmg.b.30634. [DOI] [PubMed] [Google Scholar]
- Lidow MS, Goldman-Rakic PS. A common action of clozapine, haloperidol, and remoxipride on D1- and D2-dopaminergic receptors in the primate cerebral cortex. Proc Natl Acad Sci U S A. 1994;91(10):4353–4356. doi: 10.1073/pnas.91.10.4353. [DOI] [PMC free article] [PubMed] [Google Scholar]
- Overstreet DH, Friedman E, Mathe AA, Yadid G. The Flinders Sensitive Line rat: a selectively bred putative animal model of depression. Neurosci Biobehav Rev. 2005;29(4-5):739–759. doi: 10.1016/j.neubiorev.2005.03.015. [DOI] [PubMed] [Google Scholar]
- Park SK, Nguyen MD, Fischer A, Luke MP, Affar eB, Dieffenbach PB, Tseng HC, Shi Y, Tsai LH. Par-4 links dopamine signaling and depression. Cell. 2005;122(2):275–287. doi: 10.1016/j.cell.2005.05.031. [DOI] [PubMed] [Google Scholar]
- Pedersen WA, Luo H, Kruman I, Kasarskis E, Mattson MP. The prostate apoptosis response-4 protein participates in motor neuron degeneration in amyotrophic lateral sclerosis. FASEB J. 2000;14(7):913–924. doi: 10.1096/fasebj.14.7.913. [DOI] [PubMed] [Google Scholar]
- Perrone-Bizzozero NI, Sower AC, Bird ED, Benowitz LI, Ivins KJ, Neve RL. Levels of the growth-associated protein GAP-43 are selectively increased in association cortices in schizophrenia. Proc Natl Acad Sci U S A. 1996;93(24):14182–14187. doi: 10.1073/pnas.93.24.14182. [DOI] [PMC free article] [PubMed] [Google Scholar]
- Pierri JN, Volk CL, Auh S, Sampson A, Lewis DA. Decreased somal size of deep layer 3 pyramidal neurons in the prefrontal cortex of subjects with schizophrenia. Arch Gen Psychiatry. 2001;58(5):466–473. doi: 10.1001/archpsyc.58.5.466. [DOI] [PubMed] [Google Scholar]
- Rajkowska G, Selemon LD, Goldman-Rakic PS. Neuronal and glial somal size in the prefrontal cortex: a postmortem morphometric study of schizophrenia and Huntington disease. Arch Gen Psychiatry. 1998;55(3):215–224. doi: 10.1001/archpsyc.55.3.215. [DOI] [PubMed] [Google Scholar]
- Selemon LD, Goldman-Rakic PS. The reduced neuropil hypothesis: a circuit based model of schizophrenia. Biol Psychiatry. 1999;45(1):17–25. doi: 10.1016/s0006-3223(98)00281-9. [DOI] [PubMed] [Google Scholar]
- Sells SF, Han SS, Muthukkumar S, Maddiwar N, Johnstone R, Boghaert E, Gillis D, Liu G, Nair P, Monnig S, Collini P, Mattson MP, Sukhatme VP, Zimmer SG, Wood DP, Jr, McRoberts JW, Shi Y, Rangnekar VM. Expression and function of the leucine zipper protein Par-4 in apoptosis. Mol Cell Biol. 1997;17(7):3823–3832. doi: 10.1128/mcb.17.7.3823. [DOI] [PMC free article] [PubMed] [Google Scholar]
- Sells SF, Wood DP, Jr, Joshi-Barve SS, Muthukumar S, Jacob RJ, Crist SA, Humphreys S, Rangnekar VM. Commonality of the gene programs induced by effectors of apoptosis in androgen-dependent and -independent prostate cells. Cell Growth Differ. 1994;5(4):457–466. [PubMed] [Google Scholar]
- Stark AK, Uylings HBM, Sanz-Arigita E, Pakkenberg B. Glial cell loss in the anterior cingulate cortex, a subregion of the prefrontal cortex, in subjects with schizophrenia. Am J Psychiatry. 2004;161(5):882–888. doi: 10.1176/appi.ajp.161.5.882. [DOI] [PubMed] [Google Scholar]
- Sun Y, Zhang L, Johnston NL, Torrey EF, Yolken RH. Serial analysis of gene expression in the frontal cortex of patients with bipolar disorder. Br J Psychiatry Suppl. 2001;41:s137–s141. doi: 10.1192/bjp.178.41.s137. [DOI] [PubMed] [Google Scholar]
- Thompson PM, Sower AC, Perrone-Bizzozero NI. Altered levels of the synaptosomal associated protein SNAP-25 in schizophrenia. Biol Psychiatry. 1998;43(4):239–243. doi: 10.1016/S0006-3223(97)00204-7. [DOI] [PubMed] [Google Scholar]
- Torrey EF, Webster M, Knable M, Johnston N, Yolken RH. The Stanley Foundation Brain Collection and Neuropathology Consortium. Schizophr Res. 2000;44(2):151–155. doi: 10.1016/S0920-9964(99)00192-9. [DOI] [PubMed] [Google Scholar]
- Tuppurainen H, Kuikka J, Viinamaki H, Husso-Saastamoinen M, Bergstrom K, Tiihonen J. Extrastriatal dopamine D 2/3 receptor density and distribution in drug-naive schizophrenic patients. Mol Psychiatry. 2003;8(4):453–455. doi: 10.1038/sj.mp.4001334. [DOI] [PubMed] [Google Scholar]
- Wang LH, Chen JY, Liou YJ, Wang YC, Lai IC, Liao DL, Chen CH. Association of missense variants of the PRKC, apoptosis, WT1, regulator (PAWR) gene with schizophrenia. Prog Neuropsychopharmacol Biol Psychiatry. 2008;32(3):870–875. doi: 10.1016/j.pnpbp.2008.01.003. [DOI] [PubMed] [Google Scholar]
- Won SJ, Kim DY, Gwag BJ. Cellular and molecular pathways of ischemic neuronal death. J Biochem Mol Biol. 2002;35(1):67–86. doi: 10.5483/bmbrep.2002.35.1.067. [DOI] [PubMed] [Google Scholar]
- Wright IC, Rabe-Hesketh S, Woodruff PW, David AS, Murray RM, Bullmore ET. Meta-analysis of regional brain volumes in schizophrenia. Am J Psychiatry. 2000;157(1):16–25. doi: 10.1176/ajp.157.1.16. [DOI] [PubMed] [Google Scholar]
- Zawarynski P, Tallerico T, Seeman P, Lee SP, O'Dowd BF, George SR. Dopamine D2 receptor dimers in human and rat brain. FEBS Lett. 1998;441(3):383–386. doi: 10.1016/s0014-5793(98)01588-9. [DOI] [PubMed] [Google Scholar]
- Zhao Z, Ksiezak-Reding H, Riggio S, Haroutunian V, Pasinetti GM. Insulin receptor deficits in schizophrenia and in cellular and animal models of insulin receptor dysfunction. Schizophr Res. 2006;84(1):1–14. doi: 10.1016/j.schres.2006.02.009. [DOI] [PubMed] [Google Scholar]
Associated Data
This section collects any data citations, data availability statements, or supplementary materials included in this article.