

Abstract
Chronic constant hypoxia (CCH), such as in pulmonary diseases or high altitude, and chronic intermittent hypoxia (CIH), such as in sleep apnea, can lead to major changes in the heart. Molecular mechanisms underlying these cardiac alterations are not well understood. We hypothesized that changes in gene expression could help to delineate such mechanisms. The current study used a neonatal mouse model in CCH or CIH combined with cDNA microarrays to determine changes in gene expression in the CCH or CIH mouse heart. Both CCH and CIH induced substantial alterations in gene expression. In addition, a robust right ventricular hypertrophy and cardiac enlargement was found in CCH- but not in CIH-treated mouse heart. On one hand, upregulation in RNA and protein levels of eukaryotic translation initiation factor-2α and -4E (eIF-2α and eIF-4E) was found in CCH, whereas eIF-4E was downregulated in 1- and 2-wk CIH, suggesting that eIF-4E is likely to play an important role in the cardiac hypertrophy observed in CCH-treated mice. On the other hand, the specific downregulation of heart development-related genes (e.g., notch gene homolog-1, MAD homolog-4) and the upregulation of proteolysis genes (e.g., calpain-5) in the CIH heart can explain the lack of hypertrophy in CIH. Interestingly, apoptosis was enhanced in CCH but not CIH, and this was correlated with an upregulation of proapoptotic genes and downregulation of anti-apoptotic genes in CCH. In summary, our results indicate that 1) the pattern of gene response to CCH is different from that of CIH in mouse heart, and 2) the identified expression differences in certain gene groups are helpful in dissecting mechanisms responsible for phenotypes observed.
Keywords: patterns of hypoxia, cardiac hypertrophy, cDNA microarray, apoptosis, initiation factors
a variety of experimental and clinical studies have demonstrated that chronic hypoxia, whether constant (CCH) or intermittent (CIH), has major effects on heart structure and function (8, 21). Although CCH from pulmonary disease, congenital heart disease, or high altitude is not an infrequent clinical occurrence, the molecular mechanisms that lead to cardiac injury or adaptation are not fully established. For instance, it has not been very clear which molecular mechanism(s) induces cardiac hypertrophy during chronic hypoxia. Furthermore, different tissue responses have been found in patients suffering from intermittent compared with sustained blood gas disturbances. For example, systemic hypertension is more frequently seen in patients with sleep apnea than in patients with chronic obstructive pulmonary diseases (21). These differences between intermittent and sustained blood gas disturbances, such as hypoxia, have not been studied in detail and, indeed, have been limited to phenotypic descriptions.
Technologies like microarrays have not yet been used to study differences between CCH and CIH in heart. Because 1) there has been a paucity of studies on the effect of chronic hypoxia on heart in early life, which may be different from that in the adult, and 2) it is possible that CCH and CIH have a different impact on the heart, we performed transcriptomic analyses and compared differences in gene expression between these two types of hypoxia using the neonatal mouse.
MATERIALS AND METHODS
Hypoxia treatment
CD1 mice (Charles River) were placed in a hypoxia chamber (Biospherix) with their mother starting on the second day after birth (P2) for 1, 2, or 4 wk. In CCH experiments, an O2 concentration of 11% was applied continuously. In CIH, we alternated O2 concentration between 21% for 4 min and 11% for another 4 min. The cycling was continuous for 24 h/day for the period desired. At the end of each period, mice were anesthetized by inhalation of isoflurane (Baxter Pharmaceutical Products). The hearts were removed and quickly frozen in liquid nitrogen. Parameters such as body weight, organ weight, and hematocrit were collected. The surgical procedures and protocols were approved by the Albert Einstein College of Medicine (AECOM) Animal Care and Use Committee.
Histology
A total of nine hearts (3 hearts/group) from animals exposed to CCH, CIH, or room air for 4 wk were obtained for histological examination. Fresh hearts were fixed in 4% paraformaldehyde overnight and transferred to 75% ethanol with double-distilled H2O for paraffin embedding. The sections were stained with hematoxylin and eosin. The sizes of cardiomyocytes were measured as transverse areas (μm2) of the cells in at least 10 fields of sections (×400 magnitude) using the image AxioVision 4.1 software (Zeiss, Thornwood, NY).
Microarrays
Arrays were hybridized with cDNA from four individual animals at each age (1, 2, or 4 wk) and treatment (CCH, CIH, or normoxia), as shown in Supplemental Fig. S1A (available at the Physiological Genomics web site).1 The slides (28,704 spots, representing 7,455 distinct genes with known protein products in http://genome-www5.stanford.edu/cgi-bin/source//sourceBatchSearch, with several spotted sequences probing the same gene), 11,686 expressed sequence tags (ESTs) whose annotation was incomplete at the date of the study (eliminated from the expression analysis), and 192 bacterial sequences for quality control of the arrays were obtained from the Microarray Facility of AECOM. The hybridization process was performed according to the instructions of the core facility. Briefly, total RNA (60 μg), extracted with TRIzol (Invitrogen), was used to synthesize a fluorescently labeled cDNA probe by direct incorporation with either Cy3 or Cy5 fluorescent dye (Amersham Biosciences) in separate reactions. Fluorescent cDNA probes were prehybridized with blocking solution for 1 h before being applied to pretreated and prehybridized microarray slides. Hybridization was done in GeneMachines HybChamber and incubated overnight at 50°C. After incubation, each slide was washed to remove unbound cDNAs and SDS, dried, and scanned with a GenePix 4100A scanner (Axon Instruments) at 600 V (635 nm) and 550 V (532 nm).
We adopted an experimental strategy (experimental design and flow chart in Supplemental Fig. S1A) similar to that used in previous studies (3). This strategy was termed “multiple yellow” (MYS), since most spots on the hybridized slide should appear yellow in an 8-bit pseudocolor image (example in Supplemental Fig. S1B). As presented in the discussion section and in the Supplemental Material, MYS provides a similar detection accuracy of the regulated genes compared with the widely used dye swapping (DSS) and reference sample (RSS) strategies (16) but has a considerable advantage in cost and flexibility. Each slide was hybridized with heart cDNA obtained from a male mouse (labeled with Cy5) and a female mouse (labeled with Cy3), both of which were subjected to the same treatment for the same period of time. Thus all comparisons between hypoxia and normoxia used animals of the same gender composition.
Images were acquired and primarily analyzed with GenePix Pro 4.1 software. The background-subtracted signals were normalized with an in-house developed iterative algorithm similar to those used in previous publications (12, 13), alternating within-array normalization and interarray normalization until the average-corrected ratio differed by <5% from the previous one (14). Individual measurements of genes for all 12 mice studied in each period (1, 2, or 4 wk) were further divided by the average of the corresponding normoxic values, and then the results for each group of four mice (i.e., normoxic, CCH, and CIH) were rescaled with respect to the average of that group. The ratios obtained by proportioning the normalized green and red fluorescence intensities of a spot with hypoxic cDNAs to the normalized green and red fluorescence intensities of a matched spot with corresponding normoxic cDNAs were averaged for both channels. In the case of a gene probed in multiple spots, the expression ratio was the weighted average ratios, as previously described (12). Detection of significantly regulated genes relied on both fold changes in expression ratio (limited by the technical noise of the method and expression variability among animals) and the statistical significance of the two-tailed t-test with a Bonferroni-type adjustment applied to the redundancy groups (14). The data set (series no. GSE2271) was deposited in the Gene Expression Omnibus (GEO) database: http://www.ncbi.nlm.nih.gov/geo/. Profiling of the data was accomplished using hierarchical clustering algorithm, with the software available from http://rana.lbl.gov/index.htm.
Quantitative real-time RT-PCR
The two-step quantitative real-time RT-PCR (QRT-PCR) SYBR Green method (Applied Biosystems) was used to compare and confirm the levels of selected interesting genes. Primers were devised with the software Primer 3 and synthesized at Invitrogen. The cDNA synthesis and QRT-PCR were done according to previously described methods (29). Relative ratios of fluorescent intensities of products from hypoxia to normoxia were calculated by using the 2−ΔΔCt method, where Ct is cycle threshold (17), and β-actin amplicons were used as loading control. Specific primers are listed in Supplemental Table S5.
Western blotting
Total protein was prepared using buffer as previously described (1). The concentration of protein lysates was determined with the bicinchoninic acid protein assay kit. Protein samples (20 μg) were isolated through SDS-PAGE electrophoresis using 10% Novex Bis-Tris gel and then electrophoretically transferred to a polyvinylidene difluoride membrane. Nonspecific binding sites were blocked, and the membranes were incubated overnight at 4°C with primary antibodies [eukaryotic translation initiation factor (eIF)-4E and eIF-4E (Ser209) from Cell Signaling, eIF-2α and eIF-2α (Ser52) from Abcam, and internal control Hsc70 from Stressgen]. The signals were visualized by incubating with horseradish peroxidase (HRP)-conjugated secondary antibody followed by enhanced chemiluminescence. Band densities were quantified using the Personal Densitometer SI scanner (Molecular Dynamics, Sunnyvale, CA) and analyzed with the aid of ImageQuaNT image analysis software (Molecular Dynamics).
Apoptosis detection
In situ terminal deoxynucleotide transferase-mediated dUTP nick-end labeling (TUNEL) assay (Roche Applied Science) was used to detect apoptotic nuclei and quantified as percentage of apoptotic nuclei per total nuclei. Sections were first deparaffinized and rehydrated, and then the manufacture’s instructions were followed. Briefly, sections were stripped of protein by incubation with pepsin (0.25%, pH 2.0) for 15–20 min at 37°C. For positive control, a section of normoxic control heart was treated with DNase I to produce artificially fragmented nuclear DNA. Samples were incubated with TUNEL reaction mix for 60 min at 37°C in a dark, humidified chamber. Total nuclei were counterstained with DAPI. Samples were first observed under a fluorescence microscope, then treated with anti-fluorescein antibody conjugated with alkaline phosphatase (AP), and observed under a light microscope. Nuclei were counted using the software AxioVision 4.1. Results are expressed as mean values ± SD. Differences in means were considered statistically significant if P < 0.05, using unpaired Student’s t-test.
RESULTS
Weights, hematocrits, and light microscopy of heart
CCH and CIH animals had a lower body weight than controls at 1 and 2 wk after initiation of hypoxia, but a catch-up in body growth was found at ~4 wk of age in CCH mice (Fig. 1A). Heart weight and size increased significantly in CCH animals but remained unchanged in CIH compared with normoxic controls (Fig. 1B and Fig. 2A). This increased heart weight in CCH mice was significant after 1 wk in hypoxia, and this difference continued to be pronounced at 2 and 4 wk of age (Fig. 1B). A similar pattern was also detected in total protein/heart in CCH mice but not CIH mice (Fig. 2F). The ratio of heart weight to body weight increased in both CCH and CIH, but the difference from control was greater in CCH (Fig. 1C). Hematocrit increased in both CCH and CIH, but the difference was more significant in CCH at all ages (Fig. 1D).
Fig. 1.
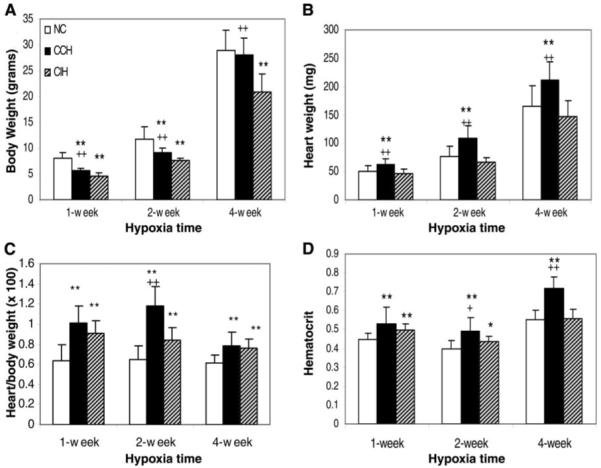
Changes in body weight, heart weight, and hematocrit in mice with chronic constant hypoxia (CCH) and chronic intermittent hypoxia (CIH). A: growth of mice was decreased in both CCH (n = 8/treatment) and CIH (n = 8/treatment) compared with normoxic control (NC; n = 16/age-matched group), but there was a catch-up growth in CCH treatment for 4 wk. B: heart weight was much higher in CCH, but CIH mice were similar to NC mice. C and D: ratios of heart weight to body weight and hematocrit increased in CCH and CIH but more so in CCH. Statistical significance was calculated by Student’s t-test. Values are means ± SD. *P < 0.05 and **P < 0.01, CCH or CIH compared with NC. +P < 0.05 and ++P < 0.01, CCH compared with CIH.
Fig. 2.
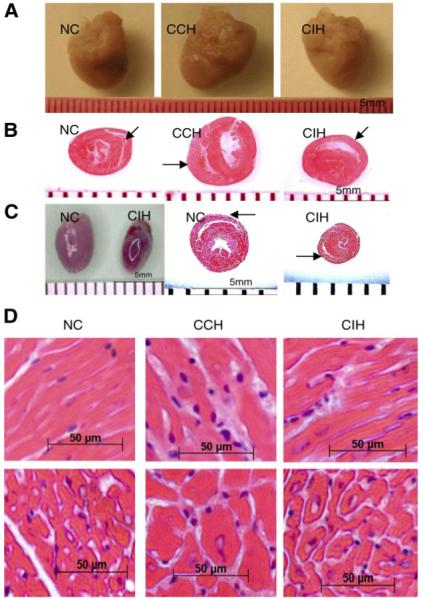
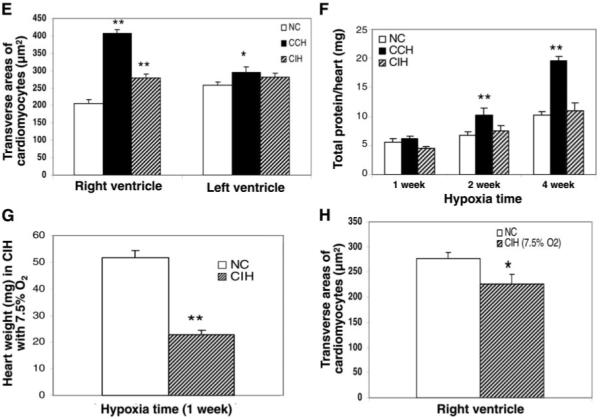
Effect of chronic hypoxia treatment on heart size/weight and cardiomyocyte size in mice. A: representative images show larger heart size in CCH compared with age-matched NC. B: coronal midline sections show the apparently thicker right ventricular wall in CCH but little change in CIH (arrows) compared with age-matched NC. C: in CIH with a 7.5% O2 level as the nadir in each cycle, heart size became even smaller after 1 wk of hypoxia exposure compared with age-matched NC (death occurred in prolonged hypoxia period). D: light microscopy (×400) shows markedly thicker right ventricular muscle fibers in CCH but not CIH and broader interstitium with leukocyte infiltration in both CCH and CIH. E: in transverse section of cardiomyocytes, the cell size (mean ± SE) in the right ventricle was robustly thicker in CCH (P < 0.05) and thicker, but to a much lesser extent, in CIH compared with NC. F: total protein/heart changes over time under NC, CCH, and CIH. Neonatal P2 mice (2nd day after birth) were weighed, and mice of similar weight were separated into 3 groups and treated under NC, CCH, or CIH. Hearts were obtained after 1, 2, and 4 wk of hypoxia, and total proteins were measured in individual hearts (n = 4). Hearts of mice treated with CCH contained much more protein compared with NC and CIH hearts at the same time points. G and H: heart weight (n = 8) was lower in CIH than in NC when 7.5% O2 rather than 11% O2 was applied. The size of cardiomyocytes in the transverse section was smaller than in NC after 1 wk of hypoxia exposure. Values are means ± SD. *P < 0.05 and **P < 0.01, CCH or CIH compared with NC.
The midline sections of the heart had thicker free wall of the right ventricle in CCH and CIH animals compared with controls, and this difference was more apparent in CCH mice (Fig. 2B). Right ventricular muscle fibers in CCH hearts were larger than those in controls or CIH, based on data obtained from transverse sections of cardiomyocytes (Fig. 2, D and E). The cardiomyocytes from the left ventricles in CCH also became larger than in controls, but there was no difference in cell size between left ventricles in CIH and the controls (Fig. 2E). To further study the influence of CIH on cardiac hypertrophy and size, we decreased the O2 concentration from 11 to 7.5% to induce a severer stress. Contrary to our expectation, heart size became much smaller than in controls (Fig. 2C), and right ventricular hypertrophy was not observed (Fig. 2, G and H). Another interesting feature in the muscle histopathology is that the interstitium became broader with leukocyte infiltration in both CCH and CIH (Fig. 2D).
Overview of gene expression using cDNA microarray
Our results showed that a substantial number of genes have altered their expression in the hearts of both CCH- and CIH-treated mice. Both individual variability and reproducibility of gene expression pattern of mice subjected to the same treatment are illustrated in Fig. 4A, Supplemental Table S6, and Supplemental Fig. S4. We found that a total of 549 genes were upregulated and 375 genes downregulated in CCH heart (Fig. 3A). A substantial number of genes were also altered in CIH, but the majority were downregulated: 294 genes upregulated and 440 genes downregulated (Fig. 3B). At 1, 2, and 4 wk with CCH, there were 272, 856, and 294 upregulated genes and 110, 613, and 303 downregulated genes, respectively. Likewise, with CIH there were 375, 440, and 150 upregulated and 440, 795, and 68 downregulated genes at these same time points. Remarkably, in both treatments, the largest number of altered genes was after 2 wk of exposure to hypoxia. Genes that altered their expression at all three time points are listed in Supplemental Tables S1 and S2.
Fig. 4.

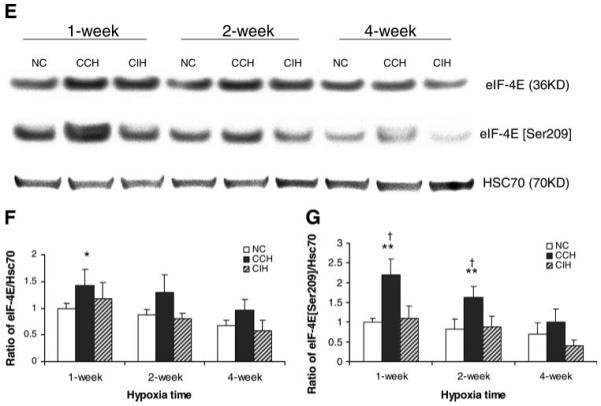
Alteration in gene expression and protein level of eukaryotic translation initiation factors (eIFs) after chronic hypoxia treatment. A: profiles of gene expression and regulation of eIFs in 4 individual mice subjected to normoxia (N1–N4), CCH (C1–C4), and CIH (I1–I4) for 1, 2, or 4 wk. Each value is represented by a colored square. Duration of the treatment is indicated before the letter of treatment, (e.g., 1I2 = 1 wk CIH, 2nd mouse), while the green/red color of the square shows down/upregulation, with brighter colors for higher regulation. Note both the variability and the reproducible pattern among the mice subjected to the same treatment. Note also the darker colors of the normoxic values, since they were closer to the average used in normalization. B: Western blot analysis of eIF-2α and phosphorylated eIF-2α (Ser52) in CCH, CIH, and age-matched NC. Results were reproduced in 3 independent experiments and averaged. C and D: statistical analysis (t-test) of densitometric analyses of Western results of eIF-2α and phosphorylated eIF-2α (Ser52). The y-axis depicts the relative protein expression level as a ratio of the protein to its HSC70 density per 40 μg of total protein. Values are means ± SD (n = 3). E: Western blot analysis of eIF-4E and phosphorylated eIF-4E (Ser209) in CCH, CIH, and age-matched NC. F and G: statistical analysis (t-test) of densitometric analyses of Western results of eIF-4E and phosphorylated eIF-4E (Ser209). *P < 0.05 compared with normoxic control. **P < 0.01 compared with normoxic control. †P < 0.01 compared with CIH.
Fig. 3.

A and B: profiles of gene expression in mouse heart subjected to CCH or CIH. More genes were upregulated in CCH, and more genes were downregulated in CIH. C and D: results of microarray and quantitative RT-PCR are consistent for 8 selected genes from mouse hearts at 2 wk after CCH or CIH treatment. Bnip3l, Slc6a8, and Slc12a2 were all upregulated in CCH and CIH. Note the opposite alterations of Madh4 and Solh in CCH- and CIH-treated hearts. E: percent differences between the fold change in male and female mice subjected for 1 wk to CIH plotted against the significant regulation ratios I1/N1 (negative values for downregulation) of the entire set of 4 mice. Note that no difference exceeds 50% of the average fold change for the entire set of 4 mice (meaning that both genders were regulated in the same sense), most of the differences do not exceed 25% (no statistically significant difference between the fold change in the 2 genders), and the approximate symmetry of the differences i.e., the no. of genes with a higher fold change in males than in females (points above the horizontal axis) is close to the no. of genes with a higher regulation in females than in males (points below the horizontal axis) for both types of regulations (upregulations in the positive side of the horizontal axis and downregulations in the negative one).
We first categorized the altered genes based on magnitude of change and found that most differentially expressed genes changed approximately two- to threefold (Fig. 3, A and B). However, in CCH, there were 6 genes that were highly upregulated and 21 genes that were highly downregulated, i.e., over fivefold. Similarly, in CIH, there were 20 upregulated and 6 downregulated genes, over fivefold (Supplemental Tables S3 and S4). To characterize the major influence on biological processes after CCH or CIH treatment, we used MAPPFinder (a component of GenMAPP version 2.0) (2, 5, 6). MAPPFinder produced a statistically ranked list (based on P value) of Gene Ontology (GO) categories associated with each treatment from which the significant categories are listed. In each treatment, several highly significant, nonsynonymous, biological process categories were identified and are listed in Table 1 (permutation P < 0.05). Most of the significantly altered gene clusters were related to signal transduction and metabolism. The gene cluster related to regulation of translational initiation was found to be significant when comparing CCH- with CIH-treated animals throughout all time points (Table 2).
Table 1. Summary of changes and significance levels for specific GO biological process categories after different periods of CCH and CIH treatments.
| GO ID | GO Name | No. Changed |
No. Measured |
No. in GO | Percent Changed |
P Value |
|---|---|---|---|---|---|---|
| CCH 1 wk | ||||||
| 15031 | protein transport | 35 | 159 | 325 | 22.01 | 0.000 |
| 51179 | localization | 77 | 438 | 1,444 | 17.58 | 0.000 |
| 6810 | transport | 74 | 432 | 1,431 | 17.13 | 0.000 |
| 7264 | small GTPase-mediated signal transduction | 17 | 69 | 180 | 24.64 | 0.003 |
| 7242 | intracellular signaling cascade | 38 | 217 | 623 | 17.51 | 0.005 |
| 51051 | negative regulation of transport | 2 | 2 | 6 | 100.00 | 0.007 |
| 7265 | Ras protein signal transduction | 4 | 8 | 18 | 50.00 | 0.011 |
| 188 | inactivation of MAPK | 3 | 5 | 7 | 60.00 | 0.013 |
| 7010 | cytoskeleton organization and biogenesis | 16 | 77 | 192 | 20.78 | 0.019 |
| 15758 | glucose transport | 2 | 3 | 13 | 66.67 | 0.028 |
| 51248 | negative regulation of protein metabolism | 4 | 11 | 33 | 36.36 | 0.034 |
| 165 | MAPKKK cascade | 5 | 16 | 55 | 31.25 | 0.034 |
| 6820 | anion transport | 9 | 38 | 138 | 23.68 | 0.036 |
| 43161 | proteasomal ubiquitin-dependent protein catabolism | 2 | 3 | 5 | 66.67 | 0.043 |
| 6515 | misfolded or incompletely synthesized protein catabolism | 2 | 3 | 5 | 66.67 | 0.043 |
| 30433 | ER-associated protein catabolism | 2 | 3 | 5 | 66.67 | 0.043 |
| CCH 2 wk | ||||||
| 51246 | regulation of protein metabolism | 28 | 42 | 115 | 66.67 | 0.003 |
| 46907 | intracellular transport | 80 | 144 | 304 | 55.56 | 0.004 |
| 6809 | nitric oxide biosynthesis | 5 | 5 | 7 | 100.00 | 0.016 |
| 9891 | positive regulation of biosynthesis | 5 | 5 | 29 | 100.00 | 0.017 |
| 9889 | regulation of biosynthesis | 19 | 29 | 81 | 65.52 | 0.017 |
| 6457 | protein folding | 38 | 67 | 140 | 56.72 | 0.022 |
| 6417 | regulation of protein biosynthesis | 17 | 26 | 77 | 65.38 | 0.024 |
| 188 | inactivation of MAPK | 5 | 5 | 7 | 100.00 | 0.025 |
| 50808 | synapse organization and biogenesis | 4 | 4 | 15 | 100.00 | 0.026 |
| 46483 | heterocycle metabolism | 11 | 15 | 44 | 73.33 | 0.029 |
| 6986 | response to unfolded protein | 11 | 15 | 30 | 73.33 | 0.037 |
| 7169 | transmembrane receptor protein tyrosine kinase signaling pathway |
12 | 17 | 76 | 70.59 | 0.037 |
| 6605 | protein targeting | 27 | 45 | 94 | 60.00 | 0.037 |
| 42278 | purine nucleoside metabolism | 4 | 4 | 4 | 100.00 | 0.038 |
| 6836 | neurotransmitter transport | 6 | 7 | 27 | 85.71 | 0.041 |
| 8104 | protein localization | 87 | 168 | 342 | 51.79 | 0.041 |
| 6357 | regulation of transcription from RNA polymerase II promoter | 25 | 42 | 119 | 59.52 | 0.041 |
| 7017 | microtubule-based process | 20 | 33 | 74 | 60.61 | 0.042 |
| 18108 | peptidyl-tyrosine phosphorylation | 7 | 9 | 20 | 77.78 | 0.043 |
| 17015 | regulation of transforming growth factor beta receptor signaling pathway |
4 | 4 | 5 | 100.00 | 0.047 |
| 9893 | positive regulation of metabolism | 25 | 42 | 104 | 59.52 | 0.047 |
| CCH 4 wk | ||||||
| 6082 | organic acid metabolism | 29 | 89 | 260 | 32.58 | 0.001 |
| 19752 | carboxylic acid metabolism | 28 | 88 | 258 | 31.82 | 0.002 |
| 43174 | nucleoside salvage | 3 | 3 | 3 | 100.00 | 0.004 |
| 43101 | purine salvage | 3 | 3 | 3 | 100.00 | 0.004 |
| 6631 | fatty acid metabolism | 12 | 35 | 91 | 34.29 | 0.016 |
| 35050 | embryonic heart tube development | 2 | 2 | 5 | 100.00 | 0.029 |
| 6420 | arginyl-tRNA aminoacylation | 2 | 2 | 3 | 100.00 | 0.030 |
| 6519 | amino acid and derivative metabolism | 16 | 53 | 174 | 30.19 | 0.031 |
| 30042 | actin filament depolymerization | 2 | 2 | 3 | 100.00 | 0.033 |
| 51016 | barbed-end actin filament capping | 2 | 2 | 3 | 100.00 | 0.033 |
| 30835 | negative regulation of actin filament depolymerization | 2 | 2 | 3 | 100.00 | 0.033 |
| 9966 | regulation of signal transduction | 10 | 29 | 81 | 34.48 | 0.036 |
| 19058 | viral infectious cycle | 2 | 2 | 6 | 100.00 | 0.038 |
| 9308 | amine metabolism | 17 | 59 | 193 | 28.81 | 0.040 |
| 6471 | protein amino acid ADP ribosylation | 3 | 5 | 15 | 60.00 | 0.043 |
| 51050 | positive regulation of transport | 3 | 5 | 23 | 60.00 | 0.046 |
| CIH 1 wk | ||||||
| 51187 | cofactor catabolism | 8 | 11 | 19 | 72.73 | 0.001 |
| 6412 | protein biosynthesis | 58 | 164 | 389 | 35.37 | 0.004 |
| 6099 | tricarboxylic acid cycle | 6 | 9 | 14 | 66.67 | 0.011 |
| 9060 | aerobic respiration | 6 | 9 | 14 | 66.67 | 0.011 |
| 188 | inactivation of MAPK | 4 | 5 | 7 | 80.00 | 0.014 |
| 7088 | regulation of mitosis | 3 | 3 | 12 | 100.00 | 0.020 |
| 19538 | protein metabolism | 199 | 712 | 2,007 | 27.95 | 0.022 |
| 45333 | cellular respiration | 6 | 10 | 19 | 60.00 | 0.023 |
| 6461 | protein complex assembly | 9 | 19 | 104 | 47.37 | 0.025 |
| 6084 | acetyl-CoA metabolism | 7 | 13 | 21 | 53.85 | 0.030 |
| 6874 | calcium ion homeostasis | 4 | 6 | 20 | 66.67 | 0.035 |
| 6650 | glycerophospholipid metabolism | 4 | 6 | 17 | 66.67 | 0.037 |
| 6820 | anion transport | 15 | 38 | 138 | 39.47 | 0.042 |
| 42278 | purine nucleoside metabolism | 3 | 4 | 4 | 75.00 | 0.044 |
| 44272 | sulfur compound biosynthesis | 3 | 4 | 17 | 75.00 | 0.049 |
| CIH 2 wk | ||||||
| 7001 | chromosome organization and biogenesis (sensu Eukaryota) | 30 | 50 | 172 | 60.00 | 0.001 |
| 16571 | histone methylation | 5 | 5 | 6 | 100.00 | 0.006 |
| 6886 | intracellular protein transport | 53 | 108 | 209 | 49.07 | 0.009 |
| 7229 | integrin-mediated signaling pathway | 10 | 14 | 43 | 71.43 | 0.014 |
| 51093 | negative regulation of development | 9 | 13 | 41 | 69.23 | 0.023 |
| 6928 | cell motility | 22 | 41 | 124 | 53.66 | 0.029 |
| 7411 | axon guidance | 6 | 8 | 38 | 75.00 | 0.034 |
| 8277 | regulation of G protein-coupled receptor protein signaling pathway |
3 | 3 | 13 | 100.00 | 0.035 |
| 16477 | cell migration | 18 | 33 | 101 | 54.55 | 0.037 |
| 6334 | nucleosome assembly | 6 | 8 | 72 | 75.00 | 0.042 |
| 19884 | antigen presentation, exogenous antigen | 3 | 3 | 14 | 100.00 | 0.048 |
| 9142 | nucleoside triphosphate biosynthesis | 13 | 22 | 47 | 59.09 | 0.048 |
| 9108 | coenzyme biosynthesis | 15 | 27 | 65 | 55.56 | 0.048 |
| 6461 | protein complex assembly | 11 | 19 | 104 | 57.89 | 0.048 |
| 6355 | regulation of transcription, DNA dependent | 124 | 296 | 1199 | 41.89 | 0.049 |
| CIH 4 wk | ||||||
| 187 | activation of MAPK | 3 | 4 | 14 | 75.00 | 0.000 |
| 43149 | stress fiber formation | 2 | 2 | 3 | 100.00 | 0.001 |
| 45859 | regulation of protein kinase activity | 5 | 14 | 43 | 35.71 | 0.002 |
| 6915 | apoptosis | 15 | 110 | 295 | 13.63 | 0.004 |
| 46822 | regulation of nucleocytoplasmic transport | 2 | 2 | 10 | 100.00 | 0.005 |
| 6637 | acyl-CoA metabolism | 2 | 2 | 6 | 100.00 | 0.006 |
| 48511 | rhythmic process | 3 | 8 | 35 | 37.50 | 0.008 |
| 74 | regulation of cell cycle | 10 | 60 | 177 | 16.67 | 0.009 |
| 51246 | regulation of protein metabolism | 8 | 42 | 115 | 19.05 | 0.010 |
| 16043 | cell organization and biogenesis | 22 | 200 | 562 | 11.00 | 0.013 |
| 6605 | protein targeting | 7 | 45 | 94 | 15.56 | 0.029 |
| 19222 | regulation of metabolism | 34 | 367 | 1,374 | 9.26 | 0.036 |
| 6888 | ER to Golgi transport | 2 | 5 | 11 | 40.00 | 0.039 |
| 6417 | regulation of protein biosynthesis | 5 | 26 | 77 | 19.23 | 0.041 |
| 8283 | cell proliferation | 7 | 47 | 173 | 14.89 | 0.043 |
| 8361 | regulation of cell size | 5 | 30 | 71 | 16.67 | 0.043 |
| 6820 | anion transport | 6 | 38 | 138 | 15.79 | 0.044 |
| 7519 | myogenesis | 2 | 6 | 21 | 33.33 | 0.046 |
| 43037 | translation | 7 | 48 | 100 | 14.58 | 0.049 |
GO, Gene Ontology; CCH, chronic constant hypoxia; CIH, chronic intermittent hypoxia.
Table 2. Summary of differences and significance levels for specific GO biological process categories between CCH- and CIH-treated animals.
| GO ID | GO Name | No. Changed |
No. Measured |
No. in GO | Percent Changed |
P Value |
|---|---|---|---|---|---|---|
| CCH vs. CIH 1 wk | ||||||
| 9116 | nucleoside metabolism | 7 | 10 | 21 | 70.00 | 0.015 |
| 19883 | antigen presentation, endogenous antigen | 5 | 6 | 14 | 83.33 | 0.016 |
| 42325 | regulation of phosphorylation | 5 | 6 | 20 | 83.33 | 0.017 |
| 6811 | ion transport | 48 | 112 | 522 | 42.86 | 0.023 |
| 9893 | positive regulation of metabolism | 21 | 42 | 104 | 50.00 | 0.025 |
| 9081 | branched chain family amino acid metabolism | 3 | 3 | 6 | 100.00 | 0.029 |
| 6446 | regulation of translational initiation | 5 | 7 | 10 | 71.43 | 0.030 |
| 30199 | collagen fibril organization | 3 | 3 | 4 | 100.00 | 0.031 |
| 6968 | cellular defense response | 4 | 5 | 38 | 80.00 | 0.032 |
| 6732 | coenzyme metabolism | 24 | 50 | 110 | 48.00 | 0.033 |
| 19885 | antigen processing, endogenous antigen via MHC class I | 5 | 7 | 13 | 71.43 | 0.037 |
| 6521 | regulation of amino acid metabolism | 4 | 5 | 17 | 80.00 | 0.037 |
| 6235 | dTTP biosynthesis | 3 | 3 | 4 | 100.00 | 0.039 |
| 9212 | pyrimidine deoxyribonucleoside triphosphate biosynthesis | 3 | 3 | 4 | 100.00 | 0.039 |
| 19882 | antigen presentation | 6 | 9 | 29 | 66.67 | 0.040 |
| 46777 | autophosphorylation | 4 | 5 | 15 | 80.00 | 0.041 |
| 18108 | peptidyl-tyrosine phosphorylation | 6 | 9 | 20 | 66.67 | 0.047 |
| 9891 | positive regulation of biosynthesis | 4 | 5 | 29 | 80.00 | 0.047 |
| 9889 | regulation of biosynthesis | 15 | 29 | 81 | 51.72 | 0.047 |
| 51246 | regulation of protein metabolism | 20 | 42 | 115 | 47.62 | 0.049 |
| CCH vs. CIH 2 wk | ||||||
| 46907 | intracellular transport | 102 | 144 | 304 | 70.83 | 0.000 |
| 6886 | intracellular protein transport | 75 | 108 | 209 | 69.44 | 0.007 |
| 6413 | translational initiation | 18 | 21 | 35 | 85.71 | 0.007 |
| 82 | G1/S transition of mitotic cell cycle | 7 | 7 | 21 | 100.00 | 0.015 |
| 19538 | protein metabolism | 431 | 712 | 2,007 | 60.53 | 0.019 |
| 51258 | protein polymerization | 13 | 15 | 27 | 86.67 | 0.020 |
| 6796 | phosphate metabolism | 134 | 209 | 564 | 64.11 | 0.021 |
| 19226 | transmission of nerve impulse | 15 | 18 | 124 | 83.33 | 0.022 |
| 7049 | cell cycle | 84 | 127 | 341 | 66.14 | 0.024 |
| 51246 | regulation of protein metabolism | 31 | 42 | 115 | 73.81 | 0.025 |
| 6446 | regulation of translational initiation | 7 | 7 | 10 | 100.00 | 0.026 |
| 6259 | DNA metabolism | 82 | 124 | 359 | 66.13 | 0.027 |
| 51169 | nuclear transport | 20 | 26 | 64 | 76.92 | 0.036 |
| 7017 | microtubule-based process | 25 | 33 | 74 | 75.76 | 0.038 |
| CCH vs. CIH 4 wk | ||||||
| 6406 | mRNA nucleus export | 6 | 7 | 12 | 85.71 | 0.000 |
| 16070 | RNA metabolism | 31 | 88 | 210 | 35.23 | 0.002 |
| 6396 | RNA processing | 26 | 69 | 162 | 37.68 | 0.003 |
| 6605 | protein targeting | 18 | 45 | 94 | 40.00 | 0.007 |
| 8154 | actin polymerization and/or depolymerization | 6 | 9 | 12 | 66.67 | 0.008 |
| 8380 | RNA splicing | 12 | 26 | 62 | 46.15 | 0.008 |
| 16071 | mRNA metabolism | 18 | 48 | 93 | 37.50 | 0.010 |
| 6836 | neurotransmitter transport | 5 | 7 | 27 | 71.43 | 0.011 |
| 42591 | antigen presentation, exogenous antigen via MHC class II | 3 | 3 | 10 | 100.00 | 0.012 |
| 16485 | protein processing | 4 | 5 | 21 | 80.00 | 0.012 |
| 9725 | response to hormone stimulus | 4 | 6 | 7 | 66.67 | 0.017 |
| 51248 | negative regulation of protein metabolism | 6 | 11 | 33 | 54.55 | 0.018 |
| 9892 | negative regulation of metabolism | 17 | 46 | 139 | 36.96 | 0.020 |
| 279 | M phase | 16 | 44 | 103 | 36.36 | 0.036 |
| 42742 | defense response to bacteria | 3 | 4 | 31 | 75.00 | 0.037 |
| 6941 | striated muscle contraction | 2 | 2 | 6 | 100.00 | 0.042 |
| 42326 | negative regulation of phosphorylation | 2 | 2 | 3 | 100.00 | 0.043 |
| 19222 | regulation of metabolism | 98 | 367 | 1,374 | 26.70 | 0.046 |
| 31324 | negative regulation of cellular metabolism | 15 | 42 | 126 | 35.71 | 0.046 |
| 6939 | smooth muscle contraction | 4 | 7 | 14 | 57.14 | 0.047 |
| 42158 | lipoprotein biosynthesis | 2 | 2 | 9 | 100.00 | 0.048 |
| 6446 | regulation of translational initiation | 4 | 7 | 10 | 57.14 | 0.048 |
| 7260 | tyrosine phosphorylation of STAT protein | 2 | 2 | 6 | 100.00 | 0.049 |
Eight interesting genes were chosen from different functional categories in CCH or CIH for further quantitative real-time PCR analysis (Fig. 3, C and D). The PCR reactions for each of these genes were repeated at least three times using 2-wk-treated samples. Variation in the number of Ct for a gene was <1. Results of QRT-PCR for the selected genes were consistent with the microarray data.
The experimental design allowed us to compare gene expression in the two genders. Fig. 3E presents the fold-change difference between male and female mice subjected to 1 wk of CIH in the entire set of four mice. We found no difference in the type of regulation between the two genders (all differences <50% fold change) and no significant bias of fold change toward one gender or another (symmetrical distribution of differences).
Similarities in gene expression between CCH and CIH
During chronic hypoxia, whether CCH or CIH, some of the regulated genes responded qualitatively in a similar fashion in the heart (Table 3). These included stress-responding genes (e.g., heat shock and redox genes), genes involved in vascular dilation, angiogenesis, and heme biosynthesis. For example, the gene that encodes a thioredoxin-interacting protein inhibits the function of thioredoxin; therefore, downregulation of this gene by 2.3-fold in CCH and 1.6-fold in CIH suggests enhancement of antioxidant function. A recent report has shown that a downregulation of this gene is involved in cardiac hypertrophy (28). The gene EGL nine homolog 1, which is involved in the degradation of the protein of hypoxia-inducible factor (HIF), was upregulated by 5-fold in CCH and 2.4-fold in CIH, whereas EGL nine homolog 3 was downregulated by 1.7-fold in CCH and 1.8-fold in CIH (7).
Table 3. Examples of similarly regulated genes in CCH and CIH hearts.
| Gene Name | 1I/N | 1C/N | 2I/N | 2C/N | 4I/N | 4C/N | P(1I/N) | P(1C/N) | P(2I/N) | P(2C/N) | P(4I/N) | P(4C/N) | P(C1/I) | P(C2/I) | P(C4/I) |
|---|---|---|---|---|---|---|---|---|---|---|---|---|---|---|---|
| Acetyl-CoA acetyltransferase 1 | 1.62 | 1.90 | 1.83 | 1.56 | 0.008 | 0.002 | 0.001 | 0.000 | 0.002 | ||||||
| Adrenergic receptor kinase, beta 1 |
−2.77 | −2.21 | 1.85 | 1.81 | −1.60 | −1.85 | 0.000 | 0.000 | 0.000 | 0.000 | 0.000 | 0.000 | 0.000 | ||
| Alpha tetoprotein | −1.87 | −1.71 | 1.82 | 2.19 | 0.000 | 0.000 | 0.000 | 0.000 | |||||||
| Amyotrophic lateral sclerosls 2 (juvenile) chromosome region, candidate 2 homolog (human) |
1.91 | 1.78 | −1.89 | −2.10 | 0.000 | 0.001 | 0.000 | 0.000 | 0.001 | ||||||
| Ankyrin repeat domain 6 | −2.03 | −2.17 | 0.000 | 0.000 | |||||||||||
| Apolipoprotein C-II | −1.57 | −2.03 | 0.004 | 0.000 | |||||||||||
| Aryl-hydrocarbon receptor- interacting protein |
−1.66 | −2.04 | 1.69 | 2.45 | 0.007 | 0.002 | 0.000 | 0.000 | 0.002 | 0.000 | |||||
| BCL2/adenovirus E1B 19kDa- interacting protein 3-like |
2.45 | 3.66 | 1.70 | 2.17 | 0.000 | 0.000 | 0.001 | 0.005 | 0.002 | ||||||
| Brachyury 2 | 5.49 | 3.24 | 1.99 | 1.66 | 2.73 | 2.19 | 0.000 | 0.000 | 0.001 | 0.003 | 0.000 | 0.011 | 0.000 | ||
| Carbonyl reductase 2 | −2.08 | −1.79 | −3.49 | −1.52 | 0.001 | 0.003 | 0.000 | 0.001 | 0.003 | 0.000 | |||||
| Carnitine palmitoyltransferase 1, liver |
−1.80 | −1.63 | 1.54 | 1.52 | 0.003 | 0.006 | 0.000 | 0.000 | 0.006 | ||||||
| CD24a antigen | 1.68 | 1.90 | 3.04 | 2.02 | 2.01 | 0.000 | 0.000 | 0.000 | 0.001 | 0.002 | 0.000 | 0.008 | |||
| Chemokine (C-X-C motif) ligand 12 |
−2.63 | 1.74 | 2.37 | −1.52 | 0.00 | 0.00 | 0.00 | 0.02 | 0.000 | ||||||
| Choline kinase | 1.92 | 1.59 | −1.51 | −3.43 | 0.001 | 0.000 | 0.000 | 0.000 | 0.000 | 0.000 | |||||
| Crystallin, alpha C | −1.92 | −1.59 | 1.53 | 1.57 | 0.001 | 0.005 | 0.000 | 0.000 | 0.005 | ||||||
| Cytochrome P450, family 2, subfamily a, polypeptide 5 |
1.86 | 1.67 | −1.50 | −1.82 | 0.000 | 0.000 | 0.000 | 0.000 | 0.000 | 0.004 | |||||
| Dihydrolipoamide S- acetyltransferase (E2 component of pyruvate dehydrogenase complex) |
−1.62 | −1.55 | 2.31 | 1.53 | 0.005 | 0.008 | 0.000 | 0.000 | 0.008 | 0.001 | |||||
| Dual-specificity tyrosine-(Y)- phosphorylation regulated kinase 1a |
−1.75 | −1.88 | 1.62 | 1.75 | 0.001 | 0.000 | 0.000 | 0.000 | 0.000 | ||||||
| EGL nine homolog 1 (C. elegans) |
2.37 | 4.97 | 0.00 | 0.00 | 0.000 | ||||||||||
| EGL nine homolog 3 (C. elegans) |
−1.73 | −1.82 | 0.00 | 0.00 | |||||||||||
| Erythrocyte protein band 4.1 | 1.57 | 3.41 | 2.59 | 1.57 | 0.001 | 0.000 | 0.000 | 0.025 | |||||||
| FK506 binding protein 4 | −1.59 | 1.84 | 1.83 | 2.27 | 0.00 | 0.00 | 0.00 | 0.00 | 0.000 | ||||||
| Glucosamine-6-phosphate deaminase 2 |
1.81 | 1.56 | −1.88 | −2.10 | 0.000 | 0.000 | 0.000 | 0.000 | 0.000 | ||||||
| Golgi apparatus protein 1 | −1.57 | −3.73 | 1.70 | 1.52 | 0.012 | 0.000 | 0.000 | 0.000 | 0.000 | ||||||
| Guanine deaminase | 3.21 | 1.98 | 1.76 | 2.27 | 1.71 | 0.000 | 0.000 | 0.000 | 0.000 | 0.019 | 0.000 | ||||
| Heat shock protein 1 (chaperonin) |
−1.79 | 1.71 | 1.83 | −1.53 | 0.001 | 0.000 | 0.000 | 0.001 | |||||||
| Hepatoma-derived growth factor |
−1.94 | −1.50 | 2.58 | −1.69 | −1.73 | 0.000 | 0.000 | 0.000 | 0.003 | 0.003 | 0.000 | ||||
| Heterogeneous nuclear ribonucleoprotein K |
−8.69 | −3.73 | 1.68 | 1.97 | 0.000 | 0.000 | 0.000 | 0.000 | 0.000 | 0.004 | |||||
| Histocompatibility 2, L region | −2.58 | −1.51 | −2.53 | −2.82 | 0.000 | 0.002 | 0.000 | 0.000 | 0.002 | 0.004 | |||||
| Immunoglobulin heavy chain 6 (heavy chain of IgM) |
2.91 | 2.20 | 1.78 | −1.63 | 0.00 | 0.00 | 0.00 | 0.00 | 0.005 | ||||||
| Interferon-stimulated protein | 2.06 | 2.32 | 1.83 | 4.29 | 2.35 | 2.13 | 0.000 | 0.000 | 0.003 | 0.000 | 0.000 | 0.003 | 0.000 | 0.000 | |
| Kinasin family member 22 | 2.95 | 5.14 | 2.52 | −1.92 | −1.56 | 0.000 | 0.000 | 0.000 | 0.026 | 0.006 | |||||
| Makorin, ring finger protein, 1 | 2.11 | 2.26 | 1.54 | 2.27 | 0.000 | 0.000 | 0.005 | 0.004 | 0.000 | ||||||
| Mitochondrial solute carrier protein |
4.97 | 2.49 | 1.98 | 1.79 | 2.10 | 0.000 | 0.000 | 0.000 | 0.002 | 0.021 | 0.000 | ||||
| Peroxiredoxin 2 | 1.84 | 1.60 | −1.71 | −1.59 | 0.000 | 0.006 | 0.000 | 0.000 | 0.006 | ||||||
| Pre-mRNA processing factor β | −1.54 | −2.24 | 1.56 | 1.91 | 0.005 | 0.000 | 0.000 | 0.000 | 0.000 | 0.001 | |||||
| Proteaseome (prosome, macropain) 28 subunit, 3 |
2.18 | 2.12 | 0.000 | 0.000 | |||||||||||
| Proteasome (prosome, macropain) inhibitor subunit 1 |
2.19 | −1.77 | −1.84 | −1.77 | −1.96 | 0.000 | 0.000 | 0.000 | 0.000 | 0.000 | |||||
| RAB4B, member RAS oncogene family |
3.92 | 1.65 | 2.17 | −1.67 | −1.62 | 0.000 | 0.000 | 0.000 | 0.000 | 0.001 | 0.000 | ||||
| Ras-related associated with diabetes |
2.08 | 1.71 | 1.69 | 1.54 | 0.000 | 0.000 | 0.000 | 0.005 | 0.001 | ||||||
| Reticulocalbin | 1.91 | 4.01 | 1.71 | −1.65 | −4.56 | 0.000 | 0.000 | 0.000 | 0.009 | 0.000 | 0.000 | 0.000 | |||
| Rho guanine nucleotide exchange factor (GEF) 1 |
−1.55 | −2.15 | −2.04 | −2.72 | 0.003 | 0.000 | 0.002 | 0.001 | 0.000 | 0.000 | |||||
| Ribosomal protein S6 | 3.88 | 1.63 | −1.70 | −2.51 | 0.000 | 0.000 | 0.000 | 0.000 | 0.000 | 0.002 | |||||
| Ribosome binding protein 1 | −1.51 | −1.99 | −1.50 | −1.52 | 0.004 | 0.000 | 0.000 | 0.000 | 0.000 | ||||||
| RNA-binding region (RNP1, RRM) containing 1 |
2.23 | 2.19 | 0.000 | 0.000 | |||||||||||
| SH3 domain binding glutamic acid-rich protein-like 3 |
−1.78 | −1.52 | 1.96 | 1.51 | −1.64 | −2.42 | 0.000 | 0.000 | 0.000 | 0.000 | 0.001 | 0.000 | 0.000 | 0.007 | 0.000 |
| Signal recognition particle receptor, B subunit |
−1.70 | −1.51 | −1.94 | −2.20 | 0.002 | 0.007 | 0.000 | 0.000 | 0.007 | ||||||
| Small nuclear ribonucleoprotein polypeptide F |
2.53 | 2.03 | −1.80 | −2.23 | 1.88 | 0.000 | 0.000 | 0.000 | 0.000 | 0.000 | 0.000 | 0.003 | |||
| Solute carrier family 12, member 2 |
3.05 | 3.68 | −1.58 | 0.00 | 0.00 | 0.00 | 0.000 | ||||||||
| Solute carrier family 25 (mitochondrial carrier; adenine nucleotide translocator), member 13 |
2.02 | 2.15 | 0.000 | 0.000 | |||||||||||
| Solute carrier family 25 (mitochondrial deoxynucleotide carrier), member 19 |
−1.88 | −1.98 | 2.03 | 1.81 | 0.002 | 0.002 | 0.000 | 0.000 | 0.002 | ||||||
| Special AT-rich sequence binding protein 1 |
−2.64 | −4.18 | −2.01 | −2.70 | −3.11 | −1.91 | 0.006 | 0.002 | 0.009 | 0.003 | 0.006 | 0.028 | 0.002 | 0.001 | 0.002 |
| Succinate-CoA ligase, GDP- forming, alpha subunit |
−2.03 | −1.50 | 1.93 | 2.32 | 0.000 | 0.001 | 0.000 | 0.000 | 0.002 | ||||||
| Tescalcin | −2.41 | −3.23 | 1.57 | 2.87 | 0.002 | 0.001 | 0.000 | 0.000 | 0.001 | 0.000 | |||||
| Tissue inhibitor of metalloproteinase 2 |
1.89 | 1.68 | 1.68 | −1.97 | −1.56 | 0.000 | 0.000 | 0.000 | 0.001 | 0.003 | 0.003 | ||||
| Transferrin receptor | 1.94 | 3.34 | 1.72 | 2.33 | 0.000 | 0.000 | 0.000 | 0.000 | 0.000 | ||||||
| TXK tyrosine kinase | −1.66 | −1.58 | −1.51 | −2.22 | 0.000 | 0.000 | 0.000 | 0.000 | 0.000 | 0.001 | |||||
| Ublquintin c-terminal hydrolase related |
|||||||||||||||
| polypeptide | −1.67 | −1.58 | −1.69 | −1.58 | 0.000 | 0.000 | 0.004 | 0.006 | 0.000 | ||||||
| WD repeat domain 22 | 1.59 | −2.22 | −2.40 | −1.53 | −1.52 | 0.010 | 0.000 | 0.000 | 0.000 | 0.000 | |||||
| WD repeat domain 7 | 1.98 | 1.77 | −1.70 | −2.16 | 0.000 | 0.000 | 0.000 | 0.000 | 0.000 |
Examples of similarly regulated genes in CCH and CIH hearts. Nos. in columns labeled 1I/N–4C/N indicate expression fold change (negative for downregulation) with respect to the corresponding normoxic mice (N) after 1, 2, and 4 wk of CCH (C/N columns) or CIH (I/N columns), whereas nos. in columns labeled P(I1/N)–P(C4/I) are the P values of the significant differences when comparing the individual measurements at 1, 2, and 4 wk of the indicated treatments, using a heteroscedastic Student’s t-test. Missing values indicate not-significant regulation (i.e., absolute fold change <1.5 and/or P value > 0.05). Note that, although the significant [P(I1,2,4/N) and P(C1,2,4/N) <0.05) regulation with respect to normoxia had the same orientation in both hypoxic treatments, the fold change was different, and in most cases the difference was statistically significant [P(C1,2,4/1) < 0.05].
Most genes related to fibrosis were upregulated in both CCH and CIH, and this synergistic upregulation of the collagen gene family suggested that fibrosis would be enhanced during hypoxia (Supplemental Fig. S2F). Genes related to immune response were also upregulated in both CCH and CIH. Chemokine (C-X-C motif) ligand 12, immunoglobulin heavy chain (J558 family), interferon-stimulated protein, FK506 binding protein 4, and beclin 1 (coiled-coil, myosin-like BCL2-interacting protein) are some genes regulating diverse biological functions, the expression levels of which were significantly altered by chronic hypoxia treatment. Lastly, solute carrier family 6, member 8 (creatine transporter), and solute carrier family 12 (sodium/potassium/chloride transporters) were upregulated in both CCH and CIH, suggesting that ionic homeostasis may have been altered, as would be expected in hypoxia (20, 23).
Divergent transcriptomic effects of CCH and CIH
Some gene families were differently altered in the two conditions. These genes are likely to be involved in inducing distinct phenotypes between CCH and CIH hearts. For example, genes encoding eukaryotic initiation factors and genes encoding ribosomal protein subunits were mostly upregulated in CCH and downregulated in CIH. We identified a total of 23 eIFs that were regulated by hypoxia in the mouse heart, with more upregulated genes in CCH and more downregulated genes in CIH hearts. This may explain the increased protein synthesis in CCH heart and subsequent myocardial hypertrophy (Fig. 2F and Fig. 4A). Indeed, previous studies have indicated that eIFs and their phosphorylation are important in cardiac hypertrophy (4). CCH and CIH induced similar regulation of genes such as eIF3s, eIF4g2, and eIF4el3 but opposite regulations of genes such as eIF3s10, eIF3s2, and eIF2c2. To determine whether eIF proteins increase and possibly play a role in cardiac hypertrophy, eIF-2α and eIF-4E were studied in this work. Western blotting showed that both eIF-2α and eIF-4E increased ~1.5-fold at 1 wk in CCH. We also showed that phosphorylated eIF-4E (Ser209) increased by ~1.8- to 2.0-fold at 1 and 2 wk in CCH, and this increase was more remarkable than the increase in total protein level of eIF-4E. The changes of total as well as phosphorylated eIF-2α and eIF-4E in CIH heart were not significant. The gene eIF-4E, along with the upregulation of eIF-4E binding protein 2, an inhibitor of eIF-4E, control the translation efficiency and are likely to be important in cardiac hypertrophy in CCH (4).
The divergent effects of CCH and CIH on heart gene expression were also observed when apoptotic and Rho/MAPK signaling genes were considered. For example, most of the proapoptotic genes were upregulated and most of the anti-apoptotic genes were downregulated in CCH but not in CIH (Fig. 5, A and B, and Table 4). This suggested that myocardial apoptosis might be enhanced in the CCH model. To further test this hypothesis, TUNEL staining was performed in both CCH and CIH heart sections. At least 20 consecutive high-magnification images were captured from each section of CCH, CIH, or control hearts. The ratio of apoptotic nuclei to total nuclei was significantly higher in the heart after 4 wk of CCH treatment (0.86%) compared with the age-matched normoxic controls (0.34%, P < 0.05; Fig. 5, C and E). No significant difference was found in the heart samples after 4 wk of CIH treatment (0.44%, P > 0.05; Fig. 5, C and F). This result correlated well with the changes in proapoptotic gene as well as anti-apoptotic gene expression in CCH and CIH. Furthermore, some genes, the function of which is related to either the Rho pathway or MAPK pathway, were differentially regulated in CCH and CIH hearts. Most members related to the Rho pathway were upregulated in CCH, but all were downregulated in CIH (Supplemental Fig. S2C); most of the altered MAPK pathwayrelated genes were upregulated in CCH but not in CIH (Supplemental Fig. S2D).
Fig. 5.
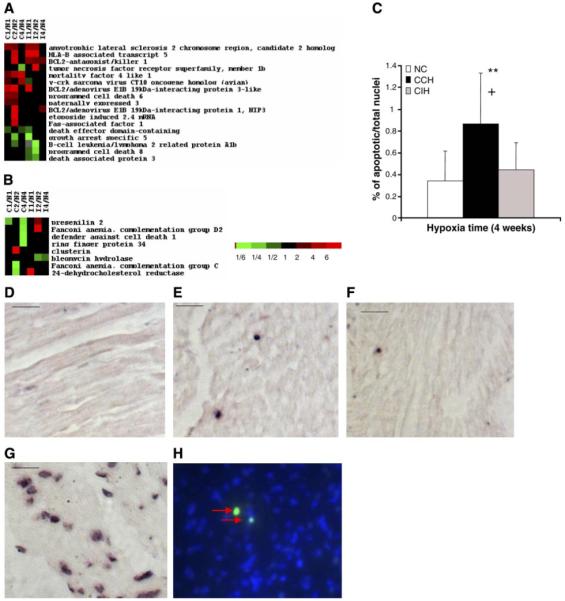
Alteration in proapoptotic and anti-apoptotic genes in CCH- and CIH-treated mouse heart. A and B: proapoptotic genes were mostly upregulated in CCH hearts, whereas the anti-apoptotic genes were dominantly upregulated in CIH-treated hearts. C: ratio of apoptotic nuclei to total nuclei shows that apoptotic nuclei were significantly increased in CCH-but remained unchanged in CIH-treated mouse hearts. After treatment with converter-alkaline phosphatase, the apoptotic nuclei could be detected as dark spots (arrows in E, F, G) under a light microscope: apoptotic nuclei are clearly seen in CCH-treated (E) but are rarely seen in age-matched NC (D) and CIH-treated (F) mouse hearts. In C, **P < 0.01 and +P < 0.05. G: positive control. A heart section from an NC mouse treated with DNase I. Many nuclei with fragmented DNA were labeled by TUNEL. H: fluorescent microscope picture of apoptotic nuclei in CCH that were stained with green fluorescein and colocalized with the nuclei dye DAPI (blue). Scale bars = 20 μm.
Table 4. Examples of differently regulated genes in CCH and CIH hearts.
| Gene Name | 1I/N | 1C/N | 2I/N | 2C/N | 4I/N | 4C/N | P(1I/N) | P(1C/N) | P(2I/N) | P(2C/N) | P(4I/N) | P(4C/N) | P(C1/I) | P(C2/I) | P(C4/I) |
|---|---|---|---|---|---|---|---|---|---|---|---|---|---|---|---|
| 5-Phosphorylase kinase, gamma 2 (testis) |
2.20 | −2.01 | −1.70 | 0.00 | 0.00 | 0.00 | 0.000 | ||||||||
| A disintegrin and metalloproteinase domain 17 |
−1.63 | −1.68 | 2.28 | 2.10 | 0.00 | 0.00 | 0.00 | 0.00 | 0.000 | ||||||
| A kinase (PRKA) anchor protein (gravin) 12 |
−1.84 | −1.58 | 1.50 | 0.00 | 0.00 | 0.00 | 0.000 | ||||||||
| Actin related protein 2/3 complex, subunit 4 |
−1.65 | 1.81 | 2.26 | 0.00 | 0.00 | 0.00 | 0.000 | ||||||||
| Adenosine kinase | −1.72 | 2.95 | 1.51 | 0.00 | 0.00 | 0.00 | 0.000 | ||||||||
| ADP-ribosylation factor 1 | −1.51 | −1.57 | 1.61 | 0.00 | 0.00 | 0.01 | 0.000 | ||||||||
| ADP-ribosylation factor interacting protein 2 |
7.07 | −1.66 | 2.53 | −6.04 | −1.69 | 0.00 | 0.00 | 0.00 | 0.00 | 0.00 | 0.001 | 0.000 | |||
| Aldehyde reductase (aldose reductase)-like 6 |
−2.03 | 1.66 | −2.68 | 3.50 | 0.00 | 0.00 | 0.00 | 0.00 | 0.000 | 0.000 | |||||
| Aldolase 2, B isoform | −1.54 | 1.50 | 2.53 | −2.46 | −1.86 | 0.00 | 0.00 | 0.00 | 0.00 | 0.00 | 0.000 | 0.000 | |||
| Aldolase 3, C isoform | −1.56 | 1.54 | 2.55 | −1.55 | 0.00 | 0.00 | 0.00 | 0.00 | 0.000 | 0.000 | |||||
| Anaphase-promoting complex subunit 2 |
−1.60 | 1.67 | 2.12 | −2.01 | −2.59 | 0.00 | 0.00 | 0.00 | 0.00 | 0.00 | 0.000 | 0.000 | |||
| Ankyrin repeat domain 10 | −1.83 | 1.51 | −1.70 | −2.22 | 2.36 | 0.00 | 0.00 | 0.00 | 0.00 | 0.00 | 0.000 | 0.000 | |||
| ATPase, H+ transporting, V1 subunit A, Isoform 1 |
1.59 | −1.80 | −1.55 | 1.52 | 1.78 | 0.00 | 0.00 | 0.00 | 0.00 | 0.00 | 0.000 | 0.000 | |||
| ATP-binding cassette, sub-family D (ALD), member 4 |
−1.99 | 1.63 | −1.69 | 1.50 | 0.00 | 0.00 | 0.00 | 0.00 | 0.000 | 0.000 | |||||
| Basic leucine zipper and W2 domains 1 |
−2.56 | 1.56 | 2.60 | −1.69 | 0.00 | 0.00 | 0.00 | 0.00 | 0.000 | 0.000 | |||||
| B-cell CLL/lymphoma 9 | −2.27 | 1.51 | −2.13 | 1.93 | 0.00 | 0.00 | 0.00 | 0.00 | 0.000 | 0.000 | |||||
| Bernardinelli-Seip congenital lipodystrophy 2 homolog (human) |
−2.18 | 1.51 | 1.90 | −1.55 | 0.00 | 0.00 | 0.00 | 0.00 | 0.000 | 0.000 | |||||
| Branched chain ketoacid dehydrogenase kinase |
−1.97 | 3.47 | −2.20 | 2.53 | 0.00 | 0.00 | 0.00 | 0.00 | 0.000 | 0.000 | |||||
| Cellular nucleic acid binding protein | −2.25 | 1.69 | 1.75 | −1.90 | −2.06 | −2.77 | 0.00 | 0.00 | 0.00 | 0.00 | 0.00 | 0.00 | 0.000 | 0.000 | 0.010 |
| CK2 interacting protein 1 | −1.85 | 1.74 | 3.53 | −2.23 | −1.96 | −4.47 | 0.00 | 0.00 | 0.00 | 0.00 | 0.00 | 0.00 | 0.000 | 0.000 | 0.000 |
| Coactivator-associated arginine methyltransferase 1 |
−1.70 | 1.57 | −1.71 | 2.24 | 1.57 | 2.52 | 0.00 | 0.00 | 0.00 | 0.00 | 0.00 | 0.00 | 0.000 | 0.000 | 0.001 |
| Complement component 1, q subcomponent, gamma polypeptide |
−2.04 | 1.56 | 1.98 | −1.78 | −1.75 | −3.20 | 0.00 | 0.00 | 0.00 | 0.00 | 0.00 | 0.00 | 0.000 | 0.000 | 0.000 |
| Component of oligomeric golgi complex 1 |
−1.67 | 1.57 | 2.20 | −1.86 | −1.76 | −3.54 | 0.00 | 0.00 | 0.00 | 0.00 | 0.01 | 0.00 | 0.003 | 0.000 | 0.000 |
| Component of oligomeric golgi complex 6 |
−2.58 | 1.91 | 2.33 | −2.13 | −1.60 | −2.07 | 0.00 | 0.00 | 0.00 | 0.00 | 0.01 | 0.00 | 0.000 | 0.000 | 0.013 |
| Crystallin, alpha C | 2.81 | −1.55 | −3.58 | 0.00 | 0.00 | 0.00 | 0.000 | ||||||||
| Cysteine and glycine-rich protein 2 | −2.46 | 2.22 | −1.81 | −1.77 | 0.00 | 0.00 | 0.00 | 0.00 | 0.000 | ||||||
| Cytochrome b-5 | 1.59 | −1.52 | 2.81 | 2.07 | 0.00 | 0.00 | 0.00 | 0.00 | 0.000 | ||||||
| Cytochrome c oxidase, subunit VIb | −1.58 | 2.20 | 0.00 | 0.00 | 0.000 | ||||||||||
| DAZ associated protein 2 | −1.55 | 2.13 | 1.89 | 0.01 | 0.00 | 0.00 | 0.000 | ||||||||
| DEAD (Asp-Glu-Ala-Asp) box polypeptide 24 |
1.55 | −1.57 | 1.54 | 0.00 | 0.00 | 0.00 | 0.000 | ||||||||
| Dimethylarginine dimethylaminohydrolase 2 |
1.69 | −2.37 | 0.00 | 0.00 | 0.000 | ||||||||||
| DnaJ (Hsp40) homolog, subfamily B, member 9 |
1.74 | −1.51 | −1.90 | 0.00 | 0.00 | 0.00 | 0.000 | ||||||||
| Dudlin 2 | −2.19 | 2.08 | −3.86 | −2.48 | 0.00 | 0.00 | 0.00 | 0.00 | 0.000 | ||||||
| EBNA1 binding protein 2 | −1.81 | 2.01 | 2.00 | 0.00 | 0.00 | 0.00 | 0.000 | ||||||||
| Elongation protein 4 homolog (S. cerevisiae) |
−1.82 | 1.58 | −2.27 | 0.00 | 0.00 | 0.00 | 0.001 | ||||||||
| Enoyl CoA hydratase domain containing 1 |
1.64 | −1.95 | 2.04 | 0.00 | 0.00 | 0.00 | 0.000 | ||||||||
| Era (G protein)-like 1 (E. coli) | −1.73 | 1.85 | 0.00 | 0.00 | 0.000 | ||||||||||
| Gene trap locus 6 | −2.01 | 1.71 | −2.23 | 2.86 | 0.00 | 0.00 | 0.00 | 0.00 | 0.000 | ||||||
| GLI pathogenesis-related 2 | 2.24 | −1.95 | 1.81 | 2.08 | 0.00 | 0.00 | 0.00 | 0.00 | 0.000 | ||||||
| High mobility group nucleosomal binding domain 1 |
−1.70 | 1.64 | 0.00 | 0.00 | 0.000 | ||||||||||
| Homeodomain interacting protein kinase 1 |
1.64 | −1.74 | 1.57 | 0.00 | 0.00 | 0.00 | 0.000 | ||||||||
| Lymphocyte antigen 6 complex, locus C |
−1.60 | 1.63 | −2.34 | 1.66 | 0.00 | 0.00 | 0.00 | 0.00 | 0.000 | ||||||
| MAD homolog 4 (Drosophila) | −1.90 | 1.85 | 2.15 | 0.00 | 0.00 | 0.00 | 0.000 | ||||||||
| Metastasis associated 1 | 1.57 | −2.01 | 1.68 | 0.00 | 0.00 | 0.00 | 0.000 | ||||||||
| Methyl CpG binding protein 2 | 1.77 | −1.76 | −1.61 | 1.72 | 0.00 | 0.00 | 0.00 | 0.00 | 0.000 | ||||||
| Mitochondrial ribosomal protein L35 | −1.52 | 1.72 | −2.06 | −1.54 | 0.00 | 0.00 | 0.00 | 0.00 | 0.000 | ||||||
| Mortality factor 4 like 1 | 1.72 | −1.89 | −1.61 | 0.00 | 0.00 | 0.00 | 0.000 | ||||||||
| Neighbor of Punc E11 | −2.19 | −1.52 | 0.00 | 0.00 | 0.001 | ||||||||||
| Notch gene homolog 1 (Drosophila) | 1.58 | −1.69 | 2.25 | 1.58 | 0.00 | 0.00 | 0.00 | 0.00 | 0.000 | ||||||
| Nucleosome binding protein 1 | −2.36 | 1.64 | −1.97 | 0.00 | 0.00 | 0.00 | 0.000 | ||||||||
| Peroxiredoxin 6 | 2.04 | 1.92 | −1.66 | 0.00 | 0.00 | 0.00 | 0.000 | ||||||||
| Purine rich element binding protein A | −2.84 | 1.61 | 0.00 | 0.00 | 0.000 | ||||||||||
| Rho guanine nucleotide exchange factor (GEF) 10 |
2.04 | 1.66 | 1.87 | −2.03 | 0.00 | 0.00 | 0.00 | 0.00 | 0.000 | ||||||
| Rho guanine nucleotide exchange factor (GEF) 17 |
−1.59 | −1.92 | 1.98 | 2.24 | 0.00 | 0.00 | 0.00 | 0.00 | 0.000 | ||||||
| Rho-guanine nucleotide exchange factor |
−1.51 | 1.68 | 1.74 | 0.00 | 0.00 | 0.00 | 0.000 | ||||||||
| Small optic lobes homolog (Drosophila) |
1.63 | 1.72 | −1.54 | 0.00 | 0.00 | 0.00 | 0.000 | ||||||||
| Speckle-type POZ protein | −1.64 | −1.82 | 1.61 | 2.04 | 0.00 | 0.00 | 0.00 | 0.00 | 0.000 | ||||||
| Spermidine/spermine N1-acetyl transferase 2 |
−1.54 | 2.05 | 1.92 | 0.00 | 0.00 | 0.00 | 0.000 | ||||||||
| Transformation related protein 53 | −1.70 | 1.56 | 1.85 | 0.00 | 0.00 | 0.00 | 0.000 | ||||||||
| Ubiquilin 1 | −1.54 | 1.53 | −1.77 | 1.79 | 0.00 | 0.00 | 0.00 | 0.00 | 0.000 |
Examples of differently regulated genes in CCH and CIH hearts. Nos. in columns labeled 1I/N–4C/N indicate expression fold change (negative for downregulation) with respect to the corresponding normoxic mice (N) after 1, 2, and 4 WK of CCH (C/N columns) or CIH (I/N columns), whereas nos. in columns labeled P(I1/N)–P(C4/I) are the P values of the significant differences when comparing the individual measurements at 1, 2, and 4 WK of the indicated treatments, using a heteroscedastic Student’s t-test. Note the opposite regulation with respect to normoxia and the statistical significance of the difference between the 2 hypoxic treatments [P(C1,2,4/I) <0.05].
There were also other examples showing divergent effects on gene expression in CCH- and CIH-treated hearts. For instance, MAD homolog 4 (Drosophila) and Notch homolog 1 (Drosophila), genes that are important in cell fate and cell proliferation, were upregulated by ~1.5- to 2.3-fold in CCH but downregulated by a similar magnitude in CIH. The homeodomain-interacting protein kinase 1, a suppressor of homeodomain transcription factor, which is involved also in development, was downregulated by 2.2-fold in CCH but upregulated by ~1.6- to 2.2-fold in CIH. In addition, the upregulation of GATA-2 in CCH but its downregulation in CIH may explain the different effects of CCH and CIH on cardiac muscle size (19). Furthermore, the small optic lobes homolog gene, which contains a calpain domain, was upregulated 7.0-fold in CIH but downregulated 5.8-fold in CCH. This suggests that the small optic lobe gene may be important in hypoxia-reoxygenation-induced injury or proteolysis (26).
DISCUSSION
We used cDNA microarray to study the alteration of gene expression in hearts of neonatal mice subjected to CCH and CIH vs. normoxia on a large genomic scale, identifying also transcriptomic similarities and dissimilarities between CCH and CIH. The multiple yellow strategy that we used was validated in previous studies (3). It improves intrachip normalization, since the mRNA content of the starting total RNA was affected only by the biological variability among animals, matched by gender, age, and condition. Indeed, the green and red fluorescence signals, which were obtained with the same scanner setting for all slides, were compared separately, thus avoiding the inherent nonuniform bias toward one tag. This allowed all possible comparisons among conditions, time points, and genders. Our results show for the first time that CCH and CIH have dramatic effects on the mouse heart transcriptome, exhibiting both similar and opposite alterations of gene expression. It should be emphasized that Supplemental Table S6 illustrates 1) the reproducible pattern within each set of four animals subjected to the same condition, 2) variability among individuals in each set of animals, and 3) distinct expression profiles among the three experimental treatments, namely, normoxia, CIH, and CCH for the same duration.
In the current study, several clusters of genes that are related to certain specific biological processes were significantly altered by the hypoxia treatments. One of the altered gene clusters is related to the translational initiation factors in CCH and CIH. In CCH, genes encoding eIFs as well as ribosomal proteins were mostly upregulated, as measured by microarrays and QRT-PCR as well as by Western blot analysis [eIF-2α, eIF-2α (Ser52), eIF-4E, and eIF-4E (Ser209)]. Upregulation of these genes and their proteins enhances protein synthesis. Protein levels and phosphorylated proteins of eIFs may also have an effect on translation and protein synthesis. While the relation between phosphorylated eIF-2α and protein synthesis may not be well understood, that of phosphorylated eIF-4E is well known. For example, Tuxworth et al. (25) found that eIF-4E phosphorylation and protein synthesis are increased concomitantly in response to stimuli that induce hypertrophic growth in adult cardiocytes (25). This is consistent with our in vivo results: both eIF-4E protein level and phosphorylated eIF-4E (Ser209) increased in CCH after 1 and 2 wk, an increase that is expected to promote protein synthesis. In CIH, eIF-4E was downregulated at both 1 and 2 wk, a condition that explains the absence of cardiac hypertrophy. Therefore, we raise the distinct hypothesis that the enhanced protein synthesis machinery (via eIFs) plays an important role in the hypertrophy of heart in CCH. The eIF RNA and protein results and the hypothesis of increased protein synthesis in CCH are further supported by our other data showing increased cell size of cardiac myocytes as well as increased total protein (Fig. 2F).
Signaling pathways that induce hypertrophy and enlargement of heart size include two gene families: the Rho GTPases and the MAPKs. Because 1) several members of Rho GTPases have been reported to be involved in cardiac hypertrophy (11), and 2) two members of the Rho GTPases (Arhgap10 and Arhgap18) were upregulated in CCH, we believe that such pathways actually contributed in inducing cardiac hypertrophy in CCH. Indeed, most members of MAPK have been identified in our work to be upregulated in CCH but not in CIH. Such changes may be related to increased heart mass in CCH (24). Combined with other results from our microarray study, such as the downregulation of thioredoxin-interacting protein and upregulation of GATA-2, which are already known to be involved in cardiac hypertrophy (28, 19), we believe that hypertrophy of cardiac myocytes in CCH is the result of coordinated regulation on expression of various gene families.
Of great interest is the fact that the increase in protein synthesis in the heart in hypoxia contrasts to the decrease in protein synthesis in most organs (such as brain and kidney; Supplemental Fig. S3, A and B). The question of how different is protein synthesis in the hypoxic heart compared with other organs is intriguing. We have indeed alluded to this difference in our previous work (18). Interestingly, the lungs also increase in weight or at least do not reduce their weights in hypoxia, as do the kidneys and to a lesser degree the brain (Supplemental Fig. S3, C and D, and unpublished observations), suggesting that the heart and lungs behave in a similar manner and enhance protein synthesis for adaptation to the hypoxic stress. Although muscle fiber stretching such as in hypertension or overload can induce cardiac hypertrophy, we believe that hypoxia directly induces the hypertrophy. This partly agrees with in vitro studies showing that mild hypoxia (10% O2) induces hypertrophy of cardiomyocytes of rat (15).
Because hypoxia can change cell fate, we further asked whether programmed cell death takes place, especially because we have evidence that, in CCH heart, the genes involved in apoptosis are regulated. In situ TUNEL staining confirmed that changes in gene expression paralleled those in apoptosis. This result further supports the notion that, during CCH, the heart undergoes remodeling that is not restricted only to hypertrophy. There is indeed a more complicated process that induces apoptosis (9, 27).
Although the increase in cardiac and cell size in CIH was not impressive, we did additional experiments to determine whether a more severe hypoxia in the intermittent model (7.5% O2 instead of 11% O2) would induce a hypertrophy similar to CCH. With this more severe paradigm, the heart and cell size were even much smaller than in controls, suggesting that the lack of hypertrophy in CIH is due to the nature of this particular stress model. Downregulation of most subunits of mitochondrial complex I in CIH but not in CCH suggested possible mitochondrial functional inhibition and a resultant shortage of ATP supply in the organ (10). Along with down-regulation of several genes involved in cardiac development (Supplemental Figs. S2, E and G), these may constitute the underlying molecular mechanisms in CIH.
In conclusion, our results show that CCH and CIH have different impacts on heart phenotype and that the respective genetic responses provide a molecular basis for these phenotypic differences. In CCH, the heart is characterized by a robust right ventricular hypertrophy and larger cardiac mass. This phenotype creates an imbalance with the continuous relative shortage of O2 supply and with an induction of proapoptotic genes, which may constitute a major mechanism for heart failure. By contrast, in CIH, mitochondrial dysfunction and cardiac growth inhibition in early life may be more important.
Supplementary Material
ACKNOWLEDGMENTS
We are grateful for the technical assistance of Cate Muenker. We also thank P. E. Aldo Massimi from the Microarray Facility at AECOM for consultative help.
GRANTS
This work was supported by National Heart, Lung, and Blood Institute Grant R01-HL-66327.
Footnotes
The Supplemental Material for this article (Supplemental Figs. S1–S4 and Supplemental Tables S1–S6) is available online at http://physiolgenomics.physiology.org/cgi/content/full/00217.2004/DC1.
REFERENCES
- 1.Arsham AM, Howell JJ, Simon MC. A novel hypoxia-inducible factor-independent hypoxic response regulating mammalian target of rapamycin and its targets. J Biol Chem. 2003;278:29655–29660. doi: 10.1074/jbc.M212770200. [DOI] [PubMed] [Google Scholar]
- 2.Ashburner M, Ball CA, Blake JA, Botstein D, Butler H, Cherry JM, Davis AP, Dolinski K, Dwight SS, Eppig JT, Harris MA, Hill DP, Issel-Tarver L, Kasarskis A, Lewis S, Matese JC, Richardson JE, Ringwald M, Rubin GM, Sherlock G. Gene Ontology: tool for the unification of biology. Nat Genet. 2000;25:25–29. doi: 10.1038/75556. [DOI] [PMC free article] [PubMed] [Google Scholar]
- 3.Brand-Schieber E, Werner P, Iacobas DA, Iacobas S, Beelitz M, Lowery SL, Spray DC, Scemes S. Connexin43, the major gap junction protein of astrocytes, is down-regulated in inflamed white matter in an animal model of multiple sclerosis. J Neurosci Res. 2005;80:798–808. doi: 10.1002/jnr.20474. [DOI] [PMC free article] [PubMed] [Google Scholar]
- 4.Clemens MJ. Translational regulation in cell stress and apoptosis. Roles of the eIF4E binding proteins. J Cell Mol Med. 2001;5:221–239. doi: 10.1111/j.1582-4934.2001.tb00157.x. [DOI] [PMC free article] [PubMed] [Google Scholar]
- 5.Dahlquist KD, Salomonis N, Vranizan K, Lawlor SC, Conklin BR. GenMAPP, a new tool for viewing and analyzing microarray data on biological pathways. Nat Genet. 2002;31:19–20. doi: 10.1038/ng0502-19. [DOI] [PubMed] [Google Scholar]
- 6.Doniger SW, Salomonis N, Dahlquist KD, Vranizan K, Lawlor SC, Conklin BR. MAPPFinder: using Gene Ontology and GenMAPP to create a global gene-expression profile from microarray data. Genome Biol. 2003;4:R7. doi: 10.1186/gb-2003-4-1-r7. [DOI] [PMC free article] [PubMed] [Google Scholar]
- 7.Epstein AC, Gleadle JM, McNeill LA, Hewitson KS, O’Rourke J, Mole DR, Mukherji M, Metzen E, Wilson MI, Dhanda A, Tian YM, Masson N, Hamilton DL, Jaakkola P, Barstead R, Hodgkin J, Max-well PH, Pugh CW, Schofield CJ, Ratcliffe PJ. C. elegans EGL-9 and mammalian homologs define a family of dioxygenases that regulate HIF by prolyl hydroxylation. Cell. 2001;107:43–54. doi: 10.1016/s0092-8674(01)00507-4. [DOI] [PubMed] [Google Scholar]
- 8.Gilbert RD, Pearce WJ, Longo LD. Fetal cardiac and cerebrovascular acclimatization responses to high altitude, long-term hypoxia. High Alt Med Biol. 2003;4:203–213. doi: 10.1089/152702903322022802. [DOI] [PubMed] [Google Scholar]
- 9.Graham RM, Frazier DP, Thompson JW, Haliko S, Li H, Wasserlauf BJ, Spiga MG, Bishopric NH, Webster KA. A unique pathway of cardiac myocyte death caused by hypoxia-acidosis. J Exp Biol. 2004;207:3189–3200. doi: 10.1242/jeb.01109. [DOI] [PubMed] [Google Scholar]
- 10.Hardy L, Clark JB, Darley-Usmar VM, Smith DR, Stone D. Reoxygenation-dependent decrease in mitochondrial NADH:CoQ reductase (Complex I) activity in the hypoxic/reoxygenated rat heart. Biochem J. 1991;274:133–137. doi: 10.1042/bj2740133. [DOI] [PMC free article] [PubMed] [Google Scholar]
- 11.Higashi M, Shimokawa H, Hattori T, Hiroki J, Mukai Y, Morikawa K, Ichiki T, Takahashi S, Takeshita A. Long-term inhibition of Rho-kinase suppresses angiotensin II-induced cardiovascular hypertrophy in rats in vivo: effect on endothelial NAD(P)H oxidase system. Circ Res. 2003;93:767–775. doi: 10.1161/01.RES.0000096650.91688.28. [DOI] [PubMed] [Google Scholar]
- 12.Iacobas DA, Iacobas S, Li WEI, Zoidl G, Dermietzel R, Spray DC. Genes controlling multiple functional pathways are transcriptionally regulated in connexin43 null mouse heart. Physiol Genomics. 2005;20:211–223. doi: 10.1152/physiolgenomics.00229.2003. [DOI] [PubMed] [Google Scholar]
- 13.Iacobas DA, Iacobas S, Spray DC. Use of cDNA arrays to explore gene expression in genetically manipulated mice and cell lines. In: Dhein S, Mohr FW, Delmar M, editors. Practical Methods in Cardiovascular Research. Springer-Verlag; New York: 2005. pp. 907–915. [Google Scholar]
- 14.Iacobas DA, Iacobas S, Urban-Maldonado M, Spray DC. Sensitivity of the brain transcriptome to connexin ablation. Biochim Biophys Acta. 2005;1711:183–196. doi: 10.1016/j.bbamem.2004.12.002. [DOI] [PubMed] [Google Scholar]
- 15.Ito H, Adachi S, Tamamori M, Fujisaki H, Tanaka M, Lin M, Akimoto H, Marumo F, Hiroe M. Mild hypoxia induces hypertrophy of cultured neonatal rat cardiomyocytes: a possible endogenous endothelin-1-mediated mechanism. J Mol Cell Cardiol. 1996;28:1271–1277. doi: 10.1006/jmcc.1996.0117. [DOI] [PubMed] [Google Scholar]
- 16.Kerr MK, Churchill GA. Statistical design and the analysis of gene expression microarrays. Genet Res. 2001;77:123–128. doi: 10.1017/s0016672301005055. [DOI] [PubMed] [Google Scholar]
- 17.Livak KJ, Schmittgen TD. Analysis of relative gene expression data using real-time quantitative PCR and the 2(−Delta Delta C(T)) Method. Methods. 2001;25:402–408. doi: 10.1006/meth.2001.1262. [DOI] [PubMed] [Google Scholar]
- 18.Ma E, Haddad GG. Anoxia regulates gene expression in the central nervous system of Drosophila melanogaster. Brain Res Mol Brain Res. 1997;46:325–328. doi: 10.1016/s0169-328x(97)00074-0. [DOI] [PubMed] [Google Scholar]
- 19.Musaro A, McCullagh KJ, Naya FJ, Olson EN, Rosenthal N. IGF-1 induces skeletal myocyte hypertrophy through calcineurin in association with GATA-2 and NF-ATc1. Nature. 1999;400:581–585. doi: 10.1038/23060. [DOI] [PubMed] [Google Scholar]
- 20.Neubauer S, Remkes H, Spindler M, Horn M, Wiesmann F, Prestle J, Walzel B, Ertl G, Hasenfuss G, Wallimann T. Downregulation of the Na(+)-creatine cotransporter in failing human myocardium and in experimental heart failure. Circulation. 1999;100:1847–1850. doi: 10.1161/01.cir.100.18.1847. [DOI] [PubMed] [Google Scholar]
- 21.Phillips BG, Somers VK. Hypertension and obstructive sleep apnea. Curr Hypertens Rep. 2003;5:380–385. doi: 10.1007/s11906-003-0083-0. [DOI] [PubMed] [Google Scholar]
- 22.Pierson DJ. Pathophysiology and clinical effects of chronic hypoxia. Respir Care. 2000;45:39–51. [PubMed] [Google Scholar]
- 23.Ramasamy R, Payne JA, Whang J, Bergmann SR, Schaefer S. Protection of ischemic myocardium in diabetics by inhibition of electroneutral Na+-K+-2Cl− cotransporter. Am J Physiol Heart Circ Physiol. 2001;281:H515–H522. doi: 10.1152/ajpheart.2001.281.2.H515. [DOI] [PubMed] [Google Scholar]
- 24.Ravingerova T, Barancik M, Strniskova M. Mitogen-activated protein kinases: a new therapeutic target in cardiac pathology. Mol Cell Biochem. 2003;247:127–138. doi: 10.1023/a:1024119224033. [DOI] [PubMed] [Google Scholar]
- 25.Tuxworth WJ, Jr, Saghir AN, Spruill LS, Menick DR, McDermott PJ. Regulation of protein synthesis by eIF4E phosphorylation in adult cardiocytes: the consequence of secondary structure in the 5′-untranslated region of mRNA. Biochem J. 2004;378:73–82. doi: 10.1042/BJ20031027. [DOI] [PMC free article] [PubMed] [Google Scholar]
- 26.Vanderklish PW, Bahr BA. The pathogenic activation of calpain: a marker and mediator of cellular toxicity and disease states. Int J Exp Pathol. 2000;81:323–339. doi: 10.1111/j.1365-2613.2000.00169.x. [DOI] [PMC free article] [PubMed] [Google Scholar]
- 27.Van Empel VP, De Windt LJ. Myocyte hypertrophy and apoptosis: a balancing act. Cardiovasc Res. 2004;63:487–499. doi: 10.1016/j.cardiores.2004.02.013. [DOI] [PubMed] [Google Scholar]
- 28.Yoshioka J, Schulze PC, Cupesi M, Sylvan JD, MacGillivray C, Gannon J, Huang H, Lee RT. Thioredoxin-interacting protein controls cardiac hypertrophy through regulation of thioredoxin activity. Circulation. 2004;109:2581–2586. doi: 10.1161/01.CIR.0000129771.32215.44. [DOI] [PubMed] [Google Scholar]
- 29.Zhou D, Xue J, Gavrialov O, Haddad GG. Na+/H+ exchanger 1 deficiency alters gene expression in mouse brain. Physiol Genomics. 2004;18:331–339. doi: 10.1152/physiolgenomics.00076.2004. [DOI] [PubMed] [Google Scholar]
Associated Data
This section collects any data citations, data availability statements, or supplementary materials included in this article.