

Abstract
Complementary deoxyribonucleic acid microarray data from 36 mice subjected for 1, 2, or 4 weeks of their early life to normal atmospheric conditions (normoxia) or chronic intermittent (CIH) or constant (CCH) hypoxia were analyzed to extract organizational principles of the developing heart transcriptome and determine the integrated response to oxygen deprivation. Although both CCH and CIH regulated numerous genes involved in a wide diversity of processes, the changes in maturational profile, expression stability, and coordination were vastly different between the two treatments, indicating the activation of distinct regulatory mechanisms of gene transcription. The analysis focused on the main regulators of translation and response to stress because of their role in the cardiac hypertrophy and cell survival in hypoxia. On average, the expression of each heart gene was tied to the expression of about 20% of other genes in normoxia but to only 8% in CCH and 9% in CIH, indicating a strong decoupling effect of hypoxia. In contrast to the general tendency, the interlinkages among components of the translational machinery and response to stress increased significantly in CIH and much more in CCH, suggesting a coordinated response to the hypoxic stress. Moreover, the transcriptomic networks were profoundly and differently remodeled by CCH and CIH.
Keywords: Eukaryotic translation elongation factors, Eukaryotic translation initiation factors, Hypoxia-inducible factor 1a, Heat shock proteins
Introduction
Epidemiological studies have revealed that chronic hypoxia, whether constant (e.g., resulting from pulmonary diseases or living at high altitude, hereafter denoted by CCH) or intermittent (e.g., such as in sleep apnea, denoted by CIH) is a major cause of cardiovascular and cerebrovascular disease, a most common ailment of industrialized societies (e.g., Covello and Simon 2004; Dursunoglu and Dursunoglu 2006; Jain 2007; Parati et al. 2007; Park et al. 2007; Plante 2006; Teran Santos et al. 2006; Venardos and Kaye 2007). The more than 140 million residents of high altitude (>2,500 m above the sea), for example, have pulmonary hypertension and right ventricular hypertrophy (Penaloza and Arias-Stella 2007), a condition characterizing also animals subjected to CCH (e.g., Abe et al. 2006; de Frutos et al. 2007; Fan et al. 2005; Morecroft et al. 2007; Paddenberg et al. 2007). Numerous clinical studies have demonstrated that sleep-related breathing disorders are independent risk factors for hypertension, probably resulting from a combination of CIH and hypercapnia, arousals, increased sympathetic activity, and altered baroreflex control during sleep (reviewed by O’Reilly and Bailey 2007). Such sleep breathing disorders have reached epidemic proportions as the incidence in adults is more than 4% (Camfferman et al. 2006; Chiang 2006) and about 1–2% in children (Dursunoglu and Dursunoglu 2006; Festen et al. 2006). Recent data have also shown that such CIH and sleep disorders can contribute to abnormalities to lipid and carbohydrate metabolism and the metabolic syndrome (Alam et al. 2007; Launois-Rollinat 2006; Ng et al. 2005). Several authors (e.g., Blais et al. 2006; Bruder et al. 2007; Das and Maulik 2006; Goh et al. 2007; Hu et al. 2006; Krieg et al. 2006; Kulshreshtha et al. 2007; Mense et al. 2006; Polotsky and O’Donnel 2007; Zhou et al. 2004) have used microarray platforms to investigate the transcriptomic changes in various organs of humans and animals exposed to hypoxia.
In this paper, we extend the analysis of previously published microarray data (series GSE2271 in http://www.ncbi.nlm.nih.gov/geo) to extract additional information regarding organizational principles of the developing mouse heart transcriptome under normal atmospheric conditions (normoxia) and the alteration of gene expression level, variability, and coordination in two chronic hypoxia paradigms: constant (CCH) and intermittent (CIH). Most of the analysis reported here focused on eukaryotic translation (initiation and elongation) factors because of their role in the cardiac hypertrophy (Clemens 2001) and on heat shock proteins (HSPs) as part of an integrated response to hypoxia aimed at promoting cell survival (Baker 2004; Kodde et al. 2007). HSPs form a highly conserved family of proteins with critical functions in protein folding, trafficking, and cell signaling, and these protect cells against injury (Gupta and Knowlton 2007). It is possible that the hypoxic stress stimulates the expression coordination of the HSP genes to optimize the survival response of cells under oxygen deprivation. Furthermore, the upregulation of the translation factors enhances protein synthesis and can regulate growth of cells, which is important under hypoxic stress (e.g., Tuxworth et al. 2004). In a previous paper (Fan et al. 2005), we have shown that CCH upregulated both messenger ribonucleic acid (mRNA) and protein levels of several eukaryotic translation initiation factors (Eifs), and this was most likely the basis for the hypertrophy and the change in size of cardiomyocytes. Since gene transcription is an adenosine triphosphate-expensive process in cells, the suppression of transcription to minimum levels provides substantial energy savings in anoxia (Larade and Storey 2007). One way to minimize the energy consumption in transcription is to increase the expression coordination of the translation factors, thus reducing the protein production in excess to the necessary amounts required by the functional pathways. Therefore, we determined and compared the regulatory networks of the genes encoding translation factors and HSPs in normoxia, CCH, and CIH. Moreover, for each gene encoding a translation factor or a HSP, we have identified the so-called see-saw partners in a normoxic heart. Due to similar or opposite expression coordination with thousands other genes, appropriate regulation of such a partner of an altered gene in a hypoxic heart may (in principle) contribute to the recovery of the normoxic transcriptome (Iacobas et al. 2008a).
Materials and methods
Microarray
Several litters of neonatal mice were split into nine groups and subjected to 1, 2, and 4 weeks to normal atmospheric conditions, hypoxia in which [O2] was kept constant at 11% (CCH) and hypoxia in which [O2] was switched between 21% and 11% every 4 min for the entire duration of the treatment (CIH). Four mice (two males and two females) were profiled individually for each condition (treatment and duration). A subset of 4,862 distinct, well-annotated unigenes was selected for the analyses reported in this paper. The protocol of RNA extraction, reverse transcription, fluorescent labeling, hybridization with the complementary deoxyribonucleic acid (DNA) arrays as well as data acquisition, normalization, and detection of significantly regulated genes when comparing treatments of the same duration or durations of the same treatment were fully described in our previous paper (Fan et al. 2005).
Analysis of transcriptomic maturational profiles
Depending on their regulation type when comparing the expression levels at two successive time points, the genes were classified into one neutral (i.e., no significant change in each of the two intervals: 1–2 weeks and 2–4 weeks) and eight active (i.e., with significant increase or decrease in at least one interval) maturational profiles. Then, we identified the genes with active maturational profiles in each treatment as well as the genes whose maturational profile in normal atmospheric conditions was significantly changed by exposure to hypoxia.
Analysis of expression variability and control of transcript abundance
The relative estimated variability (REV) of the transcript abundance among the biological replicas was determined as the midrange of the χ2 estimate of the coefficient of variability (Iacobas et al. 2003). Then, the genes were ordered as decreasing variability so that the first percentile (or gene expression stability score [GES]<1) contained the most unstably expressed and the 100th percentile the most stably expressed genes. Further, REV analysis was used to evaluate the change of control stringency and GES analysis to identify the genes with major changes in expression stability induced by hypoxia.
Analysis of expression coordination
The expression level of a gene at any developmental stage can be expected to be tied to those of other genes because of their involvement in processes requiring many proteins (Iacobas et al. 2007b). Two genes were considered as synergistically expressed (e.g., Eif3s4 and Eif3s3 in Fig. 1) if their expression levels increased and decreased together (positive covariance) in a set of similar samples or as antagonistically expressed (negative covariance) when they manifest opposite tendencies (e.g., Eif3s4 and Eif2ak1) and as independently expressed when their expressions are not correlated (close to zero covariance, e.g., Eif3s4 and Eif1b). In the case of four biological replicas, the (p<0.05) cutoff for synergism is a pairwise Pearson correlation coefficient ρ>0.90, for antagonism ρ<−0.90, and for independence |ρ|<0.05.
Fig. 1.
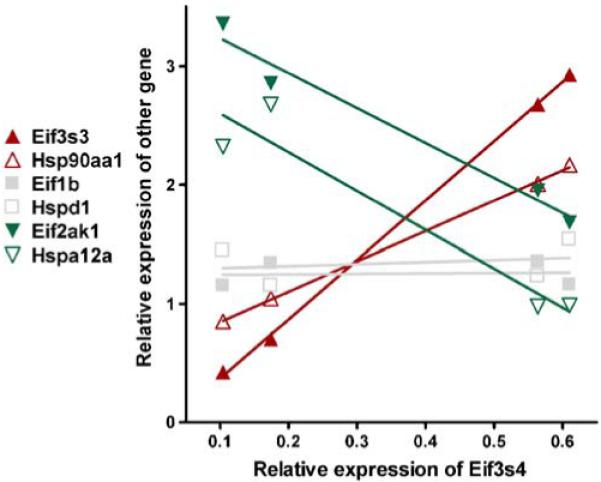
Examples of genes encoding eukaryotic transcription initiation factors (Eif) and heat shock proteins (Hsp) that are synergistically (Eif3s3 and Hsp90aa1), antagonistically (Eif2ak1 and Hspa12a), or independently (Eif1b and Hspd1) expressed with eukaryotic translation initiation factor 3, subunit 4 delta (Eif3s4) in heart of 1-week normoxic mouse. The relative expression levels in the four biological replicas of the indicated gene in the left-hand panel are plotted against those of Eif3s4. Genes: Eif1b Eukaryotic translation initiation factor 1B, Eif2ak1 eukaryotic translation initiation factor 2 alpha kinase 1, Eif3s3 eukaryotic translation initiation factor 3, subunit 3 (gamma), Eif3s4 eukaryotic translation initiation factor 3, subunit 4 (delta), Hsp90aa1 heat shock protein 90-kDa alpha (cytosolic), class A member 1, Hsp12a heat shock protein 12A, Hspd1 heat shock protein 1 (chaperonin)
Comparison of coordination profiles
The coordination profile of a gene is the set of correlation coefficients between the expression levels of that gene and those of each other gene (4,861 in this study) within the biological replicas. By computing the overlap (OVL, Iacobas et al. 2007b) of the coordination profiles, we further identified the (hereafter termed) “see-saw” partners as pairs of genes with striking likeness (OVL>80%) or opposition (OVL<−80%).
Results
Gene expression regulation depends on hypoxia pattern and gender
By comparing the expression levels in the three treatments at each time point, we found that more genes were differentially expressed in CCH compared to CIH than in either CCH or CIH with respect to the corresponding normoxia (Fig. 2a) that explains the small values of the Pearson correlation coefficients between the sets of expression ratios in CCH and CIH with respect to normoxia: 0.16, 0.14, and 0.26. Figure 2b presents examples of genes encoding eukaryotic translation (initiation or elongation) factors and HSPs with substantial differences between the expression levels in CCH compared to CIH of which more than 73% were caused by higher levels in CCH than in CIH.
Fig. 2.

Expression regulation. a Percentage of significantly regulated genes when comparing the three conditions. Note that substantial percentages of the quantified genes were differently expressed between CCH and CIH. b Examples of genes involved in translation regulation and response to stress that are differently expressed between CCH and CIH at each time point. c Gender differences in the fold change of the genes regulated by constant (CCH) and intermittent (CIH) hypoxia treatments with respect to the corresponding normoxia. Note that females responded with higher regulation at 1-week CCH and CIH and with lower regulation at 2-week CCH and CIH and 4-week CCH
It is interesting to note that although not significantly different as number and nature, the fold change of the regulated genes was higher in the female than male after 1 week hypoxia and higher in male thereafter (Fig. 2c).
Alteration of transcriptomic maturation
We found that numerous genes significantly changed their expression level during development under normal atmospheric conditions as well as in constant and intermittent hypoxia. The number of genes whose expression changed in the heart with maturation was significantly higher in both CCH and CIH when compared to normoxia. Thus, we identified 18 genes involved in aging, development, or growth whose neutral maturational profile in normoxia became active in CCH and eight genes whose active maturational profiles in normoxia were turned into neutral ones by CCH (listed in Supplementary Table 1A). Moreover, we identified eight genes encoding translation factors or HSPs with active profiles in normoxia, while this number increased to 14 in CIH and 22 in CCH (see Supplementary Table 1B).
Figure 3 presents the maturational profiles of some growth development cell cycle regulators, Eifs, HSPs, and of hypoxia-inducible factor 1 alpha subunit (Hif1a). As in the examples from Fig. 3, we found that the maturational profile of numerous other genes was differently altered by the two hypoxic treatments.
Fig. 3.

Examples of genes with significant change of maturational profile during the three treatments. a Growth-development genes. b Cell cycle regulators. c Eukaryotic translation initiation factors. For comparison, we added the profile of Hif1a. Note the similarity of maturational profiles of Hif1a and Eif4ebp2 in normoxia and CIH and the substantial difference in CCH. d Heat shock proteins. Note that each hypoxia treatment alters the maturational profiles and that the alterations are different. Genes (GO biological process): Fhl1 Four and a half LIM domains 1 (cell growth), Tbx5 T-box 5 (heart development), Tro trophinin (negative regulation of cell growth), Ccnb1 cyclin B1 (cell cycle), Pcna proliferating cell nuclear antigen (DNA replication), Mik67 antigen identified by monoclonal antibody Ki 67 (cell proliferation)
Regulation of expression variability and transcription control
Our analysis revealed an overall reduction in the expression variability (measured by the average REV value) in CCH at all three time points and in CIH at 1 and 4 weeks compared to the normoxic counterparts. However, the reduction in the expression variability was not uniform among the genes indicating differential regulation of the mechanisms involved in controlling the abundances of the corresponding transcripts. Moreover, the variability of most genes involved in growth, development, and aging had a more substantial decrease than the average gene, and therefore the GES score of these genes increased (as illustrated in Fig. 4a for 1 week CCH compared to 1 week normoxia) but showed no significant bias for Eifs and Hsps. The transcription control of Hif1a, was relaxed after the first week of CCH, restored at comparable intensity with normoxia after 2 weeks, and considerably increased after 4 weeks CCH.
Fig. 4.
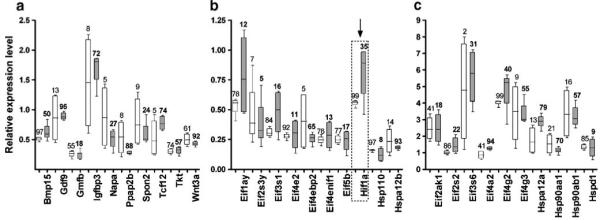
Variability of the expression levels at one week normoxia (open bars) and 1-week CCH (solid bars) of some: a growth development aging genes. b Low expressed eukaryotic translation initiation factors (Eif) and Heat shock proteins (Hsp). c High expressed Eifs and Hsps. Values on the vertical axis represent the ratio between the normalized background subtracted fluorescence signal of the probed gene transcript within the redundancy group for both slides and both channels and the average signal of all probed gene transcripts in all four samples, while values above the 95% confidence intervals (rectangles) are the GES percentiles of the respective genes. Note the nonuniform dispersion of the expression levels among the genes and the change of the expression stability in CCH (values in bold letters). Genes (GO biological process): Bmp15 Bone morphogenetic protein 15 (growth factor activity), Gdf9 growth differentiation factor 9 (growth factor activity), Gmfb glia maturation factor beta (growth factor activity), Igfbp3 insulin-like growth factor binding protein 3 (growth factor binding), Napa N-ethylmaleimide sensitive fusion protein attachment protein alpha (brain development), Ppap2b phosphatidic acid phosphatase type 2B (blood vessel development), Spon2 Spondin2 extracellular matrix (development), Tcf12 transcription factor 12 (development), Tkt transketolase (regulation of growth), Wnt3a wingless-related MMTV integration site 3A (axonogenesis)
Expression coordination
We identified for each treatment at each time point the synergome (i.e., set of synergistically expressed partners), antagome (antagonistically expressed partners), and exclusome (independently expressed partners) of each quantified gene. Supplementary Table 2 lists the percentages of the sampled transcriptome containing the significantly synergistically, antagonistically, and independently expressed partners of some Eif and Hsp genes at 1-week normoxia, CCH, and CIH. We found that, in normoxia, about 20% of the 11,817,091 distinct gene pairs that can be formed with the 4,862 quantified genes were synergistic or antagonistic partners, meaning that, on average, the expression of each heart gene is tied to those of about 20% of the sampled genome. CCH reduced the overall coordination degree to 8% and CIH to 9%. However, when the analysis is restricted to the 3,003 distinct gene pairs that can be formed with the 45 components of the translational machinery, the 32 genes involved in the heat shock response and Hif1a, the density of the interlinks increased significantly. Thus, as illustrated in Fig. 5 for 1-week treatments, CIH increased the synergistic partnership within the network by 70%, while CCH increased the synergistic partnership by fivefold and the antagonistic one by 70%. Moreover, the network was profoundly rewired by hypoxia, and the remodeling was vastly different between CIH and CCH.
Fig. 5.

a Part of the transcription networks at 1-week normoxia, CCH, and CIH. Red lines indicate synergistic expression and blue line antagonistic expression of the linked genes. Note the remodeling of the network in CIH and CCH and the substantial increase of the interlinkages among the selected genes in hypoxia
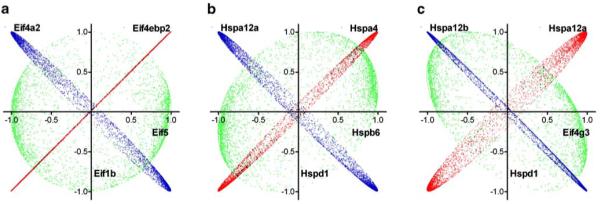
Transcriptomic “see-saws”
Although the coordination profiles of most genes are neutral to each other (−20%<OVL<20%), we found genes with striking similarity (OVL>80%) or opposition (OVL<−80%). The “see-saw” partners can be from the same functional category (examples in Fig. 6a,b) or from different functional categories (examples in Fig. 6c). Supplementary Table 3 presents the 40 most similar and opposite “see-saw” partners at 1-week normoxia among genes encoding Eifs and HSPs.
Fig. 6.
| PAIR | NORM | CIH | CCH | PAIR | NORM | CIH | CCH | PAIR | NORM | CIH | CCH |
|---|---|---|---|---|---|---|---|---|---|---|---|
| Eif5-Eif4ebp2 | 99.69 | −23.63 | −22.07 | Hspb6-Hspa4 | 95.21 | 64.22 | 63.38 | Eif4g3-Hspa12a | 91.79 | 65.13 | 69.39 |
| Eif5-Eif4a2 | −94.29 | −39.59 | −1.03 | Hspb6-Hspa12a | −94.34 | −47.48 | −31.31 | Eif4g3-Hspa12b | −96.92 | 60.25 | −47.77 |
| Eif5-Eif1b | −1.20 | 6.45 | 72.75 | Hspb6-Hspd1 | 28.54 | 68.86 | 63.57 | Eif4g3-Hspd1 | −31.69 | −87.86 | −58.58 |
Discussion
In a previous paper (Fan et al. 2005), we identified the genes and the biological processes that are regulated by CCH and CIH in cardiac development. In this paper, we continue the analysis of the microarray data aiming to understand and quantify the integrated cardiac response to the hypoxic stress of the developing mouse by determining the overall changes in the transcriptional variability, maturation, and coordination. In addition, we chose to focus on genes encoding some of the major players in the response to chronic hypoxia: the Hif1a, the components of the translational machinery, and the HSPs. Hif1a, a heterodimer predominantly regulated by oxygen-dependent post-translational hydroxylation of the alpha subunit (Stockmann and Fandrey 2006), was of particular interest for us due to its involvement in a wide diversity of biological processes (Semenza 2007), to mention a few: angiogenesis, heart looping, neural crest cell migration (Compernolle et al. 2003), positive regulation of vascular endothelial growth factor receptor signaling pathway (Schipani 2006), cell differentiation (Zelzer et al. 2004), positive regulation of erythrocyte differentiation (Yoon et al. 2006), positive regulation of transcription from RNA polymerase II promoter (Makita et al. 2005), regulation of transcription, DNA dependent (Biju et al. 2004), and response to hypoxia (Woods and Whitelaw 2002). The components of the translational machinery (i.e., Eifs and eukaryotic translation elongation factors [Eefs]) were important to analyze because protein synthesis is regulated primarily at the level of the mRNA translation (e.g., Dever 2002; Gingras et al., 1999; Wang and Proud 2007) and highly perturbed in ischemia (e.g., DeGracia 2004; van den Beucken et al. 2006). Last but not least, we chose to analyze the genes related to heat shock because they are regarded as the main protectors against severe protein alterations in stress (e.g., Jiao et al. 2008; Kwon et al. 2007).
Constant and intermittent hypoxia activates different regulatory mechanisms of gene expression
Although both hypoxia treatments regulated numerous genes located on all chromosomes and involved in a wide diversity of processes, the nature of genes and biological processes that were affected were vastly different between CCH and CIH (presented in detail in Fan et al. 2005). The peak effect was found for 2 weeks of exposure for both CCH and CIH, although increased expression of angiogenic factors such as vascular endothelial growth factor-A (Takeda et al. 2007) was detected only at 4 weeks of CCH. Considering the substantial differences between the CCH and CIH regulomes (i.e., sets of regulated genes with respect to the corresponding normoxia), we conclude that the regulatory mechanisms that are activated by the low oxygen supply depend on the hypoxia pattern. This conclusion is in agreement with that of Douglas et al. (2007) for mouse hippocampus and thalamus and of Ripamonti et al. (2006) for rat gastrocnemius muscle. The importance of the hypoxia pattern and duration for the pathophysiological responses was also revealed by other authors (e.g., Neubauer 2001; Prabhakar and Kline 2002). Moreover, since the number of regulated genes in CIH was larger than that in CCH at 1 week, comparable at 2 weeks, and smaller at 4 weeks (Fig. 2a), the differences between CCH and CIH cannot be explained by a reduced “dose” of stress in CIH that one would expect due to the alternation of normal and reduced oxygen concentration. In a common dose–effect relationship, the fold change of each gene in CIH should be smaller than in CCH, so that only part of the statistically significant regulations in CCH should be confirmed for the same duration of CIH.
Differential effects of constant and intermittent hypoxia on translation factors and heat shock proteins
Our finding that the expression levels of Eifs and Eefs were higher in CCH than in CIH in most cases may be the basis for the fact that cardiac hypertrophy exists in CCH but not in CIH (Fan et al. 2005). Moreover, due to their protective roles, the different HSPs in CCH and CIH might explain the differences in the extent of the transcriptomic alterations induced by the two hypoxia patterns.
Gender dependence of the hypoxia effects
The experimental design with two male and two female profiles for each treatment at each time point allowed us to study whether the regulation of gene expression profiles are gender dependent in the hypoxic heart (Tang et al. 2004). Similar to our findings for the kidneys of developing mice subjected to chronic hypoxia, females responded more briskly than males to the hypoxic stress (compare Fig. 2b from this report with Fig. 1d in Iacobas et al. 2006). Although there is practically no statistical significance of this finding because we compared only two males with two females at each time point and treatment, the robustness and similarity with the results obtained for the hypoxic kidneys makes it interesting. This observation of gender dependence of gene expression regulation could be important when designing therapies (e.g., Choi et al. 2007) or targeting hypoxic cells in tumors (e.g., Sovik et al. 2007; Post et al. 2007).
Chronic hypoxia alters the maturational profiles of essential genes for heart development and integrated response to stress
Although cardiomyocytes proliferate rapidly during fetal life, the heart growth shifts from hyperplasia to hypertrophy after birth, with most cardiac cells gradually ceasing to undergo DNA replication (Chen et al. 2004). In addition, heart development after birth is the result of numerous genes changing expression level (e.g., Azfer et al. 2006; Harrell et al. 2007; Plageman and Yutzey 2006; Singh et al. 2007). Therefore, we determined and compared the maturational profiles of each quantifiable gene in all three treatments, identifying the age-dependent genes and the changes induced by the hypoxic stress.
We found that hypoxia not only altered the maturational profiles of age-dependent genes but the alterations were different in CCH and CIH, pointing again to the importance of the hypoxia pattern on gene expression. Contrary to our findings in the hypoxic kidney (Iacobas et al. 2006), the number of genes whose expression changed in the heart with maturation was significantly higher in both CCH and CIH when compared to normoxia. This result indicates a faster maturation of the heart transcriptome under hypoxic conditions than in the normal atmosphere. Moreover, the synergy of the maturational profiles of essential genes for heart development (examples in Fig. 3a,b), Eifs and Hsps (Fig. 3c,d), was significantly perturbed by hypoxia. The analysis of the transcriptome maturation is particularly important because it provides information regarding the dynamics of the “transcriptomic stoichiometry” whose alteration is expected to result in major effects by introducing “bottlenecks” or/and changing the probability distribution of the outputs of certain functional pathways (Iacobas et al. 2007b). For instance, the alteration of the Eif4ebp2 profile in CCH (Fig. 3c) due to the upregulation at 2 weeks may have significant consequences because the rate-limiting event of protein synthesis is the recruitment of the 43S ribosome to the mRNA (Banko et al. 2005) for which the binding of Eif4e to the cap structure at the mRNA 5′ terminus is critical (Gingras et al. 1999). Remarkably, Eif4ebp2 had a very similar maturational profile with Hif1a in both normoxia and CIH but different in CCH.
Chronic hypoxia regulates the control of transcript abundance
Since the general transcription mechanisms should be the same among mice subjected to the same treatment but the local transcription conditions may differ from mouse to mouse, close expression levels (i.e., high GES scores) indicates less sensitivity to the environment, most probably resulting from a more stringent control by inherent homeostatic mechanisms. Thus, the gene with GES=100 has the highest control while that with GES=100/(number of quantified genes) is the least controlled one. In previous papers (e.g., Iacobas et al. 2005b; Spray and Iacobas 2007), we speculated that the very stably expressed genes might encode proteins essential for survival or/and phenotypic expression. Although the most unstably expressed genes may not be necessary or essential for the overall survival of cells, their loose control allows the cell to adapt to environmental conditions (Iacobas et al. 2007a) and therefore may be regarded as evolutionary vectors in a hostile environment.
The significant overall reduction in expression variability in hypoxic hearts as compared to the normoxic counterparts is similar to that we reported in the hypoxic kidney (Iacobas et al. 2006). This result points out that the overall transcription control was strengthened in hypoxia, presumably to further limit the expression alterations. However, the patterns of transcription control changes were different between the two hypoxia treatments indicating activation of different regulatory mechanisms. The increased transcription control of most genes involved in growth and development (indicated by larger GES values in CCH for the examples in Fig. 4a) was presumably imposed to minimize the alterations of heart morphology due to the higher effort imposed by the reduced oxygen in the atmosphere.
The interlinkage among genes encoding translation factors and heat shock proteins is substantially reduced and profoundly remodeled in chronic hypoxia
Similar to our findings in mouse brain (Iacobas et al. 2005a), the transcription of a cardiac gene appeared significantly related to that of numerous others. As illustrated in Fig. 1 for partners of Eif3s4, a gene may be synergistically, antagonistically, or independently expressed with genes whose protein products are sharing both similar and different functions. The cardiac transcriptomic network is very complex, with partial overlapping of subnetworks. Moreover, the topology of the network changed during progression to adulthood, indicating that in addition to the expression level of individual genes, the maturation affects also the gene interlinkages. With an average 20%, the coordination degree (i.e., percentage of the sampled transcriptome composed of synergistically or antagonistically expressed partners) varied within wide limits among the genes. For instance, in the case of the 55 genes listed in Supplementary Table 2, at 1-week normoxia, the coordination degree went from 0.6% for Eif1b to 42.4% for Hsp90ab1. Hsp90ab1 was also found as having the largest number of synergistically expressed partners (25.0%), Eif3s6 the largest number of antagonistically expressed ones (25.1%), and Eif1b the largest number of independently expressed (15.1%) partners. Remarkably, both CCH and CIH reduced at less than half the average coordination degree indicating a strong decoupling of gene expression induced by the hypoxic stress.
As illustrated in Fig. 5, the hypoxic stress profoundly remodeled the gene expression interlinkages. The substantial differences between the remodeling in CCH and CIH indicate once more that the constant and intermittent hypoxia activate distinct regulatory mechanisms of gene expression.
The perspective of the “transcriptomic see-saws”
We found that the striking similarity or opposition occurred not only between the coordination profiles of genes from the same (Eif–Eif, Hsp–Hsp in Fig. 6) category but also between those of genes from different categories (Eif–Hsp in Fig. 6). This does not mean that the functions of the protein product of a certain gene can be accomplished by the proteins encoded by its “see-saw” partners. Rather, it means that the partners are very similarly/oppositely coordinately expressed with thousands other genes (the sampled transcriptome), and therefore similar/opposed variation of their expression levels are expected to have similar phenotypic consequences. Thus, the identification of the “see-saw” partners of key genes (examples in Supplementary Table 3) is of practical importance since one may assume that phenotype alterations induced by the deficient expression of such a gene might be partially recovered by the upregulation of a similar partner or downregulation of an opposed one (Iacobas et al. 2007a, 2008a; Spray and Iacobas 2007). Figure 7 illustrates the “see-saw” model of the transcriptomic recovery.
Fig. 7.

The “see-saw” model of transcriptomic recovery. a. Positive (Gene Y) and negative (Gene Z) partners of gene X. Values on the two axes are the Pearson correlation coefficients between the logs of the expression levels within biological replicas of the indicated gene and each other quantified gene. b-c Predictive value of the coordination analysis. Genes that are synergistically expressed with gene X in wild-type tissues (correl with X>0) are most prone to be downregulated (negative fold change) in gene X null tissues and genes antagonistically expressed (correl with X<0) are most likely to be upregulated in X-null tissues. d Restorative effect of “see-saw” partners. Over-expression of a gene with striking similarity (Y) or underexpression of one with striking opposition (Z) as coordination profile with X in wild types are expected to have a restorative effect on gene expression levels in X-null tissues
As we proved in other papers (e.g., Iacobas et al. 2003, 2005a, b, 2007b), the synergistically expressed partners (like gene “Y” in Fig. 7) of a certain “gene X” in the wild-type tissues are most likely to be downregulated, the antagonistically expressed partners (gene “Z”) are most likely to be upregulated in the corresponding gene X null tissues, while the independently expressed partners are most likely to be not regulated in the nulls.
An indirect confirmation of the “see-saw” model of the transcriptomic recovery came recently when two promyelinating treatments were reported to increase the level of the gap junction protein Cx43 (Roscoe et al. 2007), whereas we have shown previously a significant downregulation of Cx43 in AT-EAE mouse spinal cord, an animal model of the human multiple sclerosis (Brand-Schieber et al. 2005; Iacobas et al. 2008b). In principle, the “see-saw” model can be considered as confirmed by the rescue obtained through overexpressing a positive partner or underexpressing a negative partner of the gene whose deletion caused the disease. For instance, Ahmad et al. (2007) reported that Cx26 expressed from extra alleles completely restored hearing sensitivity and prevented hair cell death in deaf Cx30−/− mice (model of human connexin30-linked deafness). Therefore, the identification of “see-saw” partners is expected to open new horizons in the gene therapy.
Supplementary Material
Acknowledgment
This research was supported by the NIH grant PO1 HD32573. All suggestions and discussion provided by Dr. David C. Spray (Albert Einstein College of Medicine) were greatly appreciated.
References
- Abe K, Tawara S, Oi K, Hizume T, Uwatoku T, Fukumoto Y, Kaibuchi K, Shimokawa H. Long-term inhibition of Rho-kinase ameliorates hypoxia-induced pulmonary hypertension in mice. J Cardiovasc Pharmacol. 2006;48(6):280–285. doi: 10.1097/01.fjc.0000248244.64430.4a. [DOI] [PubMed] [Google Scholar]
- Ahmad S, Tang W, Chang Q, Qu Y, Hibshman J, Li Y, Söhl G, Willecke K, Chen P, Lin X. Restoration of connexin26 protein level in the cochlea completely rescues hearing in a mouse model of human connexin30-linked deafness. Proc Natl Acad Sci USA. 2007;104(4):1337–1341. doi: 10.1073/pnas.0606855104. [DOI] [PMC free article] [PubMed] [Google Scholar]
- Alam I, Lewis K, Stephens JW, Baxter JN. Obesity, metabolic syndrome and sleep apnoea: all pro-inflammatory states. Obes Rev. 2007;8(2):119–127. doi: 10.1111/j.1467-789X.2006.00269.x. Review. [DOI] [PubMed] [Google Scholar]
- Azfer A, Niu J, Rogers LM, Adamski FM, Kolattukudy PE. Activation of endoplasmic reticulum stress response during the development of ischemic heart disease. Am J Physiol Heart Circ Physiol. 2006;1(3):H1411–H1420. doi: 10.1152/ajpheart.01378.2005. [DOI] [PMC free article] [PubMed] [Google Scholar]
- Baker JE. Oxidative stress and adaptation of the infant heart to hypoxia and ischemia. Antioxid Redox Signal. 2004;6(2):423–429. doi: 10.1089/152308604322899495. Review. [DOI] [PubMed] [Google Scholar]
- Banko JL, Poulin F, Hou L, DeMaria CT, Sonenberg N, Klann E. The translation repressor 4E-BP2 is critical for eIF4F complex formation, synaptic plasticity, and memory in the hippocampus. J Neurosci. 2005;25(42):9581–9590. doi: 10.1523/JNEUROSCI.2423-05.2005. [DOI] [PMC free article] [PubMed] [Google Scholar]
- Biju MP, Neumann AK, Bensinger SJ, Johnson RS, Turka LA, Haase VH. Vhlh gene deletion induces Hif-1-mediated cell death in thymocytes. Mol Cell Biol. 2004;24(20):9038–9047. doi: 10.1128/MCB.24.20.9038-9047.2004. [DOI] [PMC free article] [PubMed] [Google Scholar]
- Blais JD, Addison CL, Edge R, Falls T, Zhao H, Wary K, Koumenis C, Harding HP, Ron D, Holcik M, Bell JC. Perk-dependent translational regulation promotes tumor cell adaptation and angiogenesis in response to hypoxic stress. Mol Cell Biol. 2006;26(24):9517–9532. doi: 10.1128/MCB.01145-06. [DOI] [PMC free article] [PubMed] [Google Scholar]
- Brand-Schieber E, Werner P, Iacobas DA, Iacobas S, Beelitz M, Lowery L, Spray DC, Scemes E. Connexin43, the major gap junction protein of astrocytes, is down regulated in inflamed white matter in an animal model of multiple sclerosis. J Neurosci Res. 2005;80:768–808. doi: 10.1002/jnr.20474. [DOI] [PMC free article] [PubMed] [Google Scholar]
- Bruder ED, Lee JJ, Widmaier EP, Raff H. Microarray and real-time PCR analysis of adrenal gland gene expression in the 7-day-old rat: effects of hypoxia from birth. Physiol Genomics. 2007;29(2):193–200. doi: 10.1152/physiolgenomics.00245.2006. [DOI] [PMC free article] [PubMed] [Google Scholar]
- Camfferman D, Lushington K,O, Donoghue F, Doug McEvoy R. Obstructive sleep apnea syndrome in Prader–Willi Syndrome: an unrecognized and untreated cause of cognitive and behavioral deficits? Neuropsychol Rev. 2006;16(3):123–129. doi: 10.1007/s11065-006-9010-x. [DOI] [PubMed] [Google Scholar]
- Chen HW, Yu SL, Chen WJ, Yang PC, Chien CT, Chou HY, Li HN, Peck K, Huang CH, Lin FY, Chen JJ, Lee YT. Dynamic changes of gene expression profiles during postnatal development of the heart in mice. Heart. 2004;90(8):927–934. doi: 10.1136/hrt.2002.006734. [DOI] [PMC free article] [PubMed] [Google Scholar]
- Chiang AA. Obstructive sleep apnea and chronic intermittent hypoxia: a review. Chin J Physiol. 2006;49(5):234–243. Review. [PubMed] [Google Scholar]
- Choi UH, Ha Y, Huang X, Park SR, Chung J, Hyun DK, Park H, Park HC, Kim SW, Lee M. Hypoxia-inducible expression of vascular endothelial growth factor for the treatment of spinal cord injury in a rat model. J Neurosurg Spine. 2007;7(1):54–60. doi: 10.3171/SPI-07/07/054. [DOI] [PubMed] [Google Scholar]
- Clemens MJ. Translational regulation in cell stress and apoptosis. Roles of the eIF4E binding proteins. J Cell Mol Med. 2001;5:221–239. doi: 10.1111/j.1582-4934.2001.tb00157.x. [DOI] [PMC free article] [PubMed] [Google Scholar]
- Compernolle V, Brusselmans K, Franco D, Moorman A, Dewerchin M, Collen D, Carmeliet P. Cardia bifida, defective heart development and abnormal neural crest migration in embryos lacking hypoxia-inducible factor-1alpha. Cardiovasc Res. 2003;60(3):569–579. doi: 10.1016/j.cardiores.2003.07.003. [DOI] [PubMed] [Google Scholar]
- Covello KL, Simon MC. HIFs, hypoxia, and vascular development. Curr Top Dev Biol. 2004;62:37–54. doi: 10.1016/S0070-2153(04)62002-3. Review. [DOI] [PubMed] [Google Scholar]
- Das DK, Maulik N. Cardiac genomic response following preconditioning stimulus. Cardiovasc Res. 2006;70(2):254–263. doi: 10.1016/j.cardiores.2006.02.023. Review. [DOI] [PubMed] [Google Scholar]
- de Frutos S, Spangler R, Alo D, Bosc LV. NFATc3 mediates chronic hypoxia-induced pulmonary arterial remodeling with alpha-actin up-regulation. J Biol Chem. 2007;282(20):15081–15089. doi: 10.1074/jbc.M702679200. [DOI] [PMC free article] [PubMed] [Google Scholar]
- DeGracia DJ. Acute and persistent protein synthesis inhibition following cerebral reperfusion. J Neurosci Res. 2004;77(6):771–776. doi: 10.1002/jnr.20225. Review. [DOI] [PubMed] [Google Scholar]
- Dever TE. Gene-specific regulation by general translation factors. Cell. 2002;108:545–556. doi: 10.1016/s0092-8674(02)00642-6. [DOI] [PubMed] [Google Scholar]
- Douglas RM, Miyasaka N, Takahashi K, Latuszek-Barrantes A, Haddad GG, Hetherington HP. Chronic intermittent but not constant hypoxia decreases NAA/Cr ratios in neonatal mouse hippocampus and thalamus. Am J Physiol Regul Integr Comp Physiol. 2007;292(3):R1254–R1259. doi: 10.1152/ajpregu.00404.2006. [DOI] [PubMed] [Google Scholar]
- Dursunoglu D, Dursunoglu N. Cardiovascular diseases in obstructive sleep apnea. Tuberk Toraks. 2006;54(4):382–396. Review. [PubMed] [Google Scholar]
- Fan C, Iacobas DA, Zhou D, Chen Q, Lai JK, Gavrialov O, Haddad GG. Gene expression and phenotypic characterization of mouse heart after chronic constant or intermittent hypoxia. Physiol Genomics. 2005;22(3):292–307. doi: 10.1152/physiolgenomics.00217.2004. [DOI] [PMC free article] [PubMed] [Google Scholar]
- Festen DA, de Weerd AW, van den Bossche RA, Joosten K, Hoeve H, Hokken- Koelega AC. Sleep-related breathing disorders in prepubertal children with Prader–Willi syndrome and effects of growth hormone treatment. J Clin Endocrinol Metab. 2006;91(12):4911–4915. doi: 10.1210/jc.2006-0765. [DOI] [PubMed] [Google Scholar]
- Gingras AC, Raught B, Sonenberg N. eIF4 initiation factors: effectors of mRNA recruitment to ribosomes and regulators of translation. Annu Rev Biochem. 1999;68:913–963. doi: 10.1146/annurev.biochem.68.1.913. [DOI] [PubMed] [Google Scholar]
- Goh SH, Josleyn M, Lee YT, Danner RL, Gherman RB, Cam MC, Miller JL. The human reticulocyte transcriptome. Physiol Genomics. 2007;30(2):172–178. doi: 10.1152/physiolgenomics.00247.2006. [DOI] [PubMed] [Google Scholar]
- Gupta S, Knowlton AA. HSP60 trafficking in adult cardiac myocytes: role of the exosomal pathway. Am J Physiol Heart Circ Physiol. 2007;292(6):H3052–H3056. doi: 10.1152/ajpheart.01355.2006. [DOI] [PubMed] [Google Scholar]
- Harrell MD, Harbi S, Hoffman JF, Zavadil J, Coetzee WA. Large-scale analysis of ion channel gene expression in the mouse heart during perinatal development. Physiol Genomics. 2007;28(3):273–283. doi: 10.1152/physiolgenomics.00163.2006. [DOI] [PubMed] [Google Scholar]
- Hu CJ, Iyer S, Sataur A, Covello KL, Chodosh LA, Simon MC. Differential regulation of the transcriptional activities of hypoxia-inducible factor 1 alpha (HIF-1alpha) and HIF-2alpha in stem cells. Mol Cell Biol. 2006;26(9):3514–3526. doi: 10.1128/MCB.26.9.3514-3526.2006. [DOI] [PMC free article] [PubMed] [Google Scholar]
- Iacobas DA, Urban-Maldonado M, Iacobas S, Scemes E, Spray DC. Array analysis of gene expression in connexin-43 null astrocytes. Physiol Genomics. 2003;15(3):177–190. doi: 10.1152/physiolgenomics.00062.2003. [DOI] [PMC free article] [PubMed] [Google Scholar]
- Iacobas DA, Iacobas S, Urban-Maldonado M, Spray DC. Sensitivity of the brain transcriptome to connexin ablation. Biochim Biophys Acta. 2005a;1711:183–196. doi: 10.1016/j.bbamem.2004.12.002. [DOI] [PubMed] [Google Scholar]
- Iacobas DA, Iacobas S, Li WEI, Zoidl G, Dermietzel R, Spray DC. Genes controlling multiple functional pathways are transcriptionally regulated in connexin43 null mouse heart. Physiol Genomics. 2005b;20:211–223. doi: 10.1152/physiolgenomics.00229.2003. [DOI] [PubMed] [Google Scholar]
- Iacobas DA, Fan C, Iacobas S, Spray DC, Haddad GG. Transcriptomic changes in developing kidney exposed to chronic hypoxia. Biochem Biophys Res Commun. 2006;349(1):329–338. doi: 10.1016/j.bbrc.2006.08.056. [DOI] [PubMed] [Google Scholar]
- Iacobas DA, Iacobas S, Spray DC. Connexin43 and the brain transcriptome of the newborn mice. Genomics. 2007a;89(1):113–123. doi: 10.1016/j.ygeno.2006.09.007. [DOI] [PMC free article] [PubMed] [Google Scholar]
- Iacobas DA, Iacobas S, Spray DC. Connexin-dependent transcriptomic networks in mouse brain. Prog Biophys Mol Biol. 2007b;94(1–2):169–185. doi: 10.1016/j.pbiomolbio.2007.03.015. [DOI] [PubMed] [Google Scholar]
- Iacobas DA, Iacobas S, Werner P, Scemes E, Spray DC. Alteration of transcriptomic networks in adoptive transfer experimental autoimmune encephalomyelitis. Front Integr Neurosci. 2008a;1:10. doi: 10.3389/neuro.07.010.2007. DOI 10.3389/neuro.07/010.2007. [DOI] [PMC free article] [PubMed] [Google Scholar]
- Iacobas DA, Iacobas S, Urban-Maldonado M, Scemes E, Spray DC. Similar transcriptomic alterations in Cx43 knock-down and knock-out astrocytes. Cell Commun Adhes. 2008b;15 doi: 10.1080/15419060802014222. DOI 10.1080/1541906082014222. [DOI] [PMC free article] [PubMed] [Google Scholar]
- Jain V. Clinical perspective of obstructive sleep apnea-induced cardiovascular complications. Antioxid Redox Signal. 2007;9(6):701–710. doi: 10.1089/ars.2007.1558. Review. [DOI] [PubMed] [Google Scholar]
- Jiao JD, Garg V, Yang B, Hu K. Novel functional role of heat shock protein 90 in ATP-sensitive K+ channel-mediated hypoxic preconditioning. Cardiovasc Res. 2008;77(1):126–133. doi: 10.1093/cvr/cvm028. [DOI] [PubMed] [Google Scholar]
- Kodde IF, van der Stok J, Smolenski RT, de Jong JW. Metabolic and genetic regulation of cardiac energy substrate preference. Comp Biochem Physiol A Mol Integr Physiol. 2007;146(1):26–39. doi: 10.1016/j.cbpa.2006.09.014. Review. [DOI] [PubMed] [Google Scholar]
- Krieg AJ, Hammond EM, Giaccia AJ. Functional analysis of p53 binding under differential stresses. Mol Cell Biol. 2006;26(19):7030–7045. doi: 10.1128/MCB.00322-06. [DOI] [PMC free article] [PubMed] [Google Scholar]
- Kwon JH, Kim JB, Lee KH, Kang SM, Chung N, Jang Y, Chung JH. Protective effect of heat shock protein 27 using protein transduction domain-mediated delivery on ischemia/reperfusion heart injury. Biochem Biophys Res Commun. 2007;363(2):399–404. doi: 10.1016/j.bbrc.2007.09.001. [DOI] [PubMed] [Google Scholar]
- Kulshreshtha R, Ferracin M, Wojcik SE, Garzon R, Alder H, Agosto-Perez FJ, Davuluri R, Liu CG, Croce CM, Negrini M, Calin GA, Ivan M. A microRNA signature of hypoxia. Mol Cell Biol. 2007;27(5):1859–1867. doi: 10.1128/MCB.01395-06. [DOI] [PMC free article] [PubMed] [Google Scholar]
- Larade K, Storey KB. Arrest of transcription following anoxic exposure in a marine mollusc. Mol Cell Biochem. 2007;303(1–2):243–249. doi: 10.1007/s11010-007-9468-8. [DOI] [PubMed] [Google Scholar]
- Launois-Rollinat S. Harmful effects of chronic intermittent hypoxia. Rev Mal Respir. 2006;23(Spec No 2):7S116–7S119. Review (in French) [PubMed] [Google Scholar]
- Makita T, Duncan SA, Sucov HM. Retinoic acid, hypoxia, and GATA factors cooperatively control the onset of fetal liver erythropoietin expression and erythropoietic differentiation. Dev Biol. 2005;280(1):59–72. doi: 10.1016/j.ydbio.2005.01.001. [DOI] [PubMed] [Google Scholar]
- Mense SM, Sengupta A, Zhou M, Lan C, Bentsman G, Volsky DJ, Zhang L. Gene expression profiling reveals the profound upregulation of hypoxia-responsive genes in primary human astrocytes. Physiol Genomics. 2006;25(3):435–449. doi: 10.1152/physiolgenomics.00315.2005. [DOI] [PubMed] [Google Scholar]
- Morecroft I, Dempsie Y, Bader M, Walther DJ, Kotnik K, Loughlin L, Nilsen M, MacLean MR. Effect of tryptophan hydroxylase 1 deficiency on the development of hypoxia-induced pulmonary hypertension. Hypertension. 2007;49(1):232–236. doi: 10.1161/01.HYP.0000252210.58849.78. [DOI] [PubMed] [Google Scholar]
- Neubauer JA. Invited review: physiological and pathophysiological responses to intermittent hypoxia. J Appl Physiol. 2001;90:1593–1599. doi: 10.1152/jappl.2001.90.4.1593. [DOI] [PubMed] [Google Scholar]
- Ng DK, Chan C, Chow AS, Chow P, Kwok K. Childhood sleep-disordered breathing and its implications for cardiac and vascular diseases. J Paediatr Child Health. 2005;41(12):640–646. doi: 10.1111/j.1440-1754.2005.00751.x. Review. [DOI] [PubMed] [Google Scholar]
- O’Reilly P, Bailey W. Long-term continuous oxygen treatment in chronic obstructive pulmonary disease: proper use, benefits and unresolved issues. Curr Opin Pulm Med. 2007;13(2):120–124. doi: 10.1097/MCP.0b013e32802c7cfe. Review. [DOI] [PubMed] [Google Scholar]
- Paddenberg R, Stieger P, von Lilien AL, Faulhammer P, Goldenberg A, Tillmanns HH, Kummer W, Braun-Dullaeus RC. Rapamycin attenuates hypoxia-induced pulmonary vascular remodeling and right ventricular hypertrophy in mice. Respir Res. 2007;24(8):15. doi: 10.1186/1465-9921-8-15. [DOI] [PMC free article] [PubMed] [Google Scholar]
- Parati G, Lombardi C, Narkiewicz K. Sleep apnea: epidemiology, pathophysiology and relation to cardiovascular risk. Am J Physiol Regul Integr Comp Physiol. 2007;293(4):R1671–1683. doi: 10.1152/ajpregu.00400.2007. Review. [DOI] [PubMed] [Google Scholar]
- Park AM, Nagase H, Kumar SV, Suzuki YJ. Effects of intermittent hypoxia on the heart. Antioxid Redox Signal. 2007;9(6):723–729. doi: 10.1089/ars.2007.1460. Review. [DOI] [PubMed] [Google Scholar]
- Penaloza D, Arias-Stella J. The heart and pulmonary circulation at high altitudes: healthy highlanders and chronic mountain sickness. Circulation. 2007;115(9):1132–1146. doi: 10.1161/CIRCULATIONAHA.106.624544. Review. [DOI] [PubMed] [Google Scholar]
- Plageman TF, Jr, Yutzey KE. Microarray analysis of Tbx5-induced genes expressed in the developing heart. Dev Dyn. 2006;235(10):2868–2880. doi: 10.1002/dvdy.20923. [DOI] [PubMed] [Google Scholar]
- Plante GE. Sleep and vascular disorders. Metabolism. 2006;55(10 Suppl 2):S45–S49. doi: 10.1016/j.metabol.2006.07.013. Review. [DOI] [PubMed] [Google Scholar]
- Polotsky VY, O’Donnell CP. Genomics of sleep-disordered breathing. Proc Am Thorac Soc. 2007;4(1):121–126. doi: 10.1513/pats.200606-134JG. Review. [DOI] [PubMed] [Google Scholar]
- Post DE, Sandberg EM, Kyle MM, Devi NS, Brat DJ, Xu Z, Tighiouart M, Van Meir EG. Targeted cancer gene therapy using a hypoxia inducible factor dependent oncolytic adenovirus armed with interleukin-4. Cancer Res. 2007;67(14):6872–6881. doi: 10.1158/0008-5472.CAN-06-3244. [DOI] [PMC free article] [PubMed] [Google Scholar]
- Prabhakar NR, Kline DD. Ventilatory changes during intermittent hypoxia: importance of pattern and duration. High Alt Med Biol. 2002;3:195–204. doi: 10.1089/15270290260131920. [DOI] [PubMed] [Google Scholar]
- Ripamonti M, Vigano A, Moriggi M, Milano G, von Segesser LK, Samaja M, Gelfi C. Cytochrome c oxidase expression in chronic and intermittent hypoxia rat gastrocnemius muscle quantitated by CE. Electrophoresis. 2006;27(19):3897–3903. doi: 10.1002/elps.200600104. [DOI] [PubMed] [Google Scholar]
- Roscoe A, Messersmith E, Meyer-Franke A, Wipke SJ, Karlik SJ. Connexin 43 gap junction proteins are up-regulated in remyelinating spinal cord. J Neurosci Res. 2007;85:945–953. doi: 10.1002/jnr.21194. [DOI] [PubMed] [Google Scholar]
- Schipani E. Hypoxia and HIF-1alpha in chondrogenesis. Ann NY Acad Sci. 2006;1068:66–73. doi: 10.1196/annals.1346.009. Review. [DOI] [PubMed] [Google Scholar]
- Semenza GL. Hypoxia-inducible factor 1 (HIF-1) pathway. Sci STKE. 2007;407:cm8. doi: 10.1126/stke.4072007cm8. Review. [DOI] [PubMed] [Google Scholar]
- Singh AV, Knudsen KB, Knudsen TB. Integrative analysis of the mouse embryonic transcriptome. Bioinformation. 2007;1(10):406–413. doi: 10.6026/97320630001406. [DOI] [PMC free article] [PubMed] [Google Scholar]
- Sovik A, Malinen E, Skogmo HK, Bentzen SM, Bruland OS, Olsen DR. Radiotherapy adapted to spatial and temporal variability in tumor hypoxia. Int J Radiat Oncol Biol Phys. 2007;68(5):1496–1504. doi: 10.1016/j.ijrobp.2007.04.027. [DOI] [PubMed] [Google Scholar]
- Spray DC, Iacobas DA. Organizational principles of the connexin-related brain transcriptome. J Membr Biol. 2007;218:39–47. doi: 10.1007/s00232-007-9049-5. [DOI] [PubMed] [Google Scholar]
- Stockmann C, Fandrey J. Hypoxia-induced erythropoietin production: a paradigm for oxygen-regulated gene expression. Clin Exp Pharmacol Physiol. 2006;33(10):968–979. doi: 10.1111/j.1440-1681.2006.04474.x. Review. [DOI] [PubMed] [Google Scholar]
- Takeda K, Cowan A, Fong GH. Essential role for prolyl hydroxylase domain protein 2 in oxygen homeostasis of the adult vascular system. Circulation. 2007;116(7):774–781. doi: 10.1161/CIRCULATIONAHA.107.701516. [DOI] [PubMed] [Google Scholar]
- Tang Z, McGowan BS, Huber SA, McTiernan CF, Addya S, Surrey S, Kubota T, Fortina P, Higuchi Y, Diamond MA, Wyre DS, Feldman AM. Gene expression profiling during the transition to failure in TNF-alpha over-expressing mice demonstrates the development of autoimmune myocarditis. J Mol Cell Cardiol. 2004;36(4):515–530. doi: 10.1016/j.yjmcc.2004.01.008. [DOI] [PubMed] [Google Scholar]
- Teran Santos J, Alonso Alvarez ML, Cordero Guevara J, Ayuela Azcarate JM, Monserrat Canal JM. Sleep apnea–hypopnea syndrome and the heart. Rev Esp Cardiol. 2006;59(7):718–724. doi: 10.1157/13091373. Review (in Spanish) [DOI] [PubMed] [Google Scholar]
- Tuxworth WJ, Jr, Saghir AN, Spruill LS, Menick DR, McDermott PJ. Regulation of protein synthesis by eIF4E phosphorylation in adult cardiocytes: the consequence of secondary structure in the 5¢-untranslated region of mRNA. Biochem J. 2004;378(Pt 1):73–82. doi: 10.1042/BJ20031027. [DOI] [PMC free article] [PubMed] [Google Scholar]
- van den Beucken T, Koritzinsky M, Wouters BG. Translational control of gene expression during hypoxia. Cancer Biol Ther. 2006;5(7):749–755. doi: 10.4161/cbt.5.7.2972. [DOI] [PubMed] [Google Scholar]
- Venardos KM, Kaye DM. Myocardial ischemia-reperfusion injury, antioxidant enzyme systems, and selenium: a review. Curr Med Chem. 2007;14(14):1539–1549. doi: 10.2174/092986707780831078. Review. [DOI] [PubMed] [Google Scholar]
- Wang X, Proud CG. Methods for studying signal-dependent regulation of translation factor activity. Methods Enzymol. 2007;431:113–142. doi: 10.1016/S0076-6879(07)31007-0. Review. [DOI] [PubMed] [Google Scholar]
- Woods SL, Whitelaw ML. Differential activities of murine single minded 1 (SIM1) and SIM2 on a hypoxic response element. Cross-talk between basic helix–loop–helix/per-Arnt–Sim homology transcription factors. J Biol Chem. 2002;277(12):10236–10243. doi: 10.1074/jbc.M110752200. [DOI] [PubMed] [Google Scholar]
- Yoon D, Pastore YD, Divoky V, Liu E, Mlodnicka AE, Rainey K, Ponka P, Semenza GL, Schumacher A, Prchal JT. Hypoxia-inducible factor-1 deficiency results in dysregulated erythropoiesis signaling and iron homeostasis in mouse development. J Biol Chem. 2006;281(35):25703–25711. doi: 10.1074/jbc.M602329200. [DOI] [PubMed] [Google Scholar]
- Zelzer E, Mamluk R, Ferrara N, Johnson RS, Schipani E, Olsen BR. VEGFA is necessary for chondrocyte survival during bone development. Development. 2004;131(9):2161–2171. doi: 10.1242/dev.01053. [DOI] [PubMed] [Google Scholar]
- Zhou D, Xue J, Gavrialov O, Haddad GG. Na+/H+ exchanger 1 deficiency alters gene expression in mouse brain. Physiol Genomics. 2004;18(3):331–339. doi: 10.1152/physiolgenomics.00076.2004. [DOI] [PubMed] [Google Scholar]
Associated Data
This section collects any data citations, data availability statements, or supplementary materials included in this article.