Abstract
The conformational changes in elastinlike polypeptides (ELPs) grafted to a solid/solution interface via different architectures were studied using surface plasmon resonance spectroscopy and surface plasmon field-enhanced fluorescence spectroscopy (SPFS). SPFS provides a simple and convenient optical method to study the influence of the grafting method and the graft density on the conformational changes in ELPs at the solid-solution interface as a function of environmental variables. A typical response of the ELP, consistent with its stimuli responsiveness, was a gradual collapse upon increasing the ionic strength; this effect was inversely correlated with the surface graft density of the ELP.
I. INTRODUCTION
Recent years have seen an increasing demand for technologically advanced, smart materials, which can sense an external stimulus and respond with the appropriate (re)action. Protein-based polymers, which are composed of repeat units of natural or unnatural amino acids, have recently emerged as a promising new class of stimulus-responsive materials.1 These repetitive biopolymers exhibit conformational and aggregational sensitivities to environmental parameters such as temperature, ionic strength, pH, or their redox state.2 Their ability to undergo conformational changes or even cooperative phase transitions is useful for a variety of biomedical applications such as the design of biomaterials,3,4 drug delivery vehicles,5 chromatographic supports,6 or molecular switches to control protein-ligand interactions.7
Elastinlike polypeptides (ELPs) are biopolymers comprised of elastin-based repeat motifs such as (Val-Pro-Gly-Xaa-Gly), with the “guest residue,” Xaa, being any amino acid except Pro. This is a naturally occurring sequence in the protein elastin contained in muscle, ligaments, cartilage, and numerous other soft tissues.8 ELPs belong to a class of stimuli-responsive polymers (SRPs), which in aqueous solution undergo a transition, at a lower critical solution temperature (LCST). Below this LCST, ELPs are hydrophilic and soluble in aqueous solution, but upon raising the temperature above their LCST, ELPs become hydrophobic and aggregate in solution, ultimately leading to the formation of a coacervate phase. The LCST transition is reversible, and upon lowering the temperature below the LCST, the polymer redissolves. Experimental and computational evidences suggest that the phase transition induced conformational changes in ELPs (from a disordered, random hydrophilic coil to a more ordered, collapsed hydrophobic globule9) includes the loss of water molecules of hydrophobic hydration, that provide the thermodynamic driving force for the inverse phase transition with increasing temperature.10 In contrast to heat-induced protein denaturation, which results in disordered structures, coacervation of elastin polypeptides has been shown to promote the formation of well ordered filamentous structures.11 The critical temperature at which this transition occurs is a function of the amino acid sequence, the molecular weight, the concentration, the ionic strength, the pH, or the redox state of the ELP. The transition is completely reversible upon cooling.2 The LCST transition of ELPs can also be isothermally triggered by other external stimuli such as changes in ionic strength,12 pH,13 electric field,14 light,15 or the addition of chemical or biological analytes.16,17
ELPs are also very attractive for many interfacial applications that require molecular level control of polymer properties because they are genetically encodable. This allows for control of important macromolecular properties such as sequence, chain length, and stereochemistry by heterologous overexpression from a synthetic gene to an extent that is impossible with synthetic polymers. Furthermore, the type, number, and location of reactive sites on the polypeptide chain can also be precisely specified, which allows for the control of the grafting density of these polypeptides to the surface.18 The controlled immobilization of stimuli-responsive biomacromolecules, such as ELPs, on solid surfaces at the nanometer-length scale is of practical interest because it will enable the fabrication of smart interfaces for various biomedical applications.19 These technological applications of ELPs and other environmentally responsive polymers require a detailed elucidation of the factors that likely control the interfacial phase transition, such as chain length of the polymer, its surface density, the method of coupling, the interfacial energy, chemistry of the substrate, etc., and provide the motivation for this study.18
In this article, we quantify, in situ, the stretching and collapse behavior of surface-grafted genetically engineered stimuli-responsive ELP chains in the aqueous phase. In particular, we have focused on the effect of graft density on the stretching behavior of ELP brushes and quantify the ionic strength dependence of the brush layer thickness These in situ studies were carried out by a unique combination of surface combination resonance (SPR) spectroscopy and surface plasmon enhanced fluorescence spectroscopy /(SPFS). This unique combination of spectroscopic tools, reveals the conformational collapse of ELPs in response to their environmentally triggered desolvation as a function of the graft density, with implications that are relevant to the broad class of SRPs.
II. EXPERIMENTAL SECTION
A. Materials
Alexa Fluor 647 protein labeling Kit (A-20173) and Alexa Fluor 647 C2-maleimide were purchased from Molecular Probes. Alexa Fluor 647 C2-maleimide was dissolved in dimethyl sulfoxide at a concentration of 6.7 mM. The oligo ethylene-glycol terminated alkane thiol with a COOH terminal: HS–C11–(CH2–CH2–O)–OCH2–COOH (termed COOH-EG6 thiol) was purchased from Prochimia, and prepared in ethanol at a concentration of 1 mM. N-ethyl-N′-(dimethylaminopropyl) carbodiimide (EDC), purchased from Sigma-Aldrich and N-hydroxysuccinimide (NHS), obtained from Perbio Science GmbH, Germany, were individually dissolved in water at a concentration of 75 and 11.5 mg/ml, respectively, and stored in 500 µl aliquots at −20 °C until use. Solutions with different ionic strengths were prepared by adding NaCl to 0.01M phosphate buffer (pH=7.6). All other reagents were purchased from Sigma-Aldrich. Buffers were prepared using ultrapure water (18 MΩ cm).
B. ELP synthesis
The ELP used in this study has a molecular weight of 71.9 kDa and contains 180 repeats of the five amino acids Val-Pro-Gly-Xaa-Gly, where Xaa are the three “guest’ residues: Val, Ala, and Gly in a 5:2:3 ratio. The ELP also contains the N-terminal leader sequence, Ser-Lys-Gly-Pro-Gly, which provides two amine groups (N-terminal amine and the amine side chain of the Lys residue) for attachment of fluorophores presenting a reactive ester or for covalent attachment to COOH-derivatized self-assembled monolayers (SAMs) on gold, and a C-terminal trailer sequence, Trp-Pro-Cys, which provides a thiol group at the C-terminus for covalent modification by a maleimide derivatized fluorophore or for direct self-assembly of the ELP via chemisorption of the ELP via its thiol to the surface. The ELP was synthesized by overexpression of a plasmid-borne synthetic gene of the ELP in E. coli. by a hyperexpression protocol20 and were purified by inverse transition cycling, as described elsewhere.20,21
C. Fluorescence labeling of ELPs
The surface fluorophore was selected so as to allow for an efficient excitation by the laser light source used in these experiments (λ=632.8 nm). Conjugates produced with Alexa Fluor 647 dye have absorption and fluorescence emission maxima of approximately λ=650 nm and λ=668 nm, respectively, allowing for excitation by a red HeNe laser. Furthermore, Alexa Fluor 647 offers a significant improvement over many other conventional fluorophores, because it is much brighter, is more resistant to photobleaching, and rather insensitivity to the aqueous phase conditions.22
According to the needs for the two types of substrates used in these studies, i.e., bare Au and COOH-(EG)6 thiol SAMs, we prepared two different types of chromophore-functionalized ELP samples.
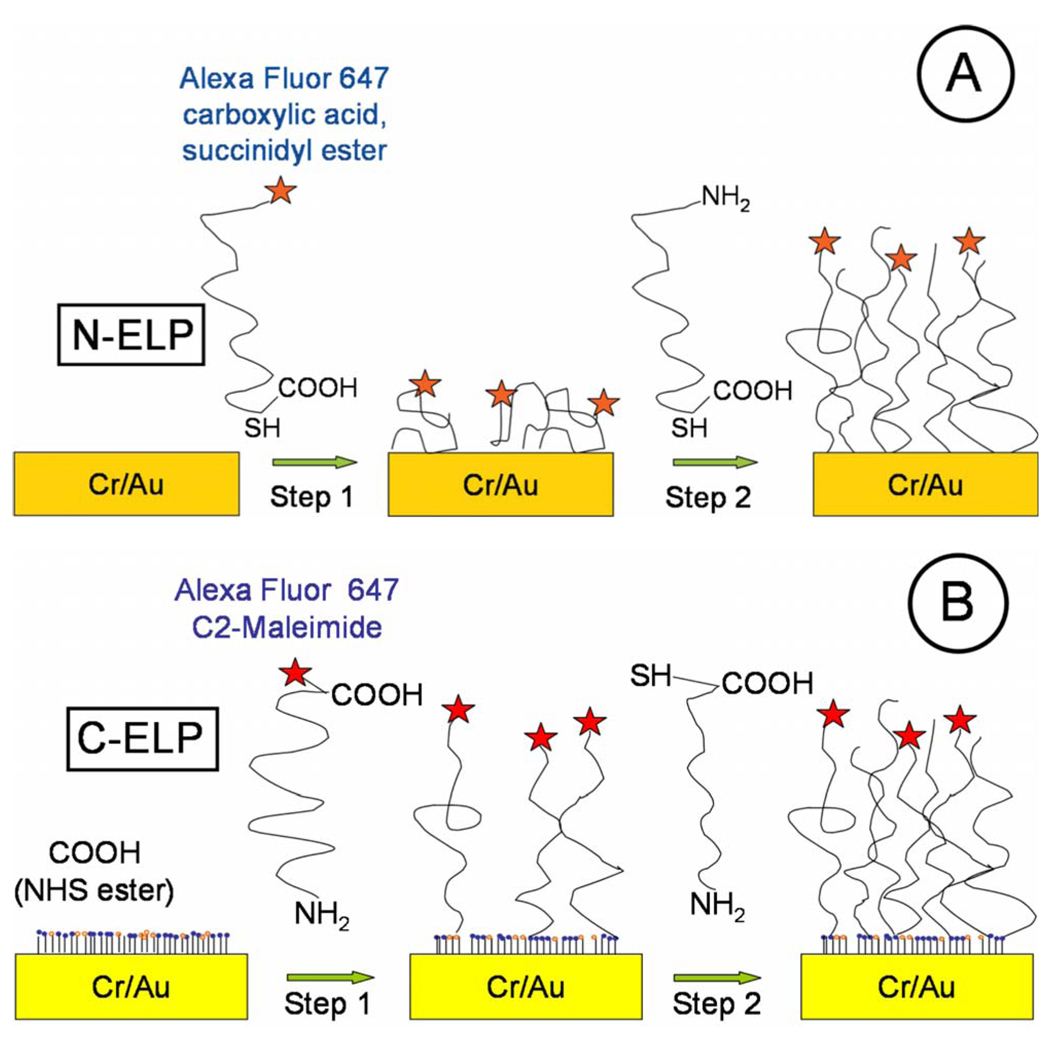
For the N-ELPs [cf. Fig. 1(a)], the amine groups in the ELPs N-terminal leader sequence were labeled with Alexa Fluor 647 protein labeling kit (A-20173) by following a standard protocol provided by Molecular Probes. The kit contains all materials needed to perform the labeling reactions as well as to purify the resulting conjugates. In the kit, the Alexa Fluor 647 contains a succinimidyl ester moiety that reacts efficiently with primary amines of the protein to form stable dye-protein conjugates. The experimental protocol for labeling 1 mg ELPs starts with the preparation of 0.5 ml ELP solution at a concentration of 2 mg/ml in PBS. 50 µl of a 1M bicarbonate solution (pH=8.3) was added to this solution in order to raise the pH of the reaction mixture, because succinimidyl ester reacts efficiently at pH=7.5–8.5. Then the ELP solution was transferred to the vial with the reactive dye and incubated while stirring with a magnetic bar for 1 h at room temperature. The spin column was then prepared by adding the purification resin suspension into the column, allowing it to settle. Next, the reaction mixture was loaded dropwise onto the center of the column, allowing the solution to adsorb to the gel bed. Finally, the elution buffer was added until the labeled protein was eluted.
For C-ELPs [cf. Fig. 1(b)], the chromophores were attached to the cysteine moiety in the C-terminal trailer sequence of the ELP. A 10 mg/ml peptide solution was prepared in PBS. After being degassed for 10 min, the ELP solution was incubated with Alexa Fluor 647 C2-maleimide, and stirred by a magnetic stirring bar. After an overnight incubation at 4 °C, an excess of mercapto-ethanol was added to react with the excess free Alexa Fluor 647 C2-maleimide probes. Finally, the fluorescently labeled C-ELPs were separated from the free fluorophores by gel filtration on the spin column described above.
FIG. 1.
Schematics of interfacial architectures of (a) N-ELP attachment on bare Au substrate and (b) C-ELP attachment on COOH-(EG)6 NHS ester SAMs. Step 1 shows the immobilization of fluorophore labeled ELPs. Step 2 shows the immobilization of unlabeled ELPs. Figure is not drawn to scale.
The concentration of N-ELPs and C-ELPs were determined spectrophotometrically by measuring the absorbance of their dilution at λ=280 nm and λ=650 nm, respectively, with an ELP extinction coefficient of 5690 cm−1 M−1 (at λ =280 nm).23 Both ELP samples were diluted to 0.1 mg/ml with 10 mM phosphate buffer (pH=7.6) before use.
D. Substrates
LaSFN9 slides (Schott, n=1.85 at λ=633 nm) were carefully cleaned sequentially with 1% HELLMANEX, ultrapure water and ethanol, respectively, coated with 2 nm chromium (Cr) followed by 50 nm of gold (Au) by thermal evaporation in a commercial instrument (Edwards). For the preparation of carboxyl terminated SAMs on the gold surface, freshly coated Cr/Au substrates were directly immersed into the HS–C11–(CH2–CH2–O)6–OCH2–COOH solution [termed COOH–(EG)6 thiol], then sealed, and kept overnight at room temperature. The substrates were removed, rinsed thoroughly with ethanol, and dry blown in a stream of nitrogen. The substrates were used immediately after preparation.
E. Surface immobilization of ELPs for stretching measurements
For the stretching experiments with ELPs we used the following grafting concept: first, chromophore labeled ELPs were immobilized on the surface and after rinsing any unbound excess (labeled) material out of the cell the dilute layer of end-grafted chains was completed to a dense brush architecture by filling the gaps between the bound labeled ELP molecules with unlabeled ELPs.
We used two different strategies to immobilize the ELPs on gold. In the first method, labeled ELPs (N-ELP) were attached to the bare gold surface from solution at a concentration of 0.01 mg/ml for 3 min, 0.04 mg/ml for 5 min, 0.1 mg/ml for 3 min, and 0.1 mg/ml for 30 min, respectively, via their cysteine end groups in order to obtain (labeled) N-ELP layers with different graft densities [cf. Fig. 1(a), step 1]. After rinsing this was followed by the incubation with unlabeled ELPs (2 mg/ml) until equilibrium was reached [Fig. 1(a), step 2].
For the second strategy, labeled C-ELPs were attached to a COOH–(EG)6 SAM [cf. Fig. 1(b), step 1] by covalent reaction, following the well-established amine-coupling protocol24 via NHS ester activation of the carboxyl groups on the thiols in the SAM. The SAMs were activated for 7 min by exposure to a fresh mixture of EDC and NHS, forming the terminal NHS ester moieties. The labeled C-ELP solution was then injected at a concentration of 0.1 mg/ml and incubated with the surface for 1 min, 3.5 h, and 3.7 h, respectively, in order to obtain dilute brush layers with different graft densities. Next, all nonspecifically bound C-ELP molecules were again removed from the surface by rinsing with a 0.05% solution of sodium dodecyl sulfate (SDS) for 10 min.25 Subsequently, unlabeled C-ELPs (2 mg/ml) were added to react with the remaining NHS ester groups on the SAMs overnight [Fig. 1(b), step 2]. All procedures described above were followed by rinsing with 10 mM phosphate buffer (pH=7.6).
The SPFS setup is based on a homebuilt surface plasmon spectrometer and has been described in detail elsewhere.26 In addition to the reflectivity data obtained by conventional SPR measurements parallel fluorescence intensity recordings were taken. All measurements were done at room temperature.
F. Stimulus response of ELPs triggered by changes in ionic strength
The ionic strength dependent structural characterization of the ELP brushes was done with dye-labeled C-ELP layer obtained via the amine-coupling protocol mentioned above. The EDC/NHS activated COOH–(EG)6 SAMs were incubated with C-ELPs at a concentration of 0.1 mg/ml for 9 min and 3 h, 0.4 mg/ml for 21 h, and 2 mg/ml for 24 h, respectively, in order to obtain C-ELP brushes with different graft densities. Next, all nonspecifically bound ELP molecules were removed from the surface by rinsing with a 0.05% solution of SDS for 10 min. Unreacted NHS ester moieties were capped with 1M ethanolamine (pH=8.5) for 3 min. Finally, the nonspecifically bound ethanolamine was eliminated from the surface by flushing with 0.1M HCl. The equilibrium configuration of the C-ELP matrices was studied as a function of ionic strength by stepwise changing the solution conditions from low ionic strength (0.001M) to high ionic strength (2.7M) through 0.01 mM, 0.2M, 0.5M, 1.3M, 1.7M, and 2.2M. while the solution pH was fixed at pH=7.6.
By the SPFS measurements, the variation of the fluorescence intensity following any ELP conformational changes can be recorded either by comparing a series of reflectivity scans together with fluorescence intensity angular scans or from the fluorescence kinetic curves measured as a function of time at a fixed laser incidence angle while varying the stimuli conditions. Any positive shift of the surface plasmon angular position results in a decrease in the reflected light intensity, which is used to excite the fluorophores. Due to this fluorescence “detuning” effect the fluorescence intensity at a fixed angle of observation does not scale linearly with the thickness of the adsorbed layer, and the fluorescence kinetic curves will be distorted if one is dealing with data analysis of thickness dependent fluorescence measurements. As a result, the comparison of a series of angular reflectivity and fluorescence intensity scans was preferred for these investigations. For the four grafted surfaces with different ELP densities, angular scan curves were recorded (Fig. 8 for an ELP graft density of d=2.3 nm as an example) after the collapse reached equilibrium. Subsequently, the peak intensities of the fluorescence curves were taken at different ionic strength conditions, normalized and plotted as a function of ionic strength for comparison. Furthermore, the stimulus response (different ionic strength conditions) of the fluorescence emission of free Alexa Fluor 647 C2-maleimide dissolved in solution was measured as a control. Alexa Fluor 647 C2-maleimide, dissolved at a concentration of 8 µM, was excited at λ=647 nm, and the fluorescence emission was collected at λ=670 nm.
FIG. 8.
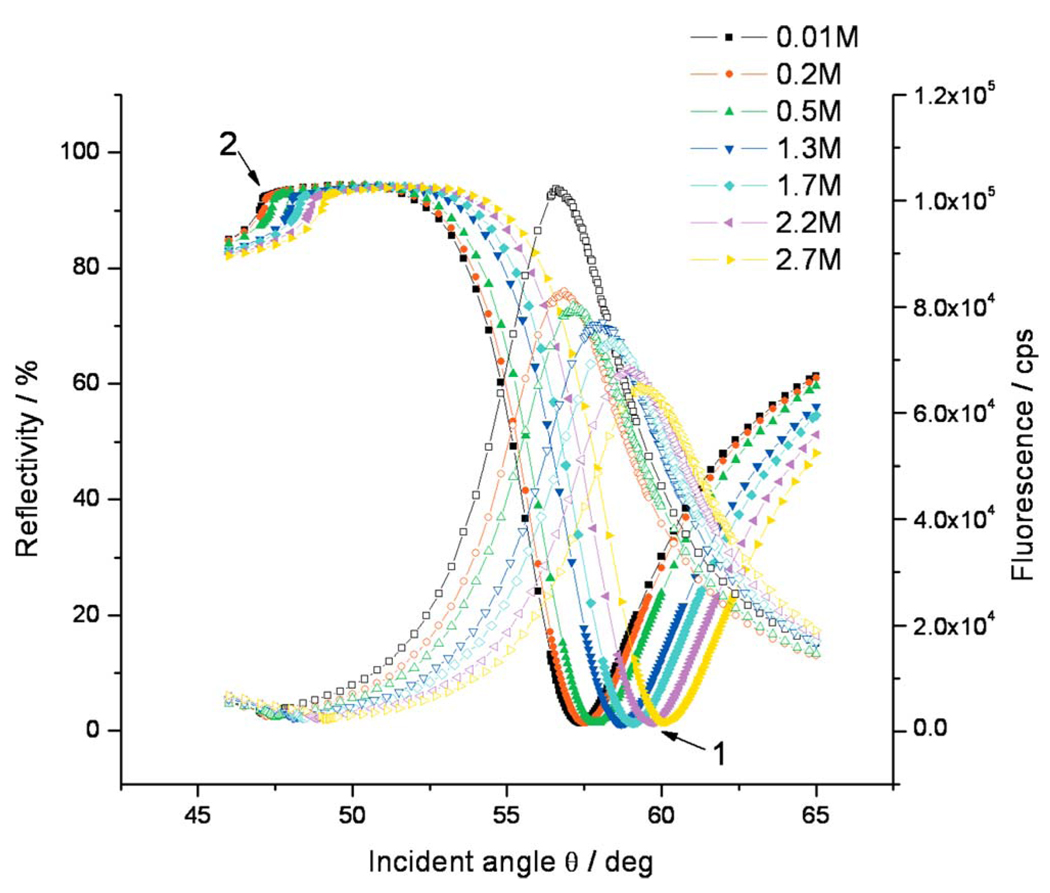
Angular dependences of the reflectivity (solid symbols) and the simultaneously measured fluorescence intensities (open symbols) for C-ELPs grafted on COOH-(EG)6 SAM NHS ester with graft thickness of d=2.3 nm at different ionic strength conditions. The solution ionic strength was changed from 0.001M to 2.7M. “1” and “2” indicate the dip angle and critical angle positions of reflectivity curves.
III. RESULTS AND DISCUSSIONS
In this study, we chose two types of grafting processes (cf. Fig. 1). In the first approach, the thiol group of a unique C-terminal cysteine on an ELP (termed N-ELP) was used to directly graft the ELP chains directly to the Au substrate by chemisorption to a variable submonolayer density [cf. Fig. 1(a)]. Prior to chemisorption, the N-ELP was labeled with an Alexa Fluor 647 fluorophore at the N-terminus (cf. below). The surface was then incubated with unlabeled N-ELP to backfill the surface, leading to a complete and rather dense monolayer brush of ELP.
The second type of grafted ELP (C-ELP) was prepared by covalently attaching an ELP though its amine end groups to the COOH groups of an oligoethyleneglycol SAM as follows: first, a SAM of a COOH-(EG)6 thiol) [cf. Fig. 1(b)] was prepared on gold. We chose an COOH-(EG)6 thiol SAM on gold as the base layer to attach the ELP because it has been used successfully to resist protein adsorption,27 so that “nonspecific” interactions of ELP with the surface, we hypothesized, would be minimized by this coupling strategy. Minimizing the nonspecific interactions of the ELP with the underlying surface is important, because it could result in irreversibility in the environmentally triggered interfacial behavior of the grafted ELP. Next, the ELP was functionalized at its C-terminus with Alexa Fluor 647 via a C2-maleimide group that was reacted with the cysteine group on the ELP. Then, ELP grafts with a low graft density were prepared by reacting the fluorophore-labeled ELPs with the activated COOH groups of the COOH-terminated (EG)6-alkanethiol SAM on gold via reaction between the amine groups that are solely located on the N-terminus of the ELP chains to the (activated) carboxyl groups presented by the SAM. The maximum brush density was then obtained by carrying the grafting process to completion with unlabeled ELP molecules (coupling again covalently to the NHS active ester groups on the surface of the SAM).
We used a combination of two optical evanescent spectroscopic techniques to characterize the two different interfacial architectures of ELPs: SPR and SPFS. SPR spectroscopy is an analytical technique, which can be used for the characterization of interfaces and thin films as well as for the detection of interfacial binding processes.26 It is a useful tool for measuring the kinetics of the association and dissociation of ligands from the aqueous solution interacting with interfacial binding sites. The SPR signal allows for the detection of changes in refractive index within the evanescent wave zone at the interface upon the adsorption of macromolecules from the bulk of the liquid phase.28 One of the major advantages of SPR is seen in the fact that it allows for label-free detection of binding processes. The mere presence of the bound biopolymers on the surface can be detected by the optical contrast that it generates at the surface before and after the reaction.
However, if the analytes are of low molecular mass or adsorb with a very dilute lateral packing density, the technique is not sensitive enough to produce a significant signal. These sensitivity limitations can be overcome by the use of (fluorescence) labeling techniques in connection with surface plasmon spectroscopy as a means to enhance the signal of the interfacial binding events.26 SPFS is a novel, recently introduced optical detection scheme based on the combination of surface plasmon excitation and fluorescence detection. The evanescent character of the surface plasmon mode leads to an excitation probability at the (noble) metal/dielectric interface that exponentially decays away from the interface. The chromophores, hence, should be placed as close to the sensor surface as possible. However, the metallic character of a substrate that is able to carry a surface mode at the same time constitutes a broadband acceptor for (Förster) energy transfer processes between an excited chromophore and the noble metal substrate.29 This leads to a strong reduction in radiative lifetimes and fluorescence intensities. The fluorescence is “quenched,” dissipating the excitation energy in the metal as heat. The relevant distance dependence for this coupling scheme is governed by the Förster radius for energy transfer and leads to a significant loss of fluorescence intensity by quenching in close proximity to the metal surface (d~ 30–40 nm).30 Hence, SPFS offers the potential to access information hidden in different binding pathways, transition states, phase transitions, and structural changes associated with the measured interactions. In particular, SPFS is a powerful technique to study the interfacial behavior of SRPs, when used in conjunction with SPR because of the strong distance dependence of its signal that is commensurate with the dimensional changes expected for the stimuli-triggered collapse of macromolecular chains at the solid-water interface.
IV. GRAFTING ELPS TO SOLID SURFACES
Film thickness measurements can give useful parameters for the estimation of the conformational state of an adsorbed (bio)macromolecular complex. A surface force measurement of the thickness of a surface-grafted ELP layer with 180 pentapeptide repeat units in the swollen state resulted in a thickness (length) of about 12 nm.19
Given the fact that the behavior of a chromophore (transition dipole) in front of a metal surface within this thickness regime is strongly dependent on the separation distance due to the fluorescence quenching effect, the fluorescence observed from chromophores that are placed within a matrix layer assembled on the (Au) sensor surface can be used to monitor conformational changes in grafted brushes. If an increase in the fluorescence is observed during and/or after the immobilization of additional unlabeled ELP chains [cf. Fig. 1(a), step 2], this indicates that the fluorophores conjugated to the ELPs are placed further away from the surface as there is less “quenching.” This then further implies that the original conformation of a labeled ELP chain is not in a state of maximum stretching. The labeled ELPs were tilted and/or coiled and the addition of unlabeled ELPs resulted in a more stretched position of all chains.
A. Grafting N-ELP to bare Au surfaces
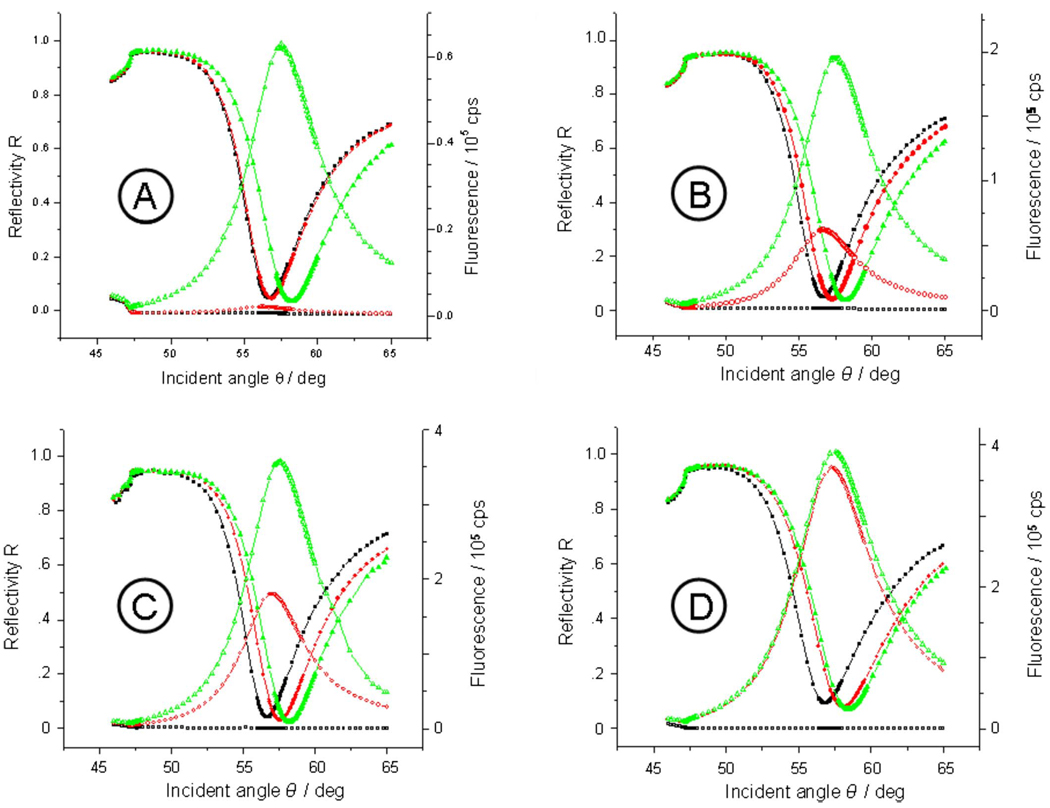
In a first series of experiments labeled N-ELP molecules were assembled on bare Au substrates to different densities, by adding N-ELPs at different solution concentrations to the surfaces, followed by rinsing with pure buffer, as evidenced by the different angular shifts of the respective SPR curves relative to the resonance curves of their bare substrates. This can be seen in Fig. 2: four different samples with increasing graft densities are displayed in Figs. 2(a)–2(d), respectively. The black reflectivity curve (solid symbols) of each sample represents the surface plasmon resonance of the unmodified substrate prior to the injection of the ELP solution. The angular reflectivity scans taken for each sample after the assembly of the labeled ELP brushes was interrupted at various densities (red reflectivity curves with solid symbols) indicate the increasing resulting film thickness by the increasing shift of the red solid curve relative to the black solid reference scans. Assuming a refractive index of the assembled peptide layer of n=1.41 one obtains brush thicknesses of d =1.7 nm (A), 7.2 nm (B), 11.0 nm (C), and 12.9 nm (D), respectively. This is plotted in Fig. 3.
FIG. 2.
Angular dependences of the reflectivity (solid symbols) and the simultaneously measured fluorescence intensities (open symbols) for N-ELPs grafted on bare Cr/Au substrate with different graft densities. The black, red, and green curves represent the unmodified substrate prior to the injection of the ELP solution, after assembly of the labeled N-ELP brushes, and after the completion of the assembly process by unlabeled ELPs, respectively. The graft thickness of labeled N-ELP after step 1 is (a) d=1.7 nm, (b) 7.2 nm, (c) 11.0 nm, and (d) 12.9 nm, respectively.
FIG. 3.
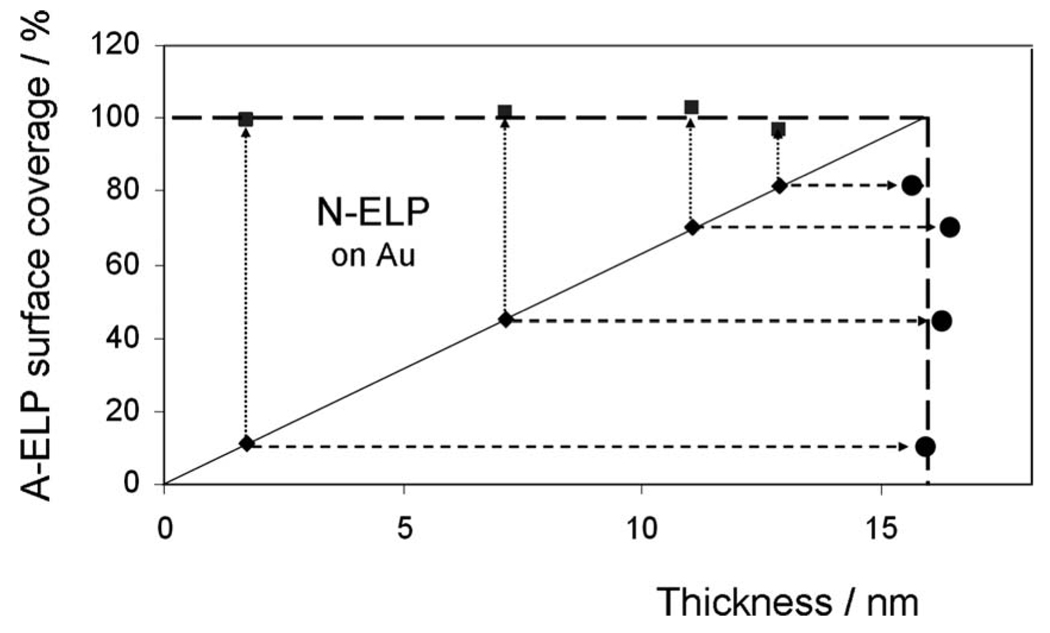
ELP surface coverage on bare Au substrate after the stepwise binding of labeled N-ELPs (♦) and unlabeled ELPs (■), respectively, for four different initial N-ELP graft densities. The circle point (●) shows the final thickness after binding of unlabeled ELPs.
After this grafting process with chromophore labeled N-ELP chains the samples were rinsed and then exposed to a solution of unlabeled ELP molecules. Because the SH group of the cysteine at the C terminus of the peptide has a higher affinity to the Au substrate than the NH2 groups at the N-terminus, we assume that the unlabeled chains attach via their SH moiety to the substrate resulting in a further increase in the brush density and, hence, thickness. As one can see from the comparison of all reflectivity scans taken after the completion of the assembly process [green reflectivity scans, solid symbols in Figs. 2(a)–2(d)] the final thickness of all brushes is nearly the same. As demonstrated by the thickness data derived from a Fresnel analysis of the green reflectivity curves this final thickness is near d=16 nm (at n=1.41) irrespective of the graft density of the labeled N-ELP, i.e., all brushes can be assembled to a nearly constant density referred to 100% (cf. Fig. 3).
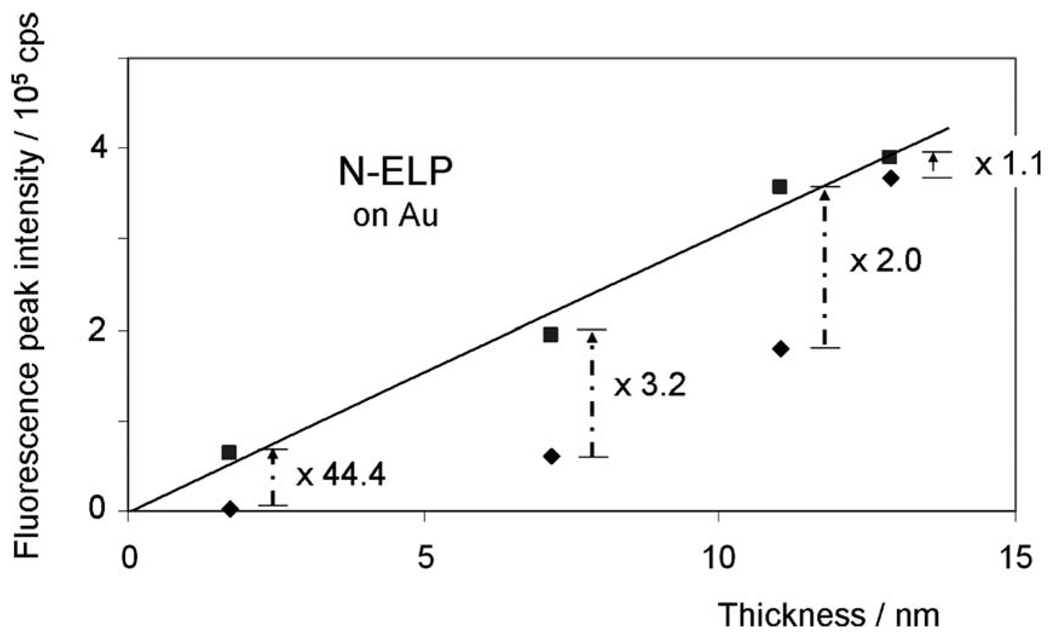
Also shown in Fig. 2 are the corresponding SPFS data. Prior to any brush assembly, the background of the bare Au substrate was very low and independent of the angle of incidence [black curves with open symbols in Figs. 2(a)–2(d)]. Upon the formation of the N-ELP brushes of different graft densities the angle-dependent low fluorescence signal indicates the existence of rather collapsed brush architectures, especially for the low graft densities (cf. Fig. 2, red curves of open symbols), resulting from a high degree of quenching. If the respective peak fluorescence intensities are plotted as a function of the layer thickness (of the brush assembled from the labeled ELPs only) one finds a strongly nonlinear increase in the emitted intensity (diamonds in Fig. 4). This behavior becomes understandable if one monitors the fluorescence intensity after completing the brush to full coverage (squares in Fig. 4) by subsequently assembling unlabeled N-ELP chains [curves with green open symbols in Figs. 2(a)–2(d)]. As one can see from Fig. 4, this final fluorescence intensity (squares), taken after the completion of the brush architecture, scales linearly with the thickness of the initial film composed of labeled peptides only. This means that upon filling the uncovered Au substrate area between the labeled ELPs with unlabeled ELPs, all chains stretch to the same extent resulting in a fluorescence intensity that scales linearly with the number density of the chromophores attached to the labeled N-ELP. The respective increase in the fluorescence intensity before and after assembling the unlabeled ELPs ranges from a factor of 44 for the brush with the lowest initial graft density to only a factor of 1.1 for the brush with the highest initial graft density.
FIG. 4.
Correlation (linear fit) of ELP thickness and fluorescence peak intensities of SPFS angular scans after the stepwise binding of N-ELPs (♦)and unlabeled ELPs (■), respectively, on bare Au substrate with four different graft densities at a solution ionic strength of 10 mM. The numbers show the increment of fluorescence peak intensity after the immobilization of unlabeled ELPs.
B. Grafting C-ELP to a SAM-modified substrate surfaces
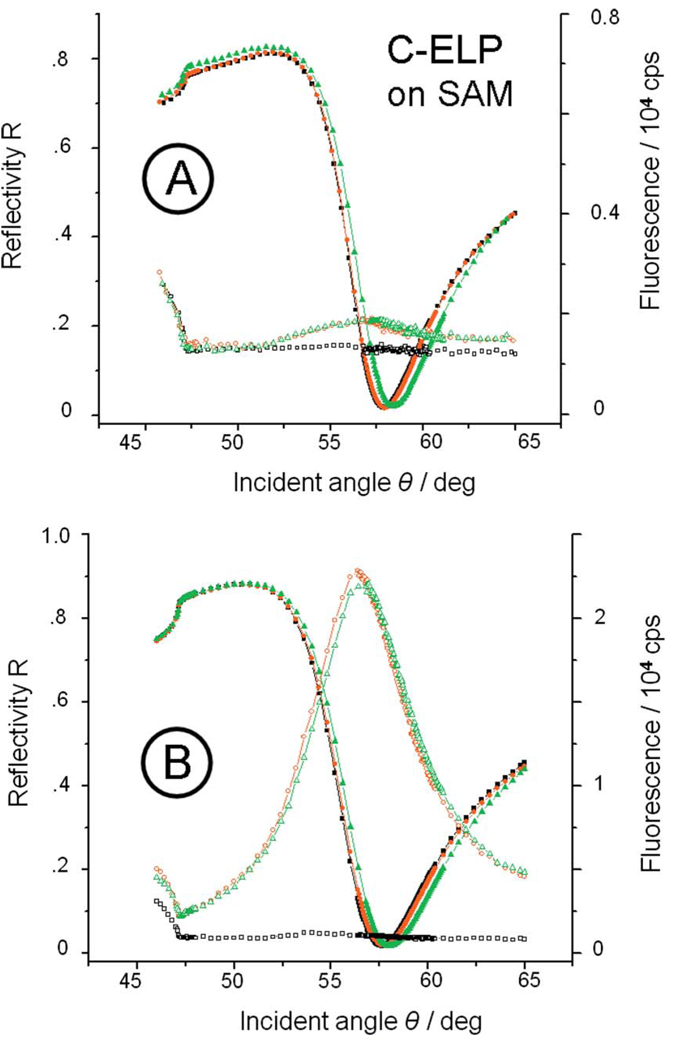
The alternative approach, i.e., grafting the labeled and unlabeled C-ELPs to the Au substrate that was first covered by a self-assembled thiol monolayer with activated carboxyl end groups, shows a completely different behavior. Two examples (points 1 and 2 in Fig. 6) of the obtained reflectivity curves that document this are given in Figs. 5(a) and 5(b), respectively. As in Fig. 2, the black curves represent the bare SAM substrate while the red curves were recorded after the chromophore labeled C-ELPs were grafted at different densities to the active ester groups of the SAM. Then, after completing the brush structure by assembling unlabeled C-ELP chains the final brush thicknesses were obtained from reflectivity curves like the ones given in green in Fig. 5.
FIG. 6.
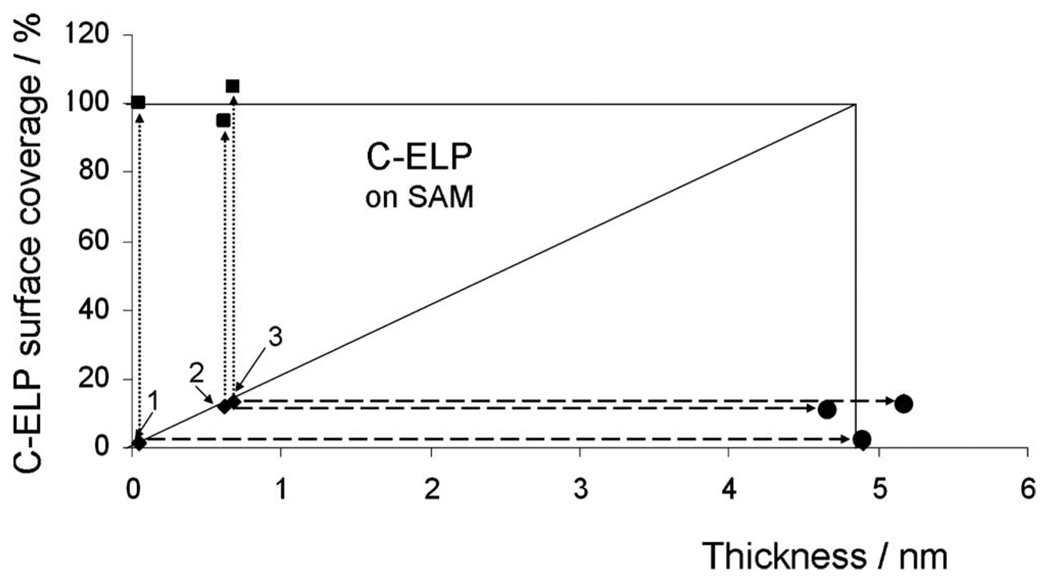
ELP surface coverage on COOH-(EG)6 NHS ester SAMs after the stepwise binding of labeled C-ELPs (♦) and unlabeled ELPs (■), respectively. The circle point (●) shows the final thickness after binding of unlabeled ELPs. The three initial C-ELP graft densities shown as 1, 2, and 3 are d=0.05 nm, 0.6 nm, and 0.7 nm, respectively.
FIG. 5.
Angular dependences of the reflectivity (solid symbols) and the simultaneously measured fluorescence intensities (open symbols) for C-ELPs grafted on COOH-(EG)6 NHS ester SAMs with different graft densities. The black, red, and green curves represent the EG6-COOH NHS ester SAM substrate prior to the injection of the ELP solution, after assembly of the labeled C-ELP brushes, and after the completion of the assembly process by unlabeled ELPs, respectively. The graft thickness of labeled C-ELP after step 1 is d=0.05 nm (a), and 0.6 nm (b), respectively.
If one plots the initial thicknesses of the labeled brush (diamonds, labeled 1, 2, and 3, in Fig. 6, respectively) and the corresponding final thickness (circles and squares in Fig. 6) one realizes that for this grafting protocol again a constant final thickness can be obtained; however, at a substantially lower coverage, the final thickness obtainable was barely reaching 5 nm, compared to the 16 nm found for the direct grafting of the N-ELP system (cf. Fig. 3).
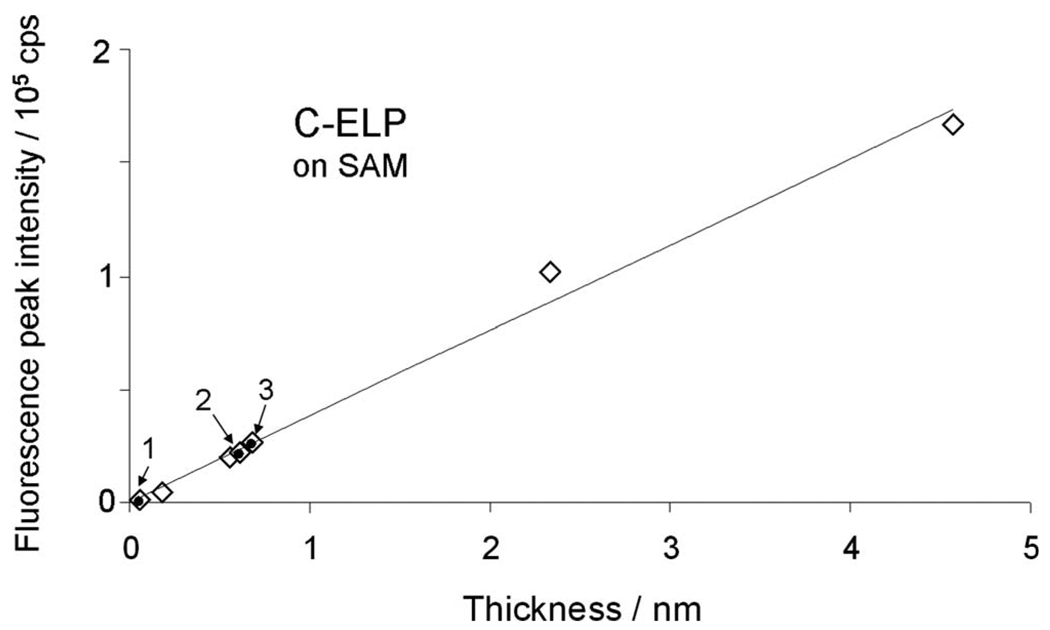
The most dramatic difference of this way of grafting an ELP brush to the solid/solution interphase can be seen, however, by recording the angle-dependent fluorescence intensities (also given in Fig. 5). The intensities taken before and after the completion of the full brush by assembling unlabeled chains via the activated carboxyl groups of the SAM thiols remain virtually identical (red and green open curves in Fig. 5, respectively) indicating that the increased crowding within the brush (as evidenced by the increase in the layer thickness, cf. the reflectivity curves) does not change the extent of the chain stretching, hence, does not change the degree of quenching. This is in sharp contrast to the observation made for the brushes grafted directly to the bare Au surface (cf. Fig. 2). As a consequence, the peak fluorescence intensities—if plotted against the layer thickness of the labeled brush—show a strictly linear behavior both before (diamonds in Fig. 7) and after (circles in Fig. 7) completing the brush by grafting unlabeled chains. The three points (labeled 1, 2, and 3) were shown in Fig. 7 for the data of the brushes presented in Fig. 6. Added also are the four values of the fluorescence intensities found for brushes prepared for the measurements of the ionic strength effect on the brush architecture, see below.
FIG. 7.
Correlation (linear fit) of ELP thickness and fluorescence peak intensities of SPFS angular scans after the stepwise binding of C-ELPs (◊) and unlabeled ELPs (●), respectively, attachment on activated COOH-(EG)6 SAMs with seven different graft densities at a solution ionic strength of 10 mM. Points 1, 2, and 3 represent the three ELPs matrices shown in Fig. 6 for stretching measurements, while the other points were prepared for stimuli response measurements shown in Fig. 9.
V. ELP BRUSH RESPONSE TO CHANGES IN THE IONIC STRENGTH
Thermodynamically reversible LCST transitions of ELPs are most commonly triggered either by temperature changes or, isothermally, by changes in the concentration of salt added to the buffer solution.19 For experimental convenience, we opted for the latter approach and added NaCl in order to trigger the LCST transition of the ELP brushes grafted to the surface at constant temperature. Furthermore, we limited these studies to investigations on the surface phase transition for the covalently grafted C-ELPs on COOH-(EG)6 SAMs.
Conformational changes in the ELP brushes under the influence of added salt were first recorded by comparing a series of reflectivity scans. A monotonous shift of the angular position of the surface plasmon resonance was obtained as a function of ionic strength [cf. the minimum angle positions, (1), of the reflectivity curves, solid symbols in Fig. 8, for C-ELPs with brush thickness of d=2.3 nm (at n=1.41)]. The shift of the reflectivity minimum is due to both a refractive index change in the buffer solution, which is also reflected in the shift of the critical angle for total internal reflection [cf. Fig. 8, (2)], and the convoluted effect of thickness and refractive index changes in the ELP brush. Mere changes in the refractive index of 2the medium in contact with the brush-coated metal film and/or any thickness/ refractive index change in an adsorbed layer will result in a change in the dispersion behavior of the surface plasmon modes. Severe misinterpretation of binding kinetics can result if, for example, structural changes or (macro)molecular rearrangements affect the measured observable, such as time-dependent variations in thickness, or in the refractive index increment, dc/dn, or both. Moreover, it should be noted that, for macromolecular assemblies undergoing significant conformational changes, dc/dn is not necessarily a constant throughout the reaction with respect to the p-polarized electric field used to excite SPR modes. Then the commonly used conversion between the change in the SPR angle and the adsorbed mass must be used with care in situations where structural transformations cause changes in the (bio)macromolecular ordering and/or the biofilm’s water content.31 In particular, a decrease in the thickness of the polymer layer will lead to a downshift of the angle of minimum reflection, if the refractive index is assumed to be held constant during the process. On the other hand, any increase in the refractive index of a layer during collapse process held at constant thickness leads to an increase in the SPR resonance angle. Since more detailed information is required in order to describe the complexity of the system, independent quantities need to be measured for a correct and unambiguous interpretation.
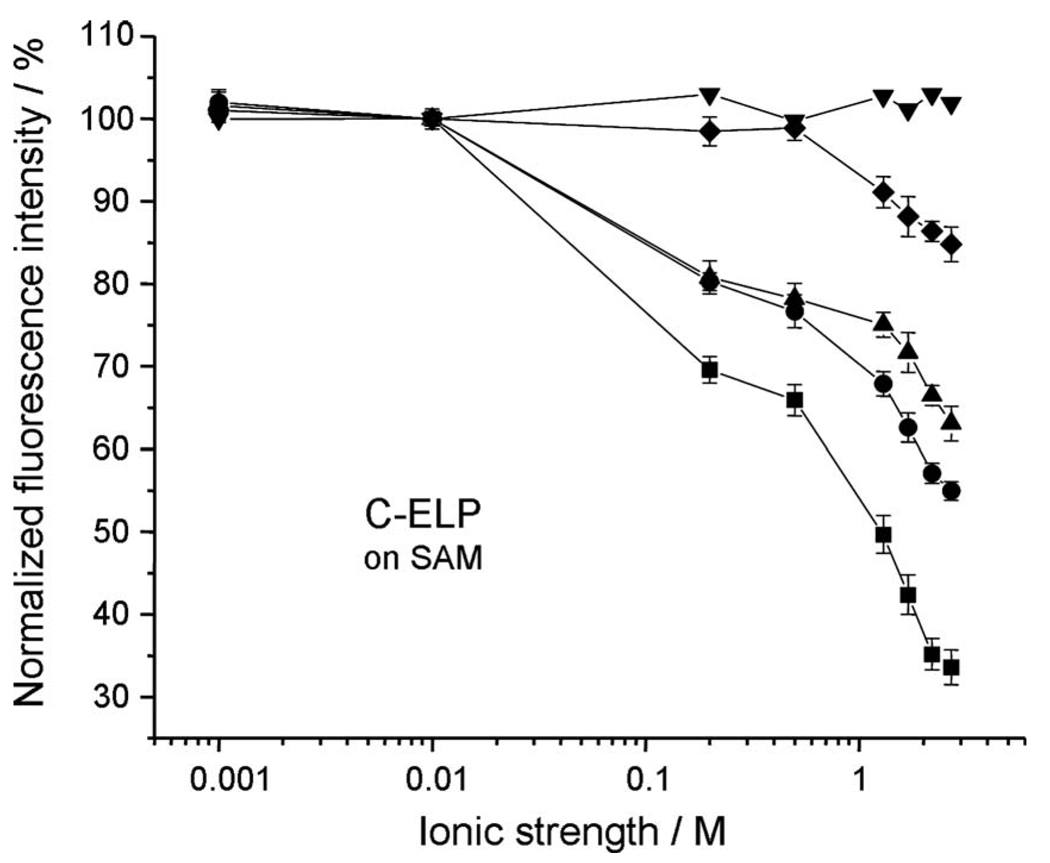
However, qualitatively, SPFS can give additional information on the stretching/collapse behavior of a grafted brush. This is demonstrated here for the ionic strength dependence of C-ELP brushes assembled to different final thicknesses. To this end, the peak intensities of the fluorescence angular scans (cf. open symbols in Fig. 8 for the C-ELP brush with thickness d=2.3 nm as an example) were taken and normalized to the intensities obtained at 0.001M NaCl buffer. The data were then plotted as a function of ionic strength (cf. Fig. 9). In order to rule out any direct effect of the salt concentration on the emission properties of the employed chromophore, the response of Alexa Fluor 647 C2-maleimide to the addition of NaCl was also tested in pure bulk solution. We found that no variation of the fluorescence intensity was observed for free Alexa Fluor 647 at different solution ionic strengths (cf. Fig. 9, triangles). Hence, we attribute all changes in the fluorescence intensities observed upon changing the buffer ionic strength to the distance-dependent behavior of the surface immobilized chromophores, which mirror conformational changes in the ELPs caused by stimuli variations.
FIG. 9.
Comparisons of ionic strength responses given at the normalized fluorescence intensities of C-ELPs with graft thickness of d=0.2 nm (■); 0.6 nm (●); 2.3 nm (▲), and 4.6 nm (♦), respectively. (▼): free Alexa Fluor 647 C2-maleimide responses in solution.
Figure 9 shows the dependence of the C-ELP brush response to changes in the ionic strength of the buffer solution for different grafting densities. A decrease in fluorescence intensity for all ELP graft densities investigated was observed while increasing the solution ionic strength, because any increment of the ionic strength induced a partial collapse of the ELPs. This salt induced partial ELP collapse shortens the average separation distance between the surface attached fluorophores and the sensor surface. This, in turn, reduces the fluorescence intensity due to an increased quenching of the fluorescence emission. From the normalized fluorescence graphs for all four different surface densities of ELPs (i.e., d=0.2, 0.6, 2.3, and 4.6 nm, respectively), it is noted that the lower the surface density of ELPs, the greater the change in fluorescence intensity. This is because at low surface coverage, ELPs are more loosely packed, thus they have more spatial freedom to collapse.
VI. CONCLUSIONS
The understanding of the interfacial behavior of ELPs as a function of the method of immobilization and the physicochemical properties of the surface was provided to allow a more precise design of ELP interfacial structures for specific applications. We have demonstrated the fabrication of stimulus-responsive ELP nanostructures that were covalently end grafted onto oligo COOH-(EG)6 SAMs in highly oriented and maximum swelled state, which enabled the relationship between stimuli conditions (solution ionic strength) and the ELP phase transition to be quantitatively elucidated. Results show that the degree of ELP phase transition is inversely correlated with their surface graft densities. Interestingly, unlike ELPs in solution, which show a first order, LCST phase transition behavior, we did not see an abrupt change in the thickness of the grafted layer as a function of ionic strength, indicating that grafted ELPs do not exhibit LCST behavior. ELPs at lower graft densities simply show environmentally triggered conformational collapse, while at higher densities even the conformational collapse is largely prevented by the high graft density of the ELPs.
The results shown herein also demonstrate the power of SPFS for the investigation of conformational changes in the interfacial architectures. A major advantage of this method is that it provides molecular level information about the behavior of the polymer on the surface with exquisite attomolar resolution in the direction perpendicular to the surface.32
ACKNOWLEDGMENTS
This research was partially supported by a grant from the NIH (No. GM61232) to A.C. Dedicated to Michael Grunze on the occasion of his 60th birthday.
Contributor Information
Fei Xu, Institute of Materials Research and Engineering, Agency for Science, Technology and Research (A*STAR), 3 Research Link, Singapore 117602, Singapore.
Huang Min Joon, Institute of Materials Research and Engineering, Agency for Science, Technology and Research (A*STAR), 3 Research Link, Singapore 117602, Singapore.
Kimberly Trabbic-Carlson, Department of Biomedical Engineering, Duke University, Box 90281, Durham, North Carolina 27708.
Ashutosh Chilkoti, Department of Biomedical Engineering, Duke University, Box 90281, Durham, North Carolina 27708.
Wolfgang Knoll, Institute of Materials Research and Engineering, Agency for Science, Technology and Research (A*STAR), 3 Research Link, Singapore 117602, Singapore and Max Planck Institute for Polymer Research, Ackermannweg 10, 55128 Mainz, Germany.
References
- 1.Meyer DE, Chilkoti A. Biomacromolecules. 2002;3:357. doi: 10.1021/bm015630n. [DOI] [PubMed] [Google Scholar]
- 2.Trabbic-Carlson K, Setton LA, Chilkoti A. Biomacromolecules. 2003;4:572. doi: 10.1021/bm025671z. [DOI] [PubMed] [Google Scholar]
- 3.Hubbell JA. Curr. Opin. Biotechnol. 1999;10:123. doi: 10.1016/s0958-1669(99)80021-4. [DOI] [PubMed] [Google Scholar]
- 4.Sakiyama-Elbert SE, Hubbell JA. Annu. Rev. Mater. Res. 2001;31:183. [Google Scholar]
- 5.Langer R. Nature (London) 1998;392:5. [PubMed] [Google Scholar]
- 6.Kanazawa H, Matsushima Y, Okano T. Adv. Chromatogr. 2001;41:311. [PubMed] [Google Scholar]
- 7.Stayton PS, Shimoboji T, Long C, Chilkoti A, Chen G, Harris JM, Hoffman AS. Nature (London) 1995;378:472. doi: 10.1038/378472a0. [DOI] [PubMed] [Google Scholar]
- 8.Betre H, Setton LA, Meyer DE, Chilkoti A. Biomacromolecules. 2002;3:910. doi: 10.1021/bm0255037. [DOI] [PubMed] [Google Scholar]
- 9.Fujishige S, Kubota K, Ando I. J. Phys. Chem. 1989;93:3311. [Google Scholar]
- 10.Meyer DE, Chilkoti A. Biomacromolecules. 2004;5:846. doi: 10.1021/bm034215n. [DOI] [PubMed] [Google Scholar]
- 11.Miao M, Bellingham CM, Stahl RJ, Sitarz EE, Lane CJ, Keeley FW. J. Biol. Chem. 2003;278:48553. doi: 10.1074/jbc.M308465200. [DOI] [PubMed] [Google Scholar]
- 12.Kontturi K, Mafe S, Manyanares JA, Svarfvar BL, Viinikka P. Macromolecules. 1996;29:5740. [Google Scholar]
- 13.Siegel RA, Firestone BA. Macromolecules. 1988;21:3254. [Google Scholar]
- 14.Kwon IC, Bae YH, Kim SW. Nature (London) 1991;354:291. doi: 10.1038/354291a0. [DOI] [PubMed] [Google Scholar]
- 15.Kuckling D, Ivanova IG, Adler HJP, Wolff T. Polymer. 2002;43:1813. [Google Scholar]
- 16.Holtz JH, Asher SA. Nature (London) 1997;389:829. doi: 10.1038/39834. [DOI] [PubMed] [Google Scholar]
- 17.Miyata T, Asami N, Uragami T. Nature (London) 1999;399:766. doi: 10.1038/21619. [DOI] [PubMed] [Google Scholar]
- 18.Nath N, Chilkoti A. J. Am. Chem. Soc. 2001;123:8197. doi: 10.1021/ja015585r. [DOI] [PubMed] [Google Scholar]
- 19.Hyun J, Lee WK, Nath N, Chilkoti A, Zauscher S. J. Am. Chem. Soc. 2004;126:7330. doi: 10.1021/ja049721e. [DOI] [PubMed] [Google Scholar]
- 20.Chow DC, Dreher MR, Trabbic-Carlson K, Chilkoti A. Biotechnol. Prog. 2006;22:638. doi: 10.1021/bp0503742. [DOI] [PMC free article] [PubMed] [Google Scholar]
- 21.Meyer DE, Chilkoti A. Nat. Biotechnol. 1999;17:1112. doi: 10.1038/15100. [DOI] [PubMed] [Google Scholar]
- 22.See http://probes.invitrogen.com, Chap. 1; http://probes.invitrogen.com/handbook/sections/0100.html, the handbook.
- 23.Furgeson DY, Dreher MR, Chilkoti A. J. Controlled Release. 2006;110:362. doi: 10.1016/j.jconrel.2005.10.006. [DOI] [PubMed] [Google Scholar]
- 24.Löfås S, Johnsson BJ. J. Chem. Soc., Chem. Commun. 1990:1526. [Google Scholar]
- 25.Frey W, Meyer DE, Chilkoti A. Langmuir. 2003;19:1641. [Google Scholar]
- 26.Liebermann T, Knoll W. Colloids Surf., A. 2000;171:115. [Google Scholar]
- 27.Chapman RG, Ostuni E, Yan L, Whitesides GM. Langmuir. 2000;16:6927. [Google Scholar]
- 28.Garland PB. Q. Rev. Biophys. 1996;29:91. doi: 10.1017/s0033583500005758. [DOI] [PubMed] [Google Scholar]
- 29.Knoll W, Park H, Sinner E, Yao D, Yu F. Surf. Sci. 2004;570:30. [Google Scholar]
- 30.Vasilev K, Knoll W, Kreitera M. J. Chem. Phys. 2004;120:3439. doi: 10.1063/1.1640341. [DOI] [PubMed] [Google Scholar]
- 31.Reimhult E, Larsson C, Kasemo B, Hook F. Anal. Chem. 2004;76:7211. doi: 10.1021/ac0492970. [DOI] [PubMed] [Google Scholar]
- 32.Yu F, Persson B, Lofas S, Knoll W. J. Am. Chem. Soc. 2004;126:8902. doi: 10.1021/ja048583q. [DOI] [PubMed] [Google Scholar]


