British developmental aid for developing countries prioritises greater reproductive choice for women through improved contraceptive services. But is enough being done in the United Kingdom to reduce unwanted pregnancies? I studied lifetime fertility, abortion rates, and the proportion of pregnancies resulting in induced abortion in 105 district health authorities in England.
Subjects, methods, and results
I analysed data on births and legal abortions during 1995 by district health authority as compiled by the Office for National Statistics. Total period fertility rates are a conventional measure of the mean number of live births that a woman would have if she experienced the current age specific fertility rates throughout her childbearing years. These rates were calculated by summing the 5 year age specific fertility rates at ages 15-49 and multiplying by 5. Total period abortion rates were similarly calculated. The total period pregnancy rate is the sum of the total period abortion rate and total period fertility rate. Stillbirths and spontaneous abortions were excluded.
In 1995, 147 851 abortions occurred among women resident in England compared with 613 257 live births, a ratio of 1:4. This was equivalent to a total period fertility rate of 1.72 births (less than the population replacement level of 2.2) and a total period abortion rate of 0.44 abortions over a woman’s lifetime. Total period fertility rates showed a 1.8-fold variation (1.26 to 2.32) and total period abortion rates a 4.2-fold variation (0.26 to 1.09) between district health authorities. Total period abortion rates were highest in London and possibly showed some movement between districts of women seeking a termination.
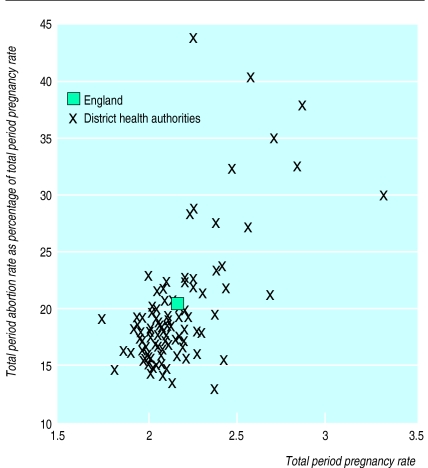
On the basis of rates in 1995, a woman in England will have an average of 2.16 pregnancies during her lifetime, of which 0.44 (20.4%) will result in an abortion. Interdistrict variation in the mean number of pregnancies ranged from 1.74 to 3.31, with 13%-44% being aborted (figure). The comparative contribution of fertility and abortion to total period pregnancy rate varied regionally—for example, whereas women in Bradford and Croydon had a similar number of pregnancies (2.37), the ratio of live births to abortions was 2.06:0.31 and 1.72:0.66 respectively. Both total period pregnancy rate (3.31) and total period fertility rate (2.32) were highest in East London and the City District Health Authority, which also had one of the highest total period abortion rates nationally (0.99). In contrast, Camden and Islington had the third lowest total period fertility rate nationally (1.53) and the second highest total period abortion rate (1.04).
About 20% of abortions occur in women under 20, among whom 40% of pregnancies are terminated; the proportion in parts of London and the southeast is half to two thirds.
Comment
One in five pregnancies in England results in a termination, giving a mean lifetime abortion rate of 0.44 per woman, which is higher than a decade ago.1 Most women having abortions are young (under 30), single, and childless.2 More women (26.9%) are having repeat abortions.2,3 Not practising safe sexual intercourse is associated with abortion, testing for HIV, and treatment for sexually transmitted diseases.4 Contraceptive use is associated with social class, and abortion rates rise with deprivation.4 These factors indicate the need and potential for targeted, preventive interventions.
Globally, illegal abortions are an important cause of morbidity and mortality among women of reproductive age, particularly in developing countries.5 High fertility and abortion rates in developing countries can be readily explained, but high abortion rates in affluent populations of low fertility with ready access to contraception are less easy to rationalise. Women in all societies need access to safe, legal abortion services. With the Abortion Act 1967, the United Kingdom led other European countries in reforming abortion legislation. As in the Netherlands, there is a need to target the causes of unwanted pregnancy through more effective education and contraceptive services. This will also reduce the costs of abortion and improve sexual health.
Figure.
Total period pregnancy rates and total period abortion rates as percentages of total period pregnancy rates in England overall and by district health authority, 1995
Acknowledgments
The concepts used in this paper were derived from Population Health Outcome Indicators: a Feasibility Study and Public Health Common Data Set, both published by the Department of Health.
Footnotes
Funding: None.
Conflict of interest: None.
References
- 1.Clarke M. Fertility and legal abortion in England and Wales: performance indicators for family planning services. BMJ. 1988;297:832–833. doi: 10.1136/bmj.297.6652.832. [DOI] [PMC free article] [PubMed] [Google Scholar]
- 2.Office for National Statistics. Abortion statistics. HMSO: London; 1996. (Series AB No 21.) [Google Scholar]
- 3.Botting B. Trends in abortion. Popul Trends. 1991;64:19–29. [PubMed] [Google Scholar]
- 4.Johnson AM, Wadsworth J, Wellings K, Field J. Sexual attitudes and lifestyles. Oxford: Blackwell Scientific; 1994. [Google Scholar]
- 5.Kulczycki A, Potts M, Rosenfield A. Abortion and fertility regulation. Lancet. 1996;347:1663–1668. doi: 10.1016/s0140-6736(96)91491-9. [DOI] [PubMed] [Google Scholar]


