Abstract
Accumulation of amyloid-β (Aβ) and Tau is an invariant feature of Alzheimer disease (AD). The upstream role of Aβ accumulation in the disease pathogenesis is widely accepted, and there is strong evidence showing that Aβ accumulation causes cognitive impairments. However, the molecular mechanisms linking Aβ to cognitive decline remain to be elucidated. Here we show that the buildup of Aβ increases the mammalian target of rapamycin (mTOR) signaling, whereas decreasing mTOR signaling reduces Aβ levels, thereby highlighting an interrelation between mTOR signaling and Aβ. The mTOR pathway plays a central role in controlling protein homeostasis and hence, neuronal functions; indeed mTOR signaling regulates different forms of learning and memory. Using an animal model of AD, we show that pharmacologically restoring mTOR signaling with rapamycin rescues cognitive deficits and ameliorates Aβ and Tau pathology by increasing autophagy. Indeed, we further show that autophagy induction is necessary for the rapamycin-mediated reduction in Aβ levels. The results presented here provide a molecular basis for the Aβ-induced cognitive deficits and, moreover, show that rapamycin, an FDA approved drug, improves learning and memory and reduces Aβ and Tau pathology.
Keywords: Aging, Alzheimers Disease, Amyloid, Autophagy, Neurodegeneration, TOR, TOR Complex (TORC), Plaques, Rapamycin, Tangles
Introduction
Neurofibrillary tangles (NFTs)2 and amyloid plaques represent the two major hallmark neuropathological lesions of AD (1). NFTs are intraneuronal inclusions that are mainly formed of the hyperphosphorylated microtubule-binding protein Tau (2–5). In contrast, amyloid plaques accumulate extracellularly and are mainly composed of a peptide called amyloid-β (Aβ) (6, 7). Although the key role of Aβ accumulation in the pathogenesis of AD is widely accepted, the molecular pathways by which Aβ accumulation leads to cognitive decline and Tau pathology remain to be elucidated.
The mammalian target of rapamycin (mTOR) is a conserved Ser/Thr kinase that forms two multiprotein complexes known as mTOR complex (mTORC) 1 and 2 (8). mTORC1 controls cellular homeostasis, and its activity is inhibited by rapamycin; in contrast mTORC2 is insensitive to rapamycin and controls cellular shape by modulating actin function (8, 9). By regulating both protein synthesis and degradation, mTOR plays a key role in controlling protein homeostasis and hence brain function; indeed, mTOR activity has been directly linked to learning and memory (10–13). Additionally, genetic and pharmacological reduction of mTOR activity has been shown to increase the lifespan in different organisms including yeast, Drosophila, and mice (14–19).
mTOR is an inhibitor of macroautophagy, which is a conserved intracellular system designed for the degradation of long-lived proteins and organelles in lysosomes (20–22). Cumulative evidence suggests that an age-dependent decrease in the autophagy/lysosome system may account for the accumulation of abnormal proteins during aging (23). Macroautophagy (herein referred to as autophagy) is induced when an isolation membrane is generated surrounding cytosolic components, forming an autophagic vacuole, which will eventually fuse with lysosomes for protein/organelle degradation. The induction of the isolation membrane is negatively regulated by mTOR (24). Sixteen autophagy-related proteins (atg) are involved in the induction of autophagy in a series of ubiquitin-like reactions during different stages of the autophagosome formation (25–27). In the initial steps, Atg7 and Atg10 facilitate the binding of Atg12 to Atg5, which is necessary for autophagosome formation (25, 26). Another important step in the autophagosome formation is the activation of LC3-1 (the homologue of Atg8 in yeast). After its activation, LC3-1 is cleaved by Atg4 to form LC3-II, which is incorporated in the growing autophagosome membrane and is often used as a marker of autophagy induction (28, 29). In this study we report the effects of reducing mTOR signaling on the neuropathological and behavioral phenotype of the 3xTg-AD mice.
EXPERIMENTAL PROCEDURES
Mice and Rapamycin Administration
The derivation and characterization of 3xTg-AD mice has been described elsewhere (30). Briefly, two independent transgenes encoding human APPSwe and the human TauP301L (both under control of the mouse Thy1.2 regulatory element) were co-microinjected into single-cell embryos harvested from homozygous mutant PS1M146V knock-in (PS1-KI) mice. The 3xTg-AD and non-Tg mice used in these studies are on a mixed C57Bl6/129 background. To facilitate delivery, rapamycin was microencapsulated at a concentration of 2.24 mg/kg as described previously (14). Food containing empty microcapsules was used as the control diet. During the 10-week treatment, mice were given ad libitum access to water and the rapamycin or control diet.
Behavioral Test
Morris water maze tests were conducted in a circular tank of 1.5 meters in diameter located in a room with extra maze cues. The platform (14 cm in diameter) location was kept constant for each mouse during training and was 1.5 cm beneath the surface of the water, which was maintained at 25 °C throughout the duration of the testing. During 5 days of training, the mice underwent 4 trials a day, alternating among 4 pseudorandom starting points. If a mouse failed to find the platform within 60 s, it was guided to the platform by the researcher and kept there for 20 s. The inter-trial interval was 25 s, during which time each mouse was returned to its home cage. Probe trials were conducted 24 h after the last training trial. During the probe trials, the platform was removed and mice were free to swim in the tank for 60 s. The training and probe trials were recorded by a video camera mounted on the ceiling, and data were analyzed using the EthoVisioXT tracking system.
Protein Extraction, Western Blot, and ELISA
Mice were sacrificed by CO2 asphyxiation and their brains extracted and cut in half sagitally. For immunohistochemical analysis, one-half was drop-fixed in 4% paraformaldehyde in phosphate-buffered saline for 48 h and then transferred in 0.02% sodium azide in phosphate-buffered saline until slicing. The other half was frozen in dry ice for biochemical analysis. Frozen brains were homogenized in a solution of tissue protein extraction reagent (Pierce) containing 0.7 mg/ml of Pepstatin A supplemented with a complete Mini protease inhibitor tablet (Roche Applied Science) and phosphatase inhibitors (Invitrogen). The homogenized mixtures were briefly sonicated to sheer the DNA and centrifuged at 4 °C for 1 h at 100,000 × g. The supernatant was stored as the soluble fraction. The pellet was re-homogenized in 70% formic acid and centrifuged as above. The supernatant was stored as the insoluble fraction.
For Western blot analyses, proteins from the soluble fraction were resolved by 10% BisTris SDS-PAGE (Invitrogen) under reducing conditions and transferred to a nitrocellulose membrane. The membrane was incubated in a 5% solution of nonfat milk for 1 h at 20 °C. After overnight incubation at 4 °C with primary antibody, the blots were washed in Tween 20-TBS (T-TBS) (0.02% Tween 20, 100 mm Tris, pH 7.5, 150 nm NaCl) for 20 min and incubated at 20 °C with the appropriate secondary antibody. The blots were washed in T-TBS for 20 min and incubated for 5 min with SuperSignal (Pierce) and exposed. Densitometric analysis was conducted using ImageJ software from the National Institutes of Health. The protein levels reported in the figures were obtained as a ratio between the band intensity for the protein of interest and the band intensity of β-actin, used as loading control. Aβ40 and Aβ42 levels were measured from the soluble and insoluble fractions using a sandwich ELISA protocol as described in Ref. 31.
Immunohistochemistry
For immunohistochemical analysis, 50-μm thick sections were obtained using a Leica vibratome slicing system, and sections were stored at 4°C in 0.02% sodium azide in phosphate-buffered saline. To quench the endogenous peroxidase activity, free-floating sections were incubated for 30 min in H2O2. For the Aβ staining, sections were subsequently incubated in 90% formic acid for 7 min to expose the epitope. The appropriate primary antibody was applied, and sections were incubated overnight at 4 °C. After removing the primary antibody in excess, sections were incubated in the appropriate secondary antibody for 1 h at 20 °C. After a final wash of 20 min, sections were developed with diaminobenzidine substrate using the avidin-biotin horseradish peroxidase system (Vector Labs, Burlingame, CA). Images were obtained with a digital Zeiss camera and analyzed with ImageJ.
Cell Culture Experiments
7PA2 cells were a generous gift from Dr. Edward Koo, University of California, San Diego. Cell culture methods were adapted from Ref. 32. Briefly, cells were maintained in Dulbecco's modified Eagle's medium with 10% fetal bovine serum at 37°C with a humidified environment (5% CO2 + 95% atmosphere). For Western blot analysis, cells were grown on 6-well plates to 75% confluence before transfection or drug administration. Compound E ((2S)-2-{[(3,5-difluorophenyl)acetyl]amino}-N-[(3S)-1-methyl-2-oxo-5-phenyl-2,3-dihydro-1H-1,4-benxodiazepin-3-yl]propanamide) was purchased from Alexis Biochemicals (Plymouth Meeting, PA). It is a potent, selective, non-transition state and non-competitive γ-secretase inhibitor. All the experiments were done at least in triplicate and independently replicated 3 times.
Antibodies Used and mTOR Activity
The following antibodies were from the indicated sources: rabbit polyclonal anti-LC3 (Novus Biologicals, Littlelton, CO); anti-Actin (Sigma); anti-mTOR, phospho-mTOR, Phospho-p70S6K (Thr389), p70S6K, anti-ATG5, and anti-ATG7 (Cell Signaling, Boston, MA); anti-Tau HT7 and anti-AT270 (Pierce); anti-Aβ42 (Invitrogen); 6E10 (Signet, Dedham, MA); anti-Tau MC1 was a gift from Dr. Peter Davies; and anti-Lamp2A (Abcam, Cambridge, MA). mTOR activity was measured using the K-LISATM mTOR Activity Kit (EMD Chemicals, Gibbstown, NJ) following the manufacturer's protocol.
Statistical Analyses
Statistical analyses were conducted using multifactor analysis of variance including appropriate variables or t test when suitable.
RESULTS
Aβ Impairs mTOR Signaling
To determine the effects of Aβ on mTOR signaling we initially used Chinese hamster ovary cells stably transfected with a cDNA encoding APP751 containing the Val717-Phe familial AD mutation known as 7PA2 (33). These cells produce high levels of Aβ oligomers, which have been shown to impair several neuronal functions, including long-term potentiation and learning and memory (34–36).
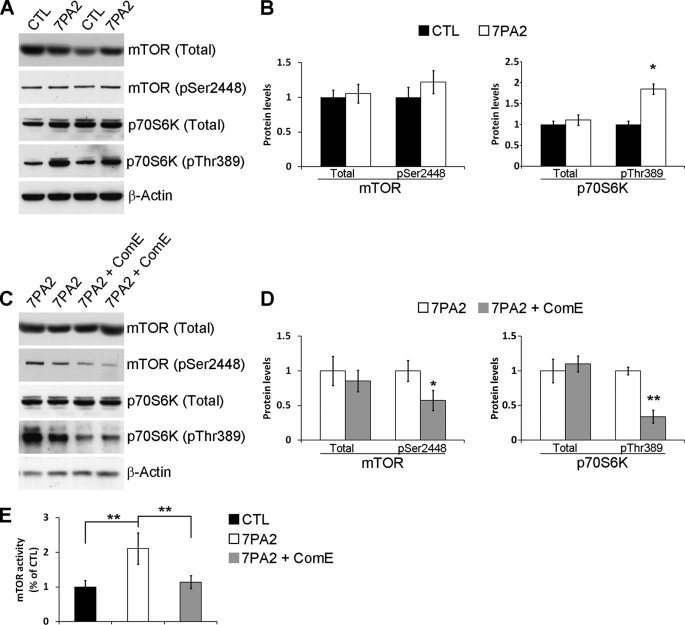
Using Western blot analysis we found that the levels of total and phosphorylated mTOR at Ser2448 were not statistically significant between 7PA2 and control cells. In contrast, we found that the levels of p70S6K phosphorylated at Thr389 were significantly increased in 7PA2 cells compared with control Chinese hamster ovary cells (Fig. 1, A and B). Direct measurement of mTOR enzymatic activity showed a significant increase in the 7PA2 cells compared with control cells. mTOR function is routinely determined by measuring the steady-state levels of phosphorylated p70S6K at Thr389, which is an epitope directly phosphorylated by mTOR, because mTOR phosphorylation does not always correlate with its activity (37–40). Our data support this dissociation between mTOR phosphorylation at Ser2448 and mTOR activity and clearly show that mTOR function is increased in 7PA2 cells. Consistent with the increase in mTOR activity, the phosphorylation levels of the eukaryotic initiation factor 4E-binding protein 1, a downstream target of mTOR, were also increased in 7PA2 cells compared with control cells (supplemental Fig. S1).
FIGURE 1.
Aβ increases mTOR signaling in 7PA2 cells. A, representative Western blots of proteins extracted from control or 7PA2 cells and probed with total and phospho-specific anti-mTOR and p70S6K antibodies. B, densitometric analysis of the blots (normalized to β-actin) showed that the levels of total and mTOR phosphorylated at Ser2448 were similar between control and 7PA2 cells. Although the levels of total p70S6K were also similar between control and 7PA2 cells, the steady-state levels of p70S6K phosphorylated at Thr389 (p70S6K-Thr389) were significantly higher in 7PA2 cells (n = 9; horizontal line). C, representative Western blots of proteins extracted from 7PA2 cells treated with the γ-secretase inhibitor Compound E (ComE) or vehicle. The horizontal line shows the levels pf mTOR activity in control. D, densitometric analysis (normalized to β-actin) shows that blocking Aβ production does not alter total mTOR and p70S6K levels but significantly decreases the steady-state levels of phosphorylated mTOR and p70S6K at Ser2448 and Thr389, respectively (n = 9). E, mTOR enzymatic activity is significantly higher in 7PA2 compared with control cells. Blocking Aβ production with compound E restores mTOR activity (n = 9). For all the experiments shown here, cells were grown in triplicate in three independent experiments; thus, we analyzed a total of 9 samples for each cell line. Data are presented as mean ± S.E. Protein levels are expressed as arbitrary units. * indicates p < 0.05; ** indicates p < 0.01.
To determine whether the increase in mTOR signaling was mediated by Aβ or APP, we treated 7PA2 and control cells with the γ-secretase inhibitor compound E (200 nm) for 24 h. Although blocking Aβ production had no effect on total mTOR and p70S6K, it reduced the levels of phosphorylated mTOR and p70S6K (Fig. 1, C and D). Furthermore, we found that mTOR enzymatic activity was restored by blocking Aβ production (Fig. 1E). Notably, compound E had no effect on mTOR signaling in Chinese hamster ovary cells (data not shown). Taken together, these data show that the increase in mTOR signaling in 7PA2 cells is mediated by Aβ and not APP. These data are consistent with reports showing that Aβ increases the phosphatidylinositol 3-kinase (PI3K)-AKT pathway (41–44), which is one of the signal transduction pathways known to increase mTOR activity (8).
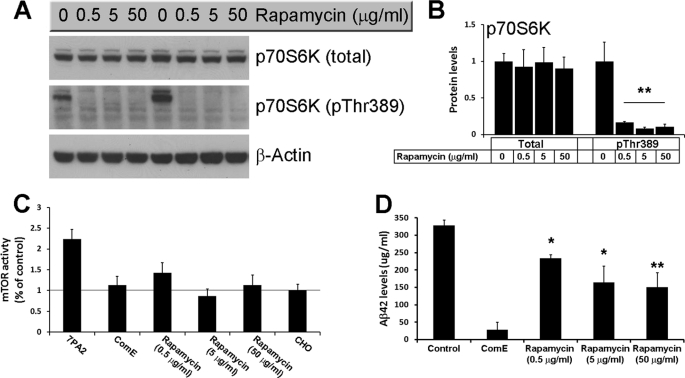
Our data indicate that Aβ enhances mTOR signaling in 7PA2 cells as determined by the increase in mTOR enzymatic activity and the increase in the steady-state levels of phosphorylated p70S6K at Thr389, a site directly phosphorylated by mTOR (reviewed in Ref. 40). We next sought to determine the effects of inhibiting mTOR function on Aβ levels. Toward this end, we treated 7PA2 cells with different concentrations of the mTOR inhibitor, rapamycin, for 24 h. As shown in Fig. 2, A and B, all three concentrations of rapamycin used were sufficient to drastically reduce phosphorylation of p70S6K at Thr389 and mTOR activity (Fig. 2, A–C), further confirming that the steady-state levels of phosphorylated p70S6K at this residue mirror mTOR activity. More importantly, we also found that rapamycin significantly reduced intracellular Aβ levels in 7PA2 cells as determined by ELISA measurements (Fig. 2D). Notably, whereas 0.5 μg/ml of rapamycin were sufficient to completely abolish p70S6K phosphorylation and significantly reduce mTOR activity (Fig. 2, A–C), the biggest decrease in Aβ levels was detected when rapamycin was used at a much higher concentration (50 μg/ml; Fig. 2D). Further studies are needed to determine whether this dissociation is due to different technique sensitivity (e.g. Western blots and Aβ ELISA), or whether high concentrations of rapamycin may also reduce Aβ levels by other mTOR-independent mechanisms. Overall, these data indicate that there is an interrelation between Aβ and mTOR signaling.
FIGURE 2.
Rapamycin reduces Aβ levels in 7AP2 cells. A, representative Western blots of proteins extracted from 7PA2 cells treated with different concentrations of rapamycin for 24 h. B, densitometric analysis of the blots (normalized to β-actin) shows that rapamycin had no effect on total p70S6K levels but completely blocked phosphorylation of p70S6K at Thr389 (n = 9; horizontal line). C, rapamycin rescued the increased mTOR enzymatic activity in 7PA2 cells (n = 9). The horizontal line shows the levels of mTOR activity in control. D, sandwich ELISA measurements of proteins extracted from 7PA2 cells treated with rapamycin show that at all concentrations used, rapamycin significantly decreased the Aβ42 levels (n = 9). All the experiments shown here were done in triplicates in three independent experiments; thus, we analyzed a total of 9 samples for each cell line, for each specific condition. Data are presented as mean ± S.E. Protein levels are expressed as arbitrary units. * indicates p < 0.05; ** indicates p < 0.01.
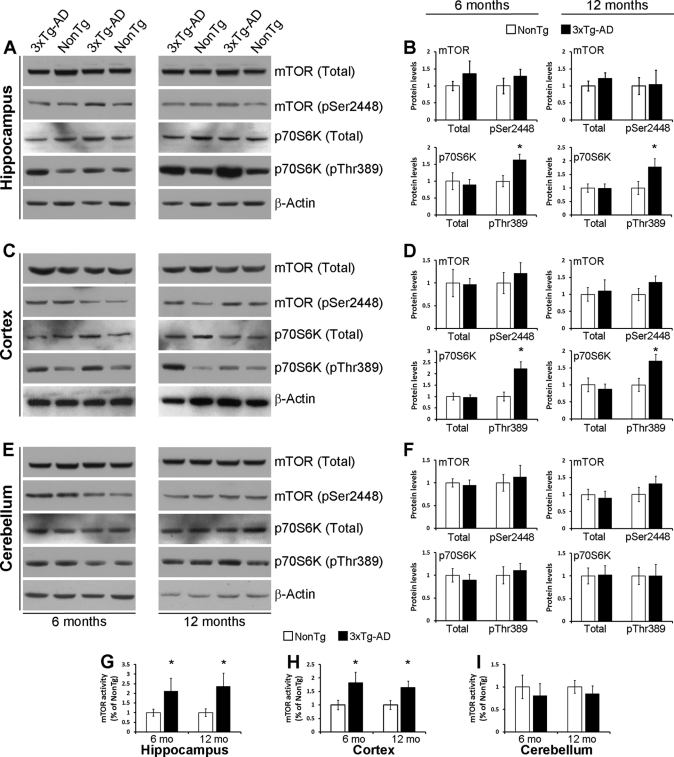
To better understand the interrelation between mTOR and Aβ in vivo, we measured mTOR signaling in different brain regions of 6- and 12-month-old 3xTg-AD mice. At 6 months of age, these mice show robust intraneuronal Aβ immunoreactivity, which is associated with the onset of cognitive decline (30, 45, 46). At 12 months of age, extracellular Aβ deposits can be detected in the CA1/subiculum area (30, 45). Somatodendritic phosphorylated Tau is also apparent at both ages (30, 45). Although the levels of total and phospho-mTOR were similar between 3xTg-AD and non-Tg mice in all brain regions analyzed at both 6 and 12 months of age (Fig. 3, A–F), we found that the levels of phosphorylated p70S6K at Thr389 were significantly higher in the hippocampus and cortex of 6- and 12-month-old 3xTg-AD mice compared with age- and gender-matched non-Tg mice, whereas total levels of p70S6K were unchanged (Fig. 3, A–D). In contrast, the levels of phospho-p70S6K were unaltered in the cerebellum of the 3xTg-AD mice (Fig. 3E), a brain region with no Aβ pathology. Consistent with the levels of phospho-p70S6K, mTOR activity was also increased in the hippocampus and cortex of 3xTg-AD compared with non-Tg mice, although no changes were found in the cerebellum (Fig. 3, G–I). Taken together, these results strongly suggest that the build-up of Aβ increases mTOR signaling and, more importantly, are consistent with reports showing an increase in mTOR signaling in human brains affected by AD (47–51).
FIGURE 3.
mTOR signaling is increased in the cortex and hippocampus of 3xTg-AD mice. A, representative Western blots of protein extracted from the hippocampus of 6- and 12-month-old 3xTg-AD and non-Tg mice and probed for total and phospho-mTOR and p70S6K. B, densitometric analysis (normalized to β-actin) shows that at both ages the levels of total and phospho-mTOR and total p70S6K were similar between 3xTg-AD and non-Tg mice. In contrast, the levels of phosphorylated p70S6K are significantly higher in 3xTg-AD mice compared with age- and gender-matched non-Tg mice (6 mice per each genotype were analyzed). C, representative Western blots of protein extracted from the cortex of 6- and 12-month-old 3xTg-AD and non-Tg mice and probed for total and phospho-mTOR and p70S6K. D, densitometric analysis of the blots (normalized to β-actin) shows that at both ages the levels of total and phospho-mTOR and total p70S6K were similar between 3xTg-AD and non-Tg mice. In contrast, the levels of phosphorylated p70S6K are significantly higher in 3xTg-AD mice compared with age- and gender-matched non-Tg mice (6 mice per each genotype were analyzed). E, representative Western blots of protein extracted from the cerebellum of 6- and 12-month-old 3xTg-AD and non-Tg mice and probed for total and phospho-mTOR and p70S6K. F, densitometric analysis of the blots (normalized to β-actin) shows that at both ages the levels of total and phospho-mTOR and total and phospho-p70S6K were similar between 3xTg-AD and non-Tg mice (6 mice per each genotype were analyzed). G–I, mTOR enzymatic activity was significantly increased in the cortex and hippocampus of 6- and 12-month-old 3xTg-AD mice compared with age- and gender-matched non-Tg mice. In contrast, no differences were detected in the cerebellum (6 mice/each genotype were analyzed). Data are presented as mean ± S.E. * indicates p < 0.01. Protein levels are expressed as arbitrary units.
Rapamycin Rescues Early Learning and Memory Deficits
We next sought to determine whether the increase in mTOR signaling contributes to the neuropathological and cognitive phenotype of the 3xTg-AD mice. Toward this end, 6-month-old 3xTg-AD (n = 16) and age- and gender-matched non-Tg mice (n = 14) were fed rapamycin-containing food (2.24 mg/kg) for 10 weeks. As controls, 3xTg-AD (n = 14) and non-Tg mice (n = 13) were fed a control diet. At this age, the 3xTg-AD mice present early learning and memory deficits (45, 52). We carefully monitored the general health of mice throughout the course of treatment and did not observe any adverse effects or significant changes in their weight gain (Table 1). At the end of treatment, rapamycin levels in the blood were assessed by high performance liquid chromatography, and as expected, the levels of rapamycin in the blood of the mice on the control diet mice were below detection. In contrast, the levels of rapamycin in the 3xTg-AD and non-Tg mice fed rapamycin were 16.13 ± 2.57 and 14.23 ± 1.46 ng/ml, respectively, which was not statistically significant (p > 0.05).
TABLE 1.
Percent of body weight change during rapamycin administration
The table shows the average body weight of each group of mice per each week of treatment. No statistical differences were detected.
| Mice | Treatment | % Weight change during the 10 weeks of treatment |
|||||||||
|---|---|---|---|---|---|---|---|---|---|---|---|
| 1 | 2 | 3 | 4 | 5 | 6 | 7 | 8 | 9 | 10 | ||
| 3xTg-AD (n = 16) | Rapamycin | 0 | −2.52 ± 1.18% | 1.55 ± 1.28% | 0.92 ± 1.01% | 5.12 ± 1.47% | 3.54 ± 1.69% | 5.65 ± 2.51% | 7.97 ± 1.57% | 9.45 ± 2.68% | 10.69 ± 2.17% |
| 3xTg-AD (n = 14) | Control | 0 | −1.41 ± 0.85% | 2.04 ± 1.36% | 2.36 ± 1.17% | 3.67 ± 1.06% | 2.80 ± 1.37% | 4.65 ± 1.22% | 7.20 ± 1.38% | 9.46 ± 1.05% | 9.24 ± 1.66% |
| Non-Tg (n = 14) | Rapamycin | 0 | 1.40 ± 0.74% | 5.88 ± 1.20% | 5.72 ± 0.93% | 7.78 ± 0.99% | 6.40 ± 1.05% | 7.68 ± 1.08% | 11.58 ± 1.31% | 13.53 ± 1.42% | 13.71 ± 1.71% |
| Non-Tg (n = 13) | Control | 0 | −0.87 ± 0.45% | 0.78 ± 0.83% | 0.87 ± 0.84% | 3.58 ± 0.96% | 4.51 ± 0.98% | 5.84 ± 1.07% | 8.56 ± 1.47% | 9.67 ± 1.43% | 13.72 ± 2.00% |
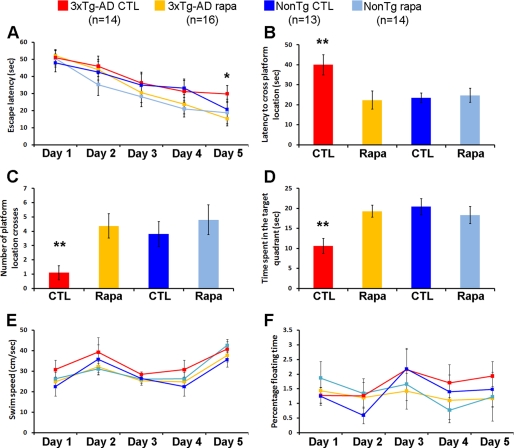
To determine the effect of chronic rapamycin administration on learning and memory, we used the spatial reference version of the Morris water maze, a task mainly dependent on the hippocampus. This task was selected because at this age the neuropathological phenotype in 3xTg-AD mice is most severe in the hippocampus (30, 53). During the last week of treatment, mice received 4 training trials per day for 5 days to find the location of a hidden platform. Although the non-Tg mice treated with rapamycin performed similarly to non-Tg controls (escape latency at day 5 of 18.8 ± 6.5 and 20.7 ± 5.9 s, respectively; Fig. 4A), the 3xTg-AD treated with rapamycin performed significantly better than 3xTg-AD mice on the control diet after 5 days of training (escape latency at day 5 of 15.3 ± 4.3 and 29.7 ± 4.8 s, respectively; Fig. 4A). Notably, the 3xTg-AD mice on rapamycin performed as well as both non-Tg groups (Fig. 4A). To determine the effects of rapamycin on memory, the platform was removed from the maze and probe trials were conducted 24 h following the last training trial. We found that under the experimental conditions used here, chronic rapamycin administration rescued the early memory deficits present in the 3xTg-AD mice, as indicated by the significantly decreased latency to cross the platform location of the 3xTg-AD mice treated with rapamycin compared with the 3xTg-AD on the control diet (Fig. 4B). Moreover, the number of platform location crosses and the time spent in the target quadrant was significantly increased in rapamycin-treated 3xTg-AD compared with 3xTg-AD mice on the control diet (Fig. 4, C and D). Overall, the 3xTg-AD mice treated with rapamycin performed similarly to the non-Tg groups in all probe trials (Fig. 4, A–D). Finally, under the conditions used here, rapamycin had no effect on learning or memory retention in the non-Tg mice (Fig. 4, A–D). Notably, rapamycin did not alter the swimming ability of all mice used as indicated by similar swimming speeds and percentage of time spent floating among the four different groups (Fig. 4, E and F). Overall, these data indicate that rapamycin administration rescued the early learning and memory deficits in the 3xTg-AD mice, and thus highlight the potential therapeutic efficacy of rapamycin.
FIGURE 4.
Rapamycin rescues early learning and memory deficits in the 3xTg-AD mice. 3xTg-AD and non-Tg mice treated or untreated with rapamycin were evaluated in the spatial reference version of the Morris water maze. A, all groups showed significant improvements over the 5 days of training. However, the escape latency of 3xTg-AD mice on rapamycin after 5 days of training was significantly lower than the 3xTg-AD on the control diet (p = 0.044). B–D, reference memory, tested 24 h after the last training trial, was significantly improved in 3xTg-AD mice on the rapamycin diet compared with 3xTg-AD mice on the control diet in all probe-trial measurements conducted. Notably, the 3xTg-AD mice on rapamycin performed as well as the non-Tg groups. E and F, swimming speed and percentage of time spent floating was not significant across the four groups of mice. Data are presented as mean ± S.E. ** indicates p < 0.01.
Rapamycin Restores Phospho-p70S6K Levels and Rescues Aβ and Tau Pathology
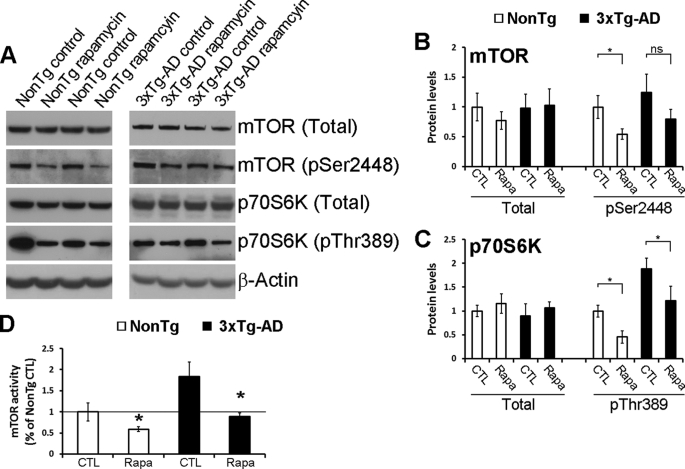
At the end of the behavioral assessment, the mice were euthanized and their brains isolated and processed for neuropathological and biochemical evaluation. Because mTOR signaling is altered in 3xTg-AD mice (Fig. 3) and because rapamycin is a well known mTOR inhibitor, we first determined the effect of chronic rapamycin administration on mTOR signaling. Although rapamycin had no effect on total and phospho-mTOR levels (Fig. 5, A and B) and on total p70S6K levels (Fig. 5, A and C), the steady-state levels of phosphorylated p70S6K at Thr389 were significantly reduced in the brains of the rapamycin-treated mice compared with genotype-matched mice on the control diet, as detected by Western blot analysis (Fig. 5, A and C). We next measured mTOR enzymatic activity and found that rapamycin significantly reduced mTOR activity in the brains of non-Tg and 3xTg-AD mice (Fig. 5D). Most notably, the levels of phosphorylated p70S6K in rapamycin-treated 3xTg-AD mice were similar to those of non-Tg mice (Fig. 5D), indicating that under these experimental conditions, rapamycin restored the elevated mTOR activity in 3xTg-AD mice without completely blocking it. This finding is highly relevant as it has been shown that mTOR signaling is necessary for learning and memory (see “Discussion”). Notably, partial blockage of mTOR activity by rapamycin may be due to the concentration of rapamycin used or the amount of rapamycin that crosses the blood-brain barrier. Nevertheless, other reports have shown that treating mice with increased mTOR activity with a rapamycin analog does not block mTOR activity but restores it to wild type levels (54), consistent with the findings reported here.
FIGURE 5.
Rapamycin restores mTOR signaling in the brains of the 3xTg-AD mice. A, representative Western blots probed for total and phosphorylated mTOR and p70S6K antibodies. B and C, densitometric analysis of the blots (normalized to β-actin) indicated, that while the levels of total and phospho-mTOR and the levels of total p70S6K were similar among all the groups, rapamycin restored the steady-state levels of phosphorylated p70S6K (n = 8/genotype/drug treatment). D, rapamycin administration significantly reduced mTOR enzymatic activity in both non-Tg and 3xTg-AD mice. Notably, mTOR activity in the rapamycin-treated 3xTg-AD mice was similar to non-Tg mice on the control food (n = 8/genotype/drug treatment). Data are presented as mean ± S.E. Protein levels are expressed as arbitrary units. * indicates p = 0.01. CTL, control.
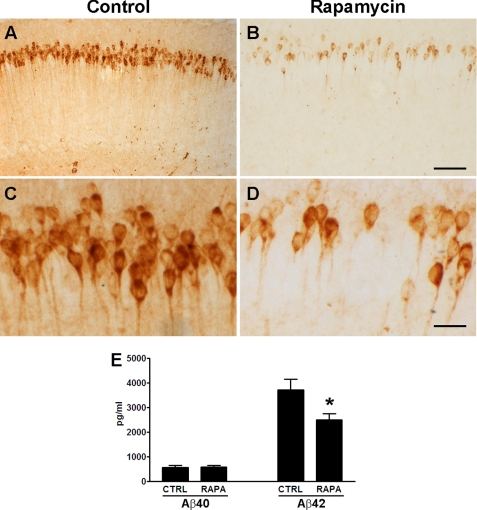
To determine the consequences of rapamycin treatment on Aβ deposition, we immunostained sections from treated and untreated 3xTg-AD mice with different anti-Aβ antibodies. At 8 months of age, the homozygous 3xTg-AD mice typically show widespread intraneuronal Aβ accumulation in various brain regions with the hippocampus being the most severely affected region. Following rapamycin treatment, we observed a marked reduction in intracellular Aβ immunoreactivity in the CA1-pyramidal neurons of the hippocampus (Fig. 6, A–D). To quantitatively assess the effect of rapamycin on Aβ levels, we next assayed the brains of treated and untreated 3xTg-AD mice by sandwich ELISA. Although rapamycin had no effect on soluble Aβ40 levels (Fig. 6E), it significantly decreased Aβ42 levels by 32.78 ± 6.68% (Fig. 6E). Note, at this age the levels of insoluble Aβ were not detectable. Consequently, the amelioration of Aβ immunoreactivity in the hippocampus of the rapamycin-treated 3xTg-AD mice is probably due to a selective reduction in Aβ42 levels. This finding is consistent with previous data showing that Aβ pathology in 3xTg-AD mice is highly dependent on Aβ42 levels (45, 55).
FIGURE 6.
Rapamycin reduces Aβ42 levels and deposition. A–D, representative microphotographs depicting CA1 pyramidal neurons of treated and untreated 3xTg-AD mice stained with an anti-Aβ42 antibody. Sections from 8 different 3xTg-AD mice on rapamycin were compared with sections from 8 different 3xTg-AD on the control diet. Panels C and D are higher magnification views of panels A and B, respectively. E, rapamycin selectively decreased soluble Aβ42 levels as measured by sandwich ELISA. Proteins were obtained from 8 different 3xTg-AD mice on rapamycin and 8 different 3xTg-AD mice on the control diet. Data are presented as mean ± S.E. Scale bar is 100 μm for A and B and 12.5 μm for C and D. * indicates p = 0.02.
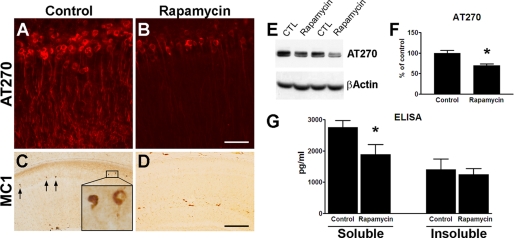
In addition to Aβ accumulation, 3xTg-AD mice develop an age-dependent accumulation of phosphorylated and aggregated Tau. Specifically, at 8 months of age the 3xTg-AD mice show somatodendritic accumulation of the phosphorylated soluble Tau species in CA1 pyramidal neuron (30, 56). Following rapamycin administration, we observed a marked reduction in Tau immunoreactivity using anti-Tau antibodies AT270 and MC-1, which recognize Tau phosphorylated at Thr181 and a conformational change of Tau that is thought to occur early in the disease process, respectively (Fig. 7, A–D). Notably, whereas MC1-positive neurons start to be apparent at this age in the hippocampi of 3xTg-AD mice, no MC1-positive neurons were detected in rapamycin-treated mice, where only background staining was present (Fig. 7, C and D). The reduction in levels of AT270 was also confirmed by Western blot analysis (Fig. 7, E and F). The modest but significant decrease in AT270 levels in the Western blot can appear to be inconsistent with the marked decrease in AT270 levels detected by immunohistochemistry (Fig. 7, A, B, E, and F). However, Western blot analysis shows an average of AT270 levels in the whole brain, whereas immunohistochemistry shows the selective changes in the CA1 pyramidal neurons. Indeed, in the amygdala the levels of AT270 were significantly decreased in 3xTg-AD mice on rapamycin compared with 3xTg-AD mice on the control diet, but the changes were not as robust as in the hippocampus (data not shown). The reason beyond these apparent differential effects of rapamycin on AT270 levels in different brains regions remain to be established.
FIGURE 7.
Rapamycin administration significantly decreases Tau pathology. A and B, representative microphotographs of CA1 pyramidal neurons stained with the anti-Tau antibody AT270, which recognizes Tau phosphorylated at Thr181, clearly indicate a decrease in AT270 immunoreactivity in mice treated with rapamycin. Sections from 8 different 3xTg-AD mice on rapamycin were compared with sections from 8 different 3xTg-AD mice on the control diet. C and D, serial sections from those shown in panels A and B were stained with the conformational-specific anti-Tau antibody MC1. Note the lack of MC1-positive neurons in the treated mice, where only background staining was detected. Sections from 8 different 3xTg-AD mice on rapamycin were compared with sections from 8 different 3xTg-AD mice on the control diet. E, representative Western blots of protein extracted from brains of 3xTg-AD mice and probed with the phospho-specific, anti-Tau antibody AT270 and with β-actin as a loading control. F, densitometric analysis of the blots (normalized to β-actin) indicates that rapamycin significantly reduced the steady-state levels of phosphorylated Tau at Thr181 (p = 0.006). Proteins were obtained from 8 different 3xTg-AD mice on rapamycin and 8 different 3xTg-AD mice on the control diet. G, ELISA measurements show that the levels of soluble Tau were significantly reduced in the brains of rapamycin-treated mice (p = 0.01). No changes were detected for insoluble Tau levels (p > 0.05). Proteins were obtained from 8 different 3xTg-AD mice on rapamycin and 8 different 3xTg-AD mice on the control diet. Data are presented as mean ± S.E. Scale bar is 100 μm for A and B and 400 μm for C and D. CTL, control.
To better quantify the changes in Tau, we also measured soluble and insoluble Tau levels by sandwich ELISA and found that rapamycin selectively decreased soluble Tau levels without affecting insoluble Tau levels (Fig. 7G). The selective reduction of soluble Tau, without changes in insoluble Tau, is consistent with the data showing that aggregated Tau is independent of soluble Tau; indeed it has been shown that suppression of transgenic Tau expression does not alter NFTs accumulation in an inducible mouse model of tauopathies (57). Similarly, previous reports indicate that Aβ immunization is sufficient to reduce soluble but not insoluble Tau levels in 3xTg-AD mice (55, 58). Taken together, these data indicate that early Tau pathology in 8-month-old 3xTg-AD mice is significantly decreased after rapamycin administration.
Autophagy Mediates the Rapamycin Effects on Aβ and Tau Pathology
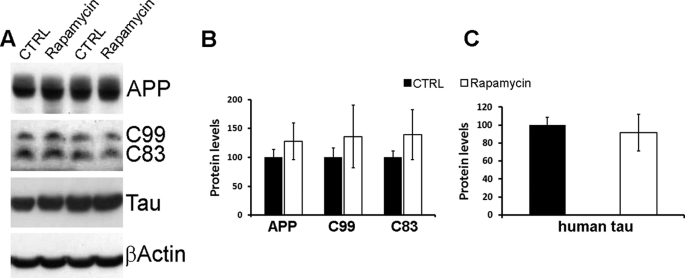
The rapamycin-mediated changes in Aβ and Tau may be due to either a decrease in their production or an increase in their degradation. To elucidate the mechanism responsible for the reduction in Aβ and Tau following rapamycin administration, we initially determined whether the decrease in Aβ levels was due to changes in its production. Toward this end, we compared the steady-state levels of APP, C99, and C83 between treated and untreated 3xTg-AD mice. Fig. 8 shows that the levels of these peptides are similar between the two groups, indicating that rapamycin does not affect APP processing and therefore Aβ production. Similarly, we found that the steady-state levels of the Tau transgene are not altered by rapamycin (Fig. 8, A and C). Taken together, these results indicate that the decrease in Aβ and Tau levels following rapamycin administration is not due to changes in their production.
FIGURE 8.
APP and Tau expression levels are not affected by rapamycin. A, representative Western blots of proteins extracted from the brains of treated and untreated 3xTg-AD mice. B, densitometric analysis of the blots (normalized to β-actin) indicates that the steady-state levels of APP and the two major C-terminal fragments (C99 and C83) were not altered by rapamycin. C, similarly, the steady-state levels of the human Tau transgene remained unchanged after rapamycin administration. For the experiments presented here, proteins were obtained from 8 different 3xTg-AD mice on rapamycin and 8 different 3xTg-AD mice on the control diet (CTRL). Data are presented as mean ± S.E. Protein levels are expressed as arbitrary units.
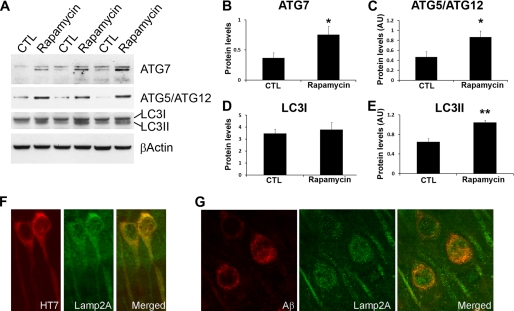
mTOR is a negative regulator of autophagy, a well conserved cellular process involved in degradation of long-lived proteins and organelles (20). Several lines of evidence indicate that decreasing mTOR function directly increases autophagy induction (24). Thus, we next sought to determine whether the rapamycin effects on Aβ and Tau were mediated by an increase in autophagy. Toward this end, we measured the levels of autophagy-related proteins Agt7 and the Atg5/Atg12 complex (which are necessary for autophagy induction) and LC3-II, which is derived from LC3-I during autophagy induction and incorporated into the growing membrane of autophagosomes, and is therefore a good indicator of autophagy induction (25–27). We found that the levels of Atg7 and the Atg5-Atg12 complex were significantly increased in the brains of the rapamycin-treated 3xTg-AD mice compared with 3xTg-AD mice on the control diet (Fig. 9, A–C). Furthermore, Western blot analysis showed that the levels of LC3-II were 1.6 times higher following rapamycin administration, whereas the levels of LC3-I remained unchanged (Fig. 9, A, D, and E). Although further studies are needed to understand why the levels of LC3I did not change in relation to the increase in LC3II levels, the data presented here are consistent with previous reports showing that Aβ increases LC3II levels without altering LC3I (59, 60). To better understand the role of autophagy pathways in the reduction of Aβ and Tau, we conducted confocal microscopy experiments and found that Tau and Aβ immunoreactivity colocalize with the lysosomal marker Lamp2A (Fig. 9, F and G), further suggesting that both Aβ and Tau are targeted to lysosomes. Specifically, we found that in the brains of the 3xTg-AD mice treated with rapamycin, 63.84 ± 11.51 and 55.32 ± 8.58% of the Lamp2A staining colocalizes with Aβ and Tau, respectively. This is significantly higher that the 3xTg-AD mice on the control diet where only 21.15 ± 5.26 and 19.27 ± 7.29% of Lamp2A staining colocalizes with Aβ and Tau, respectively. Taken together, these data show a strong correlation between the increase in autophagy and the decrease in Aβ and Tau. Thus, it is tempting to speculate that in the 3xTg-AD mice, rapamycin decreases Aβ and Tau by increasing autophagy induction.
FIGURE 9.
Rapamycin increases autophagy induction. A, representative Western blots of proteins extracted from the brains of treated and untreated 3xTg-AD mice. B and C, densitometric analysis of the blots (normalized to β-actin) indicates that rapamycin significantly increased the steady-state levels of Atg7 and the Atg5·Atg12 complex. D and E, although rapamycin did not change the levels of LC3I, it significantly increased the steady-state levels of LC3II. F and G, confocal microscopy analysis of sections from 3xTg-AD-treated mice shows that both Tau and Aβ co-localize with the lysosomal protein Lamp2A. Proteins and brain sections used for the data presented here were obtained from 8 different 3xTg-AD mice on rapamycin and 8 different 3xTg-AD mice on the control diet. Data are presented as mean ± S.E. Protein levels are expressed as arbitrary units. * indicates p < 0.01; ** indicates p < 0.05.
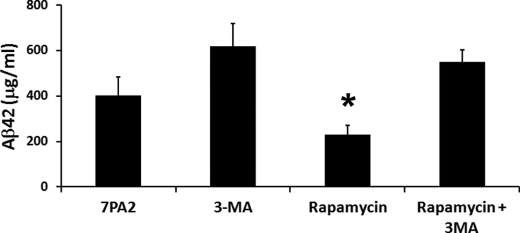
To better understand the relationship among rapamycin, Aβ, and autophagy, we conducted new experiments using 7PA2 cells. Specifically, cells were treated for 24 h with rapamycin (0.5 μg/ml) in the presence or absence of the autophagy inhibitor, 3-methyladenine (10 μg/ml). Sandwich ELISA measurements indicated that rapamycin significantly decreased intracellular Aβ42 levels (Fig. 10). In contrast, in the presence of the autophagy inhibitor 3-methyladenine, rapamycin failed to significantly decrease intracellular Aβ42 levels (Fig. 10), indicating that autophagy induction is necessary for the rapamycin-mediated decrease in Aβ levels.
FIGURE 10.
Autophagy is necessary for the rapamycin-mediated decrease in Aβ levels. 7PA2 cells were treated with various concentrations of rapamycin as indicated for 24 h. At the end of the treatment, proteins were extracted and soluble Aβ42 levels were measured by ELISA. Although rapamycin administration significantly decreased Aβ42 levels (p < 0.05), blocking autophagy with 3-methyladenine (3-MA) prevented the rapamycin-induced decrease in Aβ42 levels. All experiments shown were done in triplicate in three independent experiments; thus, we analyzed a total of 9 samples for each cell line, for each specific condition. Data are presented as mean ± S.E.
DISCUSSION
It is widely accepted that Aβ plays a central role in AD pathogenesis; however, the molecular links between Aβ and cognitive impairment remain elusive. Our data highlight mTOR as a molecular link between Aβ accumulation and cognitive dysfunction. Indeed, here we provide the first evidence showing that Aβ accumulation alters mTOR function, which has been directly linked to learning and memory. Specifically, it has been reported that hyperactive hippocampal mTOR signaling leads to long-term potentiation and learning and memory deficits in an animal model of tuberous sclerosis, which can be rescued by treating the mice with rapamycin, an mTOR inhibitor (10). Along these lines, low concentrations of rapamycin improve memory deficits associated with cannabinoids consumption (11). It should be pointed out, however, that a complete inhibition of mTOR signaling has been shown to have detrimental effects on long-term memory facilitation and consolidation in gerbils and Aplysia californica (12, 13). Nevertheless, consistent with our data showing that reduction of mTOR signaling in non-Tg mice has no effect on learning and memory, it has been shown that rapamycin at low concentrations has no effects on different behavioral tests in wild type mice while reducing mTOR signaling (10, 11). It is tempting to speculate that there may be a window of mTOR signaling that is optimal for learning and memory and alterations that would lead to an increase or decrease in mTOR signaling outside such an optimal window may have detrimental effects on learning and memory (61–63).
mTOR activity is physiologically regulated by extracellular stimuli (insulin/insulin-like growth factor, cell energy status, nutrients, and stress) via different signaling transduction pathways (8), some of which have been shown to be modulated by Aβ, including the PI3K-Akt signaling transduction pathway (41–44). Toward this end, independent studies conducted in primary neurons and microglia and in a variety of immortalized cell lines have shown that Aβ increases the PI3K-Akt pathway (41–44), which is one of the pathways that regulate mTOR signaling (8). For example, Bhaskar and colleagues (41) found that Aβ oligomers, but not monomers, increase PI3K-AKT-mTOR signaling in primary neurons. Although further studies are needed to precisely define how Aβ accumulation leads to the increase in mTOR signaling, these reports offer a possible molecular link between Aβ accumulation and mTOR function. It is clear, however, that the role of mTOR in AD is very complex; although it is established that in human AD brains mTOR signaling is increased, especially in neurons predicted to develop Tau pathology, diverging results have been published on the effects of Aβ on mTOR signaling in cell lines. For example, Aβ application to differentiated N2A neuroblastoma cells following 10% serum deprivation significantly decreases the levels of phosphorylated p70S6K (64), whereas differentiated human SH-SY5Y cells exposed to Aβ42 show an increase in phosphorylation levels of p70S6K (65). Our data showing an increase in p70S6K phosphorylation in 7PA2 cells are consistent with the latter but appear to be conflicting with the effects of Aβ on N2A cells. It should be noted that the changes in p70S6K in the N2A cells were the result of two concomitant stressors, acute serum deprivation and the acute application of high concentrations (20 μm) of aggregated Aβ. In contrast, the 7PA2 cells used for our experiments are chronically exposed to low levels of naturally produced Aβ oligomers. All these findings are consistent with the idea that different stressors may have opposite effects on mTOR in different cells or cell types, some of which may undergo cell death and some neurofibrillary degeneration (reviewed in Ref. 51).
mTOR regulates protein homeostasis, by controlling the balance between protein synthesis and degradation (8). One way that mTOR controls protein turnover is by inhibiting autophagy induction (24). In this study, we provide compelling evidence showing that autophagy induction is necessary of the rapamycin-mediated decrease in Aβ levels. The working model that emerges from these studies is that Aβ accumulation increases mTOR signaling, which in turn may further increase Aβ accumulation by blocking autophagy. The role of autophagy in AD is not well understood and contradicting reports have been published. For example, it has been reported that autophagic vacuoles may be a source of Aβ production and that autophagic vacuoles accumulate in AD brains and in APP/PS1 transgenic mice, thus suggesting that an increase in autophagy may lead to a further accumulation of Aβ (64, 66, 67). In contrast, other reports show that autophagy protects neurons from Aβ toxicity (59, 60, 68, 69). Along these lines, Wyss-Coray and colleagues (60) showed that increasing autophagy by overexpressing beclin-1, a key protein involved in autophagy induction, reduces Aβ deposits in a transgenic model of AD. To complicate this apparent contradiction, it has been shown that mTOR function, which negatively regulates autophagy, is increased in selected neurons of AD brains that are predicted to develop Tau pathology, suggesting that chronic high levels of mTOR signaling (and hence low levels of autophagy) may be detrimental in AD brains (47–51). Our data support the theory that an increase in autophagy may have a beneficial effect on AD pathogenesis.
Recent evidence indicates that Tau phosphorylation is controlled by PI3K/mTOR signaling (70). Further strengthening the mTOR/Tau link is the data arising from studies of AD brains showing that mTOR signaling is selectively increased in neurons predicted to develop NFTs and that such an increase correlates with Tau phosphorylation (49, 51, 71). This evidence has led to the hypothesis that the chronic increase in mTOR function occurring during aging may facilitate the development of Tau pathology (51). These data, together with our data showing that Aβ accumulation increases mTOR signaling, suggest that one mechanism by which Aβ may facilitate Tau pathology is by increasing mTOR signaling. Although the increase in autophagy detected following rapamycin administration may also account for the decrease in Tau pathology, we have previously shown that in 3xTg-AD mice, Tau pathology is highly dependent on Aβ levels (45, 55). Thus, it remains to be determined whether the effects of rapamycin on Tau are due to a direct interaction between mTOR and Tau or are indirectly mediated by a decrease in Aβ levels. Moreover, previous reports have shown that Tau phosphorylation may be increased by Aβ-induced inflammation (72). Considering that rapamycin is an immunosuppressant, it is possible this property of rapamycin may also account for some of the effects on Tau pathology. However, at the ages used for these studies, the 3xTg-AD mice do not show any detectable inflammatory response (72), hence it is likely that the anti-inflammatory properties of rapamycin do not play a role in the underlying molecular mechanism leading to the reduction of Aβ and Tau pathology and the amelioration of the cognitive deficits.
The mode of cell death in AD is still an unresolved issue. One theory that has been proposed is that neurodegeneration may occur after selective neurons undergo cell-cycle re-entry that eventually would lead to cell death by apoptosis (73). It is possible that hyperactive mTOR detected in a specific subset of neurons in AD brains may play a role in cell cycle re-entry and apoptosis in AD (51). The role of mTOR in apoptosis, however, appears to be dependent on different factors, as mTOR can activate both pro- and anti-apoptotic pathways. For example, there is evidence that mTOR can activate p53 and other pro-apoptotic proteins (74, 75). In contrast, it has been shown that rapamycin reduces tumor growth by inducing apoptosis (76). Thus, although our studies in the 3xTg-AD mice show that reducing mTOR signaling has a beneficial effect on learning and memory, further studies are necessary to assess whether modulation of this pathway maybe a valid therapeutic target for AD.
In summary, we provide compelling evidence showing an interrelationship between mTOR signaling and AD-like neuropathology in 3xTg-AD mice. Specifically, our data point toward mTOR as a molecular link between Aβ accumulation and cognitive dysfunction. Finally, we show that rapamycin, in addition to extending life span (14), ameliorates the AD-like pathology in 3xTg-AD mice.
Supplementary Material
Acknowledgments
We thank Dr. Edward Koo, University of California, San Diego, for the 7PA2 cells, and Fiona B. Thornton for superb technical assistance.
This work was supported, in whole or in part, by National Institutes of Health Grant AG29729-4 from the NIA (to S. O.), San Antonio Nathan Shock Aging Center Grant 1P30-AG-13319, and a grant from the Department of Veterans Affairs Enhancement Award Program.

The on-line version of this article (available at http://www.jbc.org) contains supplemental Fig. S1.
- NFT
- neurofibrillary tangle
- Aβ
- amyloid-β
- mTOR
- mammalian target of rapamycin
- ELISA
- enzyme-linked immunosorbent assay
- AD
- Alzheimer disease
- PI3K
- phosphatidylinositol 3-kinase
- Tg
- transgenic
- BisTris
- 2-[bis(2-hydroxyethyl)amino]-2-(hydroxymethyl)propane-1,3-diol
- APP
- amyloid β-precursor protein.
REFERENCES
- 1.Selkoe D. J. (2001) Physiol. Rev. 81, 741–766 [DOI] [PubMed] [Google Scholar]
- 2.Goedert M., Wischik C. M., Crowther R. A., Walker J. E., Klug A. (1988) Proc. Natl. Acad. Sci. U.S.A. 85, 4051–4055 [DOI] [PMC free article] [PubMed] [Google Scholar]
- 3.Grundke-Iqbal I., Iqbal K., Tung Y. C., Quinlan M., Wisniewski H. M., Binder L. I. (1986) Proc. Natl. Acad. Sci. U.S.A. 83, 4913–4917 [DOI] [PMC free article] [PubMed] [Google Scholar]
- 4.Ihara Y., Nukina N., Miura R., Ogawara M. (1986) J. Biochem. 99, 1807–1810 [DOI] [PubMed] [Google Scholar]
- 5.Kosik K. S., Joachim C. L., Selkoe D. J. (1986) Proc. Natl. Acad. Sci. U.S.A. 83, 4044–4048 [DOI] [PMC free article] [PubMed] [Google Scholar]
- 6.Glenner G. G., Wong C. W. (1984) Biochem. Biophys. Res. Commun. 120, 885–890 [DOI] [PubMed] [Google Scholar]
- 7.Masters C. L., Simms G., Weinman N. A., Multhaup G., McDonald B. L., Beyreuther K. (1985) Proc. Natl. Acad. Sci. U.S.A. 82, 4245–4249 [DOI] [PMC free article] [PubMed] [Google Scholar]
- 8.Wullschleger S., Loewith R., Hall M. N. (2006) Cell 124, 471–484 [DOI] [PubMed] [Google Scholar]
- 9.Loewith R., Jacinto E., Wullschleger S., Lorberg A., Crespo J. L., Bonenfant D., Oppliger W., Jenoe P., Hall M. N. (2002) Mol. Cell 10, 457–468 [DOI] [PubMed] [Google Scholar]
- 10.Ehninger D., Han S., Shilyansky C., Zhou Y., Li W., Kwiatkowski D. J., Ramesh V., Silva A. J. (2008) Nat. Med. 14, 843–848 [DOI] [PMC free article] [PubMed] [Google Scholar]
- 11.Puighermanal E., Marsicano G., Busquets-Garcia A., Lutz B., Maldonado R., Ozaita A. (2009) Nat. Neurosci. 12, 1152–1158 [DOI] [PubMed] [Google Scholar]
- 12.Casadio A., Martin K. C., Giustetto M., Zhu H., Chen M., Bartsch D., Bailey C. H., Kandel E. R. (1999) Cell 99, 221–237 [DOI] [PubMed] [Google Scholar]
- 13.Tischmeyer W., Schicknick H., Kraus M., Seidenbecher C. I., Staak S., Scheich H., Gundelfinger E. D. (2003) Eur. J. Neurosci. 18, 942–950 [DOI] [PubMed] [Google Scholar]
- 14.Harrison D. E., Strong R., Sharp Z. D., Nelson J. F., Astle C. M., Flurkey K., Nadon N. L., Wilkinson J. E., Frenkel K., Carter C. S., Pahor M., Javors M. A., Fernandez E., Miller R. A. (2009) Nature 460, 392–395 [DOI] [PMC free article] [PubMed] [Google Scholar]
- 15.Jia K., Chen D., Riddle D. L. (2004) Development 131, 3897–3906 [DOI] [PubMed] [Google Scholar]
- 16.Kaeberlein M., Powers R. W., 3rd, Steffen K. K., Westman E. A., Hu D., Dang N., Kerr E. O., Kirkland K. T., Fields S., Kennedy B. K. (2005) Science 310, 1193–1196 [DOI] [PubMed] [Google Scholar]
- 17.Powers R. W., 3rd, Kaeberlein M., Caldwell S. D., Kennedy B. K., Fields S. (2006) Genes Dev. 20, 174–184 [DOI] [PMC free article] [PubMed] [Google Scholar]
- 18.Kapahi P., Zid B. M., Harper T., Koslover D., Sapin V., Benzer S. (2004) Curr. Biol. 14, 885–890 [DOI] [PMC free article] [PubMed] [Google Scholar]
- 19.Vellai T., Takacs-Vellai K., Zhang Y., Kovacs A. L., Orosz L., Müller F. (2003) Nature 426, 620. [DOI] [PubMed] [Google Scholar]
- 20.Cuervo A. M. (2004) Mol. Cell. Biochem. 263, 55–72 [DOI] [PubMed] [Google Scholar]
- 21.Klionsky D. J., Emr S. D. (2000) Science 290, 1717–1721 [DOI] [PMC free article] [PubMed] [Google Scholar]
- 22.Jung C. H., Jun C. B., Ro S. H., Kim Y. M., Otto N. M., Cao J., Kundu M., Kim D. H. (2009) Mol. Biol. Cell 20, 1992–2003 [DOI] [PMC free article] [PubMed] [Google Scholar]
- 23.Cuervo A. M., Bergamini E., Brunk U. T., Dröge W., Ffrench M., Terman A. (2005) Autophagy 1, 131–140 [DOI] [PubMed] [Google Scholar]
- 24.Díaz-Troya S., Pérez-Pérez M. E., Florencio F. J., Crespo J. L. (2008) Autophagy 4, 851–865 [DOI] [PubMed] [Google Scholar]
- 25.Mizushima N., Noda T., Yoshimori T., Tanaka Y., Ishii T., George M. D., Klionsky D. J., Ohsumi M., Ohsumi Y. (1998) Nature 395, 395–398 [DOI] [PubMed] [Google Scholar]
- 26.Suzuki K., Kirisako T., Kamada Y., Mizushima N., Noda T., Ohsumi Y. (2001) EMBO J. 20, 5971–5981 [DOI] [PMC free article] [PubMed] [Google Scholar]
- 27.Ohsumi Y. (2001) Nat. Rev. Mol. Cell Biol. 2, 211–216 [DOI] [PubMed] [Google Scholar]
- 28.Kabeya Y., Mizushima N., Ueno T., Yamamoto A., Kirisako T., Noda T., Kominami E., Ohsumi Y., Yoshimori T. (2000) EMBO J. 19, 5720–5728 [DOI] [PMC free article] [PubMed] [Google Scholar]
- 29.Tanida I., Minematsu-Ikeguchi N., Ueno T., Kominami E. (2005) Autophagy 1, 84–91 [DOI] [PubMed] [Google Scholar]
- 30.Oddo S., Caccamo A., Shepherd J. D., Murphy M. P., Golde T. E., Kayed R., Metherate R., Mattson M. P., Akbari Y., LaFerla F. M. (2003) Neuron 39, 409–421 [DOI] [PubMed] [Google Scholar]
- 31.Oddo S., Caccamo A., Green K. N., Liang K., Tran L., Chen Y., Leslie F. M., LaFerla F. M. (2005) Proc. Natl. Acad. Sci. U.S.A. 102, 3046–3051 [DOI] [PMC free article] [PubMed] [Google Scholar]
- 32.Caccamo A., Majumder S., Deng J. J., Bai Y., Thornton F. B., Oddo S. (2009) J. Biol. Chem. 284, 27416–27424 [DOI] [PMC free article] [PubMed] [Google Scholar]
- 33.Koo E. H., Squazzo S. L. (1994) J. Biol. Chem. 269, 17386–17389 [PubMed] [Google Scholar]
- 34.Cleary J. P., Walsh D. M., Hofmeister J. J., Shankar G. M., Kuskowski M. A., Selkoe D. J., Ashe K. H. (2005) Nat. Neurosci. 8, 79–84 [DOI] [PubMed] [Google Scholar]
- 35.Podlisny M. B., Ostaszewski B. L., Squazzo S. L., Koo E. H., Rydell R. E., Teplow D. B., Selkoe D. J. (1995) J. Biol. Chem. 270, 9564–9570 [DOI] [PubMed] [Google Scholar]
- 36.Walsh D. M., Klyubin I., Fadeeva J. V., Cullen W. K., Anwyl R., Wolfe M. S., Rowan M. J., Selkoe D. J. (2002) Nature 416, 535–539 [DOI] [PubMed] [Google Scholar]
- 37.Das F., Ghosh-Choudhury N., Mahimainathan L., Venkatesan B., Feliers D., Riley D. J., Kasinath B. S., Choudhury G. G. (2008) Cell. Signal. 20, 409–423 [DOI] [PubMed] [Google Scholar]
- 38.Hay N. (2005) Cancer Cell 8, 179–183 [DOI] [PubMed] [Google Scholar]
- 39.Hay N., Sonenberg N. (2004) Genes Dev. 18, 1926–1945 [DOI] [PubMed] [Google Scholar]
- 40.Guertin D. A., Sabatini D. M. (2007) Cancer Cell 12, 9–22 [DOI] [PubMed] [Google Scholar]
- 41.Bhaskar K., Miller M., Chludzinski A., Herrup K., Zagorski M., Lamb B. T. (2009) Mol. Neurodegen. 4, 14. [DOI] [PMC free article] [PubMed] [Google Scholar]
- 42.Ito S., Kimura K., Haneda M., Ishida Y., Sawada M., Isobe K. (2007) Exp. Gerontol. 42, 532–537 [DOI] [PubMed] [Google Scholar]
- 43.Ito S., Sawada M., Haneda M., Ishida Y., Isobe K. (2006) Neurosci. Res. 56, 294–299 [DOI] [PubMed] [Google Scholar]
- 44.Martín D., Salinas M., López-Valdaliso R., Serrano E., Recuero M., Cuadrado A. (2001) J. Neurochem. 78, 1000–1008 [DOI] [PubMed] [Google Scholar]
- 45.Oddo S., Caccamo A., Tseng B., Cheng D., Vasilevko V., Cribbs D. H., LaFerla F. M. (2008) J. Neurosci. 28, 12163–12175 [DOI] [PMC free article] [PubMed] [Google Scholar]
- 46.Oddo S., Caccamo A., Tran L., Lambert M. P., Glabe C. G., Klein W. L., LaFerla F. M. (2006) J. Biol. Chem. 281, 1599–1604 [DOI] [PubMed] [Google Scholar]
- 47.Onuki R., Bando Y., Suyama E., Katayama T., Kawasaki H., Baba T., Tohyama M., Taira K. (2004) EMBO J. 23, 959–968 [DOI] [PMC free article] [PubMed] [Google Scholar]
- 48.Peel A. L., Bredesen D. E. (2003) Neurobiol. Dis. 14, 52–62 [DOI] [PubMed] [Google Scholar]
- 49.An W. L., Cowburn R. F., Li L., Braak H., Alafuzoff I., Iqbal K., Iqbal I. G., Winblad B., Pei J. J. (2003) Am. J. Pathol. 163, 591–607 [DOI] [PMC free article] [PubMed] [Google Scholar]
- 50.Chang R. C., Wong A. K., Ng H. K., Hugon J. (2002) Neuroreport 13, 2429–2432 [DOI] [PubMed] [Google Scholar]
- 51.Pei J. J., Hugon J. (2008) J. Cell. Mol. Med. 12, 2525–2532 [DOI] [PMC free article] [PubMed] [Google Scholar]
- 52.Billings L. M., Oddo S., Green K. N., McGaugh J. L., LaFerla F. M. (2005) Neuron 45, 675–688 [DOI] [PubMed] [Google Scholar]
- 53.Oddo S., Caccamo A., Kitazawa M., Tseng B. P., LaFerla F. M. (2003) Neurobiol. Aging 24, 1063–1070 [DOI] [PubMed] [Google Scholar]
- 54.Podsypanina K., Lee R. T., Politis C., Hennessy I., Crane A., Puc J., Neshat M., Wang H., Yang L., Gibbons J., Frost P., Dreisbach V., Blenis J., Gaciong Z., Fisher P., Sawyers C., Hedrick-Ellenson L., Parsons R. (2001) Proc. Natl. Acad. Sci. U.S.A. 98, 10320–10325 [DOI] [PMC free article] [PubMed] [Google Scholar]
- 55.Oddo S., Billings L., Kesslak J. P., Cribbs D. H., LaFerla F. M. (2004) Neuron 43, 321–332 [DOI] [PubMed] [Google Scholar]
- 56.Oddo S., Caccamo A., Cheng D., Jouleh B., Torp R., LaFerla F. M. (2007) J. Neurochem. 102, 1053–1063 [DOI] [PubMed] [Google Scholar]
- 57.Santacruz K., Lewis J., Spires T., Paulson J., Kotilinek L., Ingelsson M., Guimaraes A., DeTure M., Ramsden M., McGowan E., Forster C., Yue M., Orne J., Janus C., Mariash A., Kuskowski M., Hyman B., Hutton M., Ashe K. H. (2005) Science 309, 476–481 [DOI] [PMC free article] [PubMed] [Google Scholar]
- 58.Oddo S., Vasilevko V., Caccamo A., Kitazawa M., Cribbs D. H., LaFerla F. M. (2006) J. Biol. Chem. 281, 39413–39423 [DOI] [PubMed] [Google Scholar]
- 59.Hung S. Y., Huang W. P., Liou H. C., Fu W. M. (2009) Autophagy 5, 502–510 [DOI] [PubMed] [Google Scholar]
- 60.Pickford F., Masliah E., Britschgi M., Lucin K., Narasimhan R., Jaeger P. A., Small S., Spencer B., Rockenstein E., Levine B., Wyss-Coray T. (2008) J. Clin. Investig. 118, 2190–2199 [DOI] [PMC free article] [PubMed] [Google Scholar]
- 61.Cao R., Li A., Cho H. Y. (2009) J. Neurosci. 29, 12372–12373 [DOI] [PMC free article] [PubMed] [Google Scholar]
- 62.Inoki K., Corradetti M. N., Guan K. L. (2005) Nat. Genet. 37, 19–24 [DOI] [PubMed] [Google Scholar]
- 63.Zeng L. H., Rensing N. R., Wong M. (2009) J. Neurosci. 29, 6964–6972 [DOI] [PMC free article] [PubMed] [Google Scholar]
- 64.Lafay-Chebassier C., Paccalin M., Page G., Barc-Pain S., Perault-Pochat M. C., Gil R., Pradier L., Hugon J. (2005) J. Neurochem. 94, 215–225 [DOI] [PubMed] [Google Scholar]
- 65.Lafay-Chebassier C., Pérault-Pochat M. C., Page G., Rioux Bilan A., Damjanac M., Pain S., Houeto J. L., Gil R., Hugon J. (2006) J. Neurosci. Res. 84, 1323–1334 [DOI] [PubMed] [Google Scholar]
- 66.Boland B., Kumar A., Lee S., Platt F. M., Wegiel J., Yu W. H., Nixon R. A. (2008) J. Neurosci. 28, 6926–6937 [DOI] [PMC free article] [PubMed] [Google Scholar]
- 67.Yu W. H., Cuervo A. M., Kumar A., Peterhoff C. M., Schmidt S. D., Lee J. H., Mohan P. S., Mercken M., Farmery M. R., Tjernberg L. O., Jiang Y., Duff K., Uchiyama Y., Näslund J., Mathews P. M., Cataldo A. M., Nixon R. A. (2005) J. Cell Biol. 171, 87–98 [DOI] [PMC free article] [PubMed] [Google Scholar]
- 68.Ling D., Salvaterra P. M. (2009) Autophagy 5, 738–740 [DOI] [PubMed] [Google Scholar]
- 69.Ling D., Song H. J., Garza D., Neufeld T. P., Salvaterra P. M. (2009) PloS One 4, e4201. [DOI] [PMC free article] [PubMed] [Google Scholar]
- 70.Meske V., Albert F., Ohm T. G. (2008) J. Biol. Chem. 283, 100–109 [DOI] [PubMed] [Google Scholar]
- 71.Pei J. J., Björkdahl C., Zhang H., Zhou X., Winblad B. (2008) J. Alzheimers Dis. 14, 385–392 [DOI] [PubMed] [Google Scholar]
- 72.Kitazawa M., Oddo S., Yamasaki T. R., Green K. N., LaFerla F. M. (2005) J. Neurosci. 25, 8843–8853 [DOI] [PMC free article] [PubMed] [Google Scholar]
- 73.Lopes J. P., Oliveira C. R., Agostinho P. (2009) Curr. Alzheimer Res. 6, 205–212 [DOI] [PubMed] [Google Scholar]
- 74.Ferri K. F., Jacotot E., Geuskens M., Kroemer G. (2000) Cell Death Differ. 7, 1137–1139 [DOI] [PubMed] [Google Scholar]
- 75.Castedo M., Ferri K. F., Blanco J., Roumier T., Larochette N., Barretina J., Amendola A., Nardacci R., Métivier D., Este J. A., Piacentini M., Kroemer G. (2001) J. Exp. Med. 194, 1097–1110 [DOI] [PMC free article] [PubMed] [Google Scholar]
- 76.Neshat M. S., Mellinghoff I. K., Tran C., Stiles B., Thomas G., Petersen R., Frost P., Gibbons J. J., Wu H., Sawyers C. L. (2001) Proc. Natl. Acad. Sci. U.S.A. 98, 10314–10319 [DOI] [PMC free article] [PubMed] [Google Scholar]
Associated Data
This section collects any data citations, data availability statements, or supplementary materials included in this article.


