

Abstract
The regulation of enzyme activity through the transient formation of multiprotein assemblies plays an important role in the control of biosynthetic pathways. One of the first regulatory complexes to be discovered was cysteine synthase (CS), formed by the pyridoxal 5′-phosphate-dependent enzyme O-acetylserine sulfhydrylase (OASS) and serine acetyltransferase (SAT). These enzymes are at the branch point of the sulfur, carbon, and nitrogen assimilation pathways. Understanding the mechanism of complex formation helps to clarify the role played by CS in the regulation of sulfur assimilation in bacteria and plants. To this goal, stopped-flow fluorescence spectroscopy was used to characterize the interaction of SAT with OASS, at different temperatures and pH values, and in the presence of the physiological regulators cysteine and bisulfide. Results shed light on the mechanism of complex formation and regulation, so far poorly understood. Cysteine synthase assembly occurs via a two-step mechanism involving rapid formation of an encounter complex between the two enzymes, followed by a slow conformational change. The conformational change likely results from the closure of the active site of OASS upon binding of the SAT C-terminal peptide. Bisulfide, the second substrate and a feedback inhibitor of OASS, stabilizes the CS complex mainly by decreasing the back rate of the isomerization step. Cysteine, the product of the OASS reaction and a SAT inhibitor, slightly affects the kinetics of CS formation leading to destabilization of the complex.
Keywords: Enzymes/Pyridoxal Phosphate, Metabolism/Sulfur, Methods/Fluorescence, Protein/Protein-Protein Interactions, Vitamins and Cofactors/Pyridoxal Phosphate, Stopped-flow Spectroscopy
Introduction
The regulation of protein function is achieved through a large repertoire of mechanisms. In particular, in biosynthetic and catabolic pathways, feedback inhibition accounts for much of the regulation, allowing for fast and specific control of enzyme activities. A less appreciated aspect of the regulation of metabolic pathways is the formation of transient protein complexes. Substrate channeling, achieved by protein-protein interactions between enzymes that catalyze consecutive reactions in metabolic pathways, is a well characterized and efficient mechanism for protecting reactive or labile intermediates, for decreasing the transit time of intermediates, and for withdrawing them from competing reactions (1–5). However, protein interaction networks are also aimed at the fine-tuning of enzyme activity by stabilizing selected conformations. In particular, the role of protein complexes in the regulation of the cysteine biosynthetic pathway in bacteria has been recently investigated (6–17). One example is represented by the transient formation of the cysteine synthase complex (CS)3 (Scheme 1), involving the specific interaction between the enzymes catalyzing cysteine biosynthesis (Scheme 1), serine acetyltransferase (SAT), the product of cysE, and the pyridoxal 5′-phosphate (PLP)-dependent enzyme, O-acetylserine sulfhydrylase-A (OASS-A), the product of cysK. These reactions are at the branch point of the sulfur, carbon, and nitrogen assimilation pathways (Scheme 1) (18) and therefore need to be strictly regulated. In Escherichia coli OASS-A also interacts with ATP sulfurylase (19) and in Bacillus subtilis with the repressor CymR (14). OASS-A is known to interact with SAT to form a very tight (Kd ≅1 nm) complex (8). In plants, CS acts as a sensor for the levels of sulfur inside the cell, and in enterobacteria, CS function has not yet been assessed (20). The role of CS is not channeling the product of SAT, O-acetylserine (OAS), to OASS (21, 22), and in fact, OAS freely diffuses out of the complex and spontaneously converts to N-acetylserine (23). Both metabolites play a role in the transcriptional control of the cysteine operon; OAS dissociates the complex between OASS-A and the repressor CymR in B. subtilis (14), whereas N-acetylserine is a known inducer of the cysteine operon, likely via interaction with the regulator CysB (24, 25). A further level of complexity in understanding CS function in enterobacteria deals with the interplay among protein-protein interaction networks and the effects of cysteine, a product of the OASS reaction, and bisulfide, the second OASS substrate, which inhibit the activity of SAT and OASS, respectively.
SCHEME 1.

Reductive sulfate assimilation pathway in bacteria and its relations with the nitrogen and carbon assimilation pathways. Enzyme names are shown in boldface with the exception of SAT and OASS that are shown in red. Modulation of enzyme or transcriptional activity is shown with blue arrows; cysteine feedback inhibits the activity of SAT; SAT inhibits OASS activity; N-acetylserine, the product of spontaneous O-N transfer of the acetyl group of OAS, induces the transcription of the cysteine operon. Abbreviations used are as follows: ATPS, ATP sulfurylase; APSK, 5′-phosphosulfate kinase; PAPS ST, 3′-phosphoadenosine 5′-phosphosulfate sulfotransferase; NADPH-SR, NADPH-dependent sulfite reductase; PGDH, d-3-phosphoglycerate dehydrogenase; PSAT, 3-phosphoserine aminotransferase; PSP, 3-phosphoserine phosphatase; GluDH, glutamate dehydrogenase.
Although the three-dimensional structure of SAT (Fig. 1A) and OASS-A (Fig. 1B) has been determined from different species, including Haemophilus influenzae (9, 26, 27), E. coli (28, 29), Salmonella typhimurium (30–32), and Arabidopsis thaliana (6, 10), the three-dimensional structure of the CS complex has not yet been solved. However, it is well known that the C terminus of SAT (Fig. 1C) plays a major role in complex formation (9, 21, 33–35), penetrating inside the active site of OASS and binding at the α-carboxylate subsite of the substrate OAS. Simulations of complex formation suggested a role for electrostatic interactions and led to a proposed model for the structure of CS (36). This study and experiments carried out using a variety of different techniques (8, 21, 36) indicate a 2:1 stoichiometry for the CS complex, with two OASS dimers binding to one SAT hexamer. Binding of SAT to OASS induces large increases in the fluorescence emission of the cofactor, thus allowing the process to be followed (8).
FIGURE 1.

Three-dimensional structures of OASS and SAT. A, three-dimensional structure of H. influenzae SAT bound to acetyl-CoA (Protein Data Bank code 1sst (27)). The two trimers that form the hexamer are depicted in pink and green shades. Acetyl-CoA is shown in stick mode. B, three-dimensional structure of the complex between H. influenzae OASS and SAT C-terminal decapeptide (only the last four residues were visible in the density map. Protein Data Bank code 1y7l (9)). The two subunits are depicted in green and dark cyan, and the peptides are shown in stick mode. The cofactor is shown in yellow. C, close-up of the active site of H. influenzae OASS bound to SAT C-terminal peptide (9). The protein residues that interact with the peptide are shown in yellow; the tetrapeptide Ile267–Asn266–Leu265–Asn264 is shown in violet, and the cofactor is shown in cyan. Figures were prepared with PyMOL (57).
Here, we have investigated the mechanism of CS complex formation, using H. influenzae enzymes, by stopped-flow spectroscopy exploiting the fluorescence emission of PLP as a probe. We propose a two-step mechanism, where formation of a weak encounter complex, mainly entropically driven by desolvation of interacting surfaces, is followed by the slower formation of a tighter complex. The latter step is rate-limited by a conformational change, probably a closure or partial closure, of the OASS active site. The final complex is mainly stabilized by electrostatic interactions and is strengthened by bisulfide, which binds to the anion-binding site on OASS, decreasing the reverse rate of the isomerization step.
EXPERIMENTAL PROCEDURES
Chemicals and Buffers
All chemicals were purchased from Sigma and were used as received.
Bacterial Strains and Plasmids
The gene coding for H. influenzae OASS-A was cloned into pET28a as reported previously (9). The gene coding for H. influenzae SAT was cloned in the NdeI/BamHI sites of pET28a vector with retention of the hexahistidine tag and the thrombin cleavage site. Recombinant plasmids were chemically transformed in E. coli TunerTM (DE3) cells (Novagen).
Protein Expression and Purification
OASS and SAT were expressed by a standard fermentation procedure. Briefly, a single colony of transformed E. coli cells was inoculated in about 250 ml of LB broth and 30 μg/ml kanamycin and incubated overnight at 37 °C with vigorous shaking. 200 ml of the overnight culture were used to inoculate about 3.5–4 liters of growth medium in a fermentation vessel. Medium consisted of TB broth supplemented with 5 mm MgSO4, 0.5% glucose, and 30 μg/ml kanamycin (37). During fermentation, carried out at 37 °C with vigorous stirring and aeration with oxygen using filtered compressed air, antifoam (Antifoam 204, Sigma, catalog no. A6426) was added dropwise. The pH was maintained at ∼7 using a pH-stat, which drives a peristaltic pump connected to reservoirs of 5 m NaOH and 98% glycerol, respectively. In this way, pH changes serve to control the addition of a carbon source commensurate with bacterial growth (37). Expression was induced by the addition of 1 mm isopropyl 1-thio-β-d-galactopyranoside when the absorbance of the cell culture at 600 nm was about 12. Induction was carried out for about 4 h for OASS and 3 h for SAT or until the pH of the culture started to rise above 7.6. Proteins were purified by immobilized metal ion affinity chromatography using standard procedures. The preparation was treated with thrombin and purified by a further round of immobilized metal ion affinity chromatography. OASS and SAT were stored at −80 °C as concentrated stock solutions in 20 mm Hepes, 50 mm NaCl, pH 7.5, and 50 mm Tris, 50 mm NaCl, 1% glycerol, pH 7.5, respectively.
Activity Assays
Serine acetyltransferase activity was measured spectrophotometrically by coupling the production of CoASH to 5,5′-dithiobis(2-nitrobenzoate) (38). A disulfide exchange reaction gives the mixed disulfide between CoASH and 5-thio-2-nitrobenzoate and free 5-thio-2-nitrobenzoate, which absorbs maximally at 412 nm (ϵ412 = 14,150 m−1 cm−1 (39)).
Fluorescence Spectroscopy
Fluorescence measurements were carried out using a FluoroMax-3 fluorometer (Horiba Jobin Yvon, Inc.) equipped with a thermostated cell holder. Emission spectra upon excitation at 412 nm were collected between 425 and 650 nm and were corrected for buffer contribution.
Single Wavelength Stopped-flow Spectroscopy
Kinetic experiments were performed in either 100 mm Hepes buffer, pH 7 or 8, or 100 mm Ches, pH 9. Experiments were carried out under pseudo-first order conditions at either 80 nm SATtrimer or 120 nm OASSdimer. The temperature of the loading syringes and the stopped-flow cell compartment was maintained constant with a circulating water bath.
Single wavelength stopped-flow kinetic experiments were performed using an SX-18MV apparatus (Applied Photophysics) equipped with a 75-watt xenon lamp as a light source and a photomultiplier as a detector. The instrument dead time was 1.56 ms. Kinetic traces were collected upon direct excitation of the cofactor at 412 nm. The emission signal was collected at 90° with respect to the excitation source and filtered below 440 nm by a cutoff filter.
The effect of ionic strength on the kinetics of formation of the CS multienzyme complex was measured. The ionic strength of 100 mm Hepes buffer, pH 7, is 0.017 m. To increase the ionic strength to 0.117 and 0.517 m, Pipes buffer was used while maintaining the pH constant at 7. In addition, the specific effect of chloride was tested using 500 mm NaCl in 100 mm Hepes, pH 7 (ionic strength of 0.517 m).
Data Analysis
Single wavelength kinetic traces were first order and were fitted to Equation 1,
 |
where At and A0 are the fluorescence emission values at a given time and at zero time, respectively; A is the total fluorescence change, and τ is the relaxation time, such that kobs is 1/τ.
Kinetic Model
The CS bienzyme complex contains two dimers of OASS and one hexamer of SAT (8). The equilibrium for formation of the complex can be written as shown in Reaction 1,
 |
The overall equilibrium in Reaction 1 can be achieved via several possible mechanisms. Four mechanisms were considered as follows: a simple equilibrium binding, cooperative binding of OASS to SAT, a two-step mechanism with a conformational change in OASS followed by binding, and a two-step mechanism with binding followed by a conformational change. However, the kinetics of formation of the complex is simple. Formation of the complex is first order and depends, in a hyperbolic manner, on the concentration of either SAT (with OASS fixed) or OASS (with SAT fixed). In addition, no lag or burst is observed in the time course, once OASS and SAT are mixed in stopped-flow experiments. As a result, data were analyzed according to the following simple Reaction 2 with the combination of two OASS molecules to give the complex behaving independently.
 |
In Reaction 2, Kd reflects the dissociation constant for the initial interaction complex, whereas k3 and k4 are the forward and reverse rate constants for an isomerization to give the final CS bienzyme complex. Formation of the initial interaction complex is rapid, although the isomerization is slow. The dependence of the observed first order rate constant (kobs) on the concentration of either OASS or SAT with the other component maintained at a constant concentration adheres to Equation 2,
 |
where A represents the concentration of the varied component.
In a number of cases, the concentration of the varied protein was insufficient to achieve saturation, and data adhered to the following linear Equation 3,
 |
Because of the very low value of the intercept on the y axis, a large error was associated with k4 that was thus set to zero during fitting.
In some instances, the dependence of observed kinetic constants could also be fitted to a sigmoid dependence (see Ref. 40), with only small improvements in the quality of fitting. However, the absence of an auto-accelerating behavior in the kinetic traces suggests a note of caution, and data were thus fitted to the simplest model.
The dependence of the equilibrium dissociation constant on temperature was fitted to the van't Hoff Equation 4,
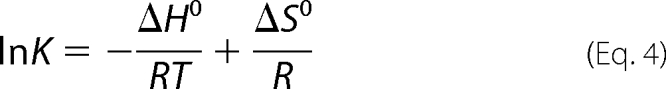 |
where K is (1/Kd), the equilibrium constant for formation of the SAT-OASS complex; ΔH0 and ΔS0 are standard enthalpy and entropy of binding, respectively; T is absolute temperature, and R is the gas constant, 0.00199 kcal/mol·K. The temperature dependence of the second order rate constant for formation of CS at limiting concentrations of OASS, and SAT was fitted to the Eyring Equation 5,
 |
In Equation 5, k3/Kd is the second order rate constant; k is Boltzmann's constant (3.298·10−27 kcal/K); h is Planck's constant (1.583·10−37 kcal·s); ΔH‡ and ΔS‡ are the activation enthalpy and entropy; and T and R are as defined above.
RESULTS
Overexpression of SAT and OASS
Stopped-flow studies of protein-protein interactions require high amounts of highly purified proteins. We were successful in combining a high yield expression system using a pET vector transformed into E. coli Tuner (DE3) cells with an optimized fermentation protocol. About 2 g of 99% pure OASS and about 3 g of 99% pure SAT were purified from 4 liters of fermentation medium.
Stopped-flow Kinetic Studies of Formation of Cysteine Synthase
Binding of SAT to OASS results in an increase in the fluorescence emission of the PLP in OASS (8), likely a result of environmental changes that occur as the α-carboxylate of the C-terminal Ile of SAT occupies the α-carboxylate subsite of OASS (Fig. 1C) (8, 9, 31, 41, 42). Specifically, the formation of a hydrogen bond between Thr69 in the active site and the α-carboxylate of the OAS in internal Schiff base linkage to PLP is thought to trigger a transition from an open to a closed form of the enzyme in the S. typhimurium OASS. Similarly, the carboxylate of the C-terminal Ile of SAT is thought to generate the closed form of the enzyme as it mimics the carboxylate of OAS (31). The increase in fluorescence emission at around 500 nm, upon excitation at 412 nm (Fig. 2, inset), was used to follow the formation of the CS multienzyme complex. Time courses were obtained, over a range of protein concentrations, under pseudo-first order conditions, varying the concentration of OASS or SAT while keeping the concentration of the other protein constant. Data were obtained at three different temperatures, 20, 12, and 5 °C (Fig. 2). In all cases, the time courses were pseudo-first order and fitted well to Equation 1. Fig. 3, A and B, show the dependence of the observed rate constants on either OASS or SAT concentration, respectively. At 20 °C, kobs is a hyperbolic function of OASS concentration with SAT maintained at a constant level. A fit of the data to Equation 2 gives Kd and k3 values of 4 ± 1 μm and 99 ± 13 s−1, respectively. Extrapolation of kobs to 0 gives a value within error equal to zero for k4, an indicator that the isomerization step favors the tight complex. The second order rate constant, k3/Kd, for formation of the tight complex is >107 m−1 s−1. If the experiment is carried out with SAT varied and OASS maintained at a constant concentration, kobs is a linear function of SAT (Fig. 3B). However, the same process, formation of the bienzyme complex, is monitored no matter which of the components is maintained fixed and which is varied. Plots appear linear in some cases because the highest concentration of the varied protein is at or below Kd, and the equation is not as well conditioned to fit the data. Although values of Kd and k3 cannot be estimated, the slope of the linear function is k3/Kd, and the value estimated from a fit to Equation 3 is, within error, identical to that obtained as a function of OASS concentration. Similar experiments were carried out at 5 and 12 °C and analyzed in the manner discussed above. Kinetic parameters are summarized in Table 1.
FIGURE 2.

Interaction of OASS and SAT as monitored by changes of fluorescence emission of PLP. Representative time courses for the reaction of OASS with SAT recorded by monitoring the fluorescence emission intensity upon excitation at 412 nm. Time courses were recorded at pH 7, 100 mm Hepes, with the concentration of OASSdimer fixed at 800 nm and the concentration of SATtrimer fixed at 80 nm. Time courses were obtained at 20 °C (black line), 12 °C (dark gray line), and 5 °C (light gray line). The dashed lines through data points represent the fit to Equation 1. Inset, fluorescence emission spectra of OASS (1.2 μm) at pH 7, 100 mm Hepes, in the absence (solid line) and presence (dashed line) of 10 μm SAT. Excitation was at 412 nm with slitex and slitem set at 5 nm. A.U., arbitrary units.
FIGURE 3.

Observed kinetic constants for the interaction of OASS and SAT as a function of temperature. A and B, dependence of kobs on the concentration of OASS and SAT. Experiments were carried out in 100 mm Hepes, pH 7, varying OASSdimer concentrations at a fixed 80 nm SATtrimer concentration (A) and varying SAT concentrations at a fixed 120 nm OASSdimer concentration (B) at 20 °C (circles), 12 °C (squares), and 5 °C (triangles). The solid lines through data points represent the fit to Equations 2 and 3. Fitted parameters are summarized in Table 1. C and D, van't Hoff and Eyring plots. The natural logarithm of K (C) and k3/Kd·T (D) obtained from fitting of dependences shown in A and B were plotted against 1/T to obtain the van't Hoff and Eyring plots, respectively. Fitting to Equations 4 and 5 allows us to calculate the following parameters: ΔH0 of 11.9 ± 1.6 kcal/mol and a ΔS0 of 0.066 ± 0.005 kcal/K·mol, from the van't Hoff plot and ΔH‡ = 13.1 ± 0.1 kcal/mol and ΔS‡ = 0.020 ± 0.002 kcal/K·mol from the Eyring plot.
TABLE 1.
Kinetic parameters for formation of cysteine synthase
Data were obtained at pH 7. Ionic strength was 0.017 m.
| 20 °C | 12 °C | 5 °C | |
|---|---|---|---|
| k3 (s−1) | 99 ± 13a | 81 ± 12a | 84 ± 10b |
| Kd (μm) | 4 ± 1a | 6 ± 1a | 12 ± 3b |
| k3/Kd (m−1 s−1)c | 25 ± 7a | 14 ± 3a | 7 ± 2b |
| (13 ± 1)b | (8.7 ± 0.1)b | (4.5 ± 0.1)a |
a Parameters were obtained with OASS varied and SAT fixed. Value in parentheses were calculated from the slope of the dependence of kobs on [OASS].
b Parameters were obtained with SAT varied and OASS fixed. Values in parentheses were calculated from the slope of the dependence of kobs on [SAT].
c Values were multiplied by 10−6.
The van't Hoff and Eyring plots of 1/Kd and k3/Kd, respectively, are shown in Fig. 3, C and D, respectively. Fitting to Equations 4 and 5 allows an estimation of ΔH0 and ΔS0 for formation of the encounter complex and ΔH‡ and ΔS‡ for the rate-limiting step. From Equation 4, ΔH0 = 11.9 ± 1.6 kcal/mol and ΔS0 = 0.066 ± 0.005 kcal/K·mol. From Equation 5, ΔH‡ = 13.1 ± 0.1 kcal/mol and ΔS‡ = 0.020 ± 0.002 kcal/K·mol.
Effect of Ionic Strength and Chloride Ion on the Kinetics of Formation of Cysteine Synthase
Increasing the ionic strength from 0.017 m, which is the approximate value for 100 mm Hepes, pH 7, to 0.117 m gives a significant decrease in the maximum rate of formation of the complex, from 99 to 35 s−1, whereas no apparent effect on Kd is observed (supplemental Fig. S1 and Table 2). Increasing the ionic strength to 0.517 m, however, results in the inability to reach saturation as the concentration of OASS is increased (supplemental Fig. S1); the second order rate constant is decreased from about 107 at 0.017 m to about 106 m−1 s−1. Kinetic parameters are summarized in Table 2.
TABLE 2.
Effect of ionic strength and chloride ion on kinetic parameters for formation of cysteine synthase
Data were obtained at pH 7. ND means not defined, and IS means ionic strength.
| 0.017 m IS | 0.117 m IS | 0.517 m IS | 0.5 m Cl−a | |
|---|---|---|---|---|
| k3 (s−1) | 99 ± 13b | 35 ± 3b | ND | ND |
| Kd (μm) | 4 ± 1b | 2.8 ± 0.7b | ND | ND |
| k3/Kd (m−1 s−1)c | 25 ± 7b | 12 ± 3b | (2.1 ± 0.2)b | (0.75 ± 0.02)b |
| 13 ± 1d | 12.0 ± 0.1d | 2.3 ± 0.1d | 0.65 ± 0.08d |
a Ionic strength was 0.517 m.
b Parameters were obtained with OASS varied and SAT fixed. Values in parentheses were calculated from the slope of the dependence of kobs on [OASS].
c Values were multiplied by 10−6.
d Parameters were obtained with SAT varied and OASS fixed. Values were calculated from the slope of the dependence of kobs on [SAT].
Chloride inhibits the activity of S. typhimurium OASS upon binding to an allosteric site, which results in a partially closed conformation that is different from that obtained when the external Schiff base of the substrate is formed (30). The Ki for chloride is about 40 mm (43), and 500 mm chloride is thus nearly saturating. The dependence of kobs on the concentration of OASS in the presence of 500 mm chloride is shown in supplemental Fig. S1, and kinetic parameters are summarized in Table 2. The rate does not saturate, and the second order rate constant is very low, about 30 times smaller than that measured at 0.017 m ionic strength.
Effect of Cysteine and Bisulfide on the Kinetics of Formation of Cysteine Synthase
Cysteine is a product of the OASS reaction and binds to the active site generating a Schiff base, competing with SAT binding to form CS, with a Kd of around 20 mm at pH 7.4 In addition, cysteine is a feedback inhibitor of SAT and binds to the SAT active site resulting in a rearrangement of the C-terminal loop (27). The Ki for SAT·cysteine is 10 μm at pH 7. With l-cysteine maintained at a concentration of 2 mm at pH 7, SAT is fully saturated, although binding of cysteine to OASS is negligible. In agreement, the emission spectrum of OASS (excitation at 412 nm) in the presence of 2 mm cysteine at pH 7 is not significantly different from the emission spectrum observed in the absence of cysteine (data not shown). The stoichiometric ratio of SAT to OASS in the presence and absence of cysteine was 1.22 and 1.33, respectively, and the intensity of the fluorescence emission at saturation was 1.3–1.5 times higher in the absence of cysteine (data not shown). A 2-fold decrease in k3 was observed in the presence of cysteine, although no significant change in the Kd for the complex was observed (Table 3 and supplemental Fig. S2, A and B).
TABLE 3.
Effect of cysteine and bisulfide on kinetic parameters for formation of cysteine synthase
Data were obtained at either pH 7 (in the presence of cysteine) or pH 8 (in the presence of bisulfide).
| pH 7 | +2 mm cysteine | pH 8 | +1 mm bisulfide | |
|---|---|---|---|---|
| k3 (s−1) | 99 ± 13a | 57 ± 14a | 91 ± 15a | 53 ± 11a |
| Kd (μm) | 4 ± 1a | 5 ± 2a | 5 ± 1a | 3 ± 1a |
| k3/Kd (m−1 s−1)b | 25 ± 7a | 11 ± 5a | 18 ± 5a | 18 ± 7a |
| 13 ± 1c | 9 ± 1c | 12.0 ± 0.2c | 13 ± 1c |
a Parameters obtained with OASS varied and SAT fixed.
b Values were multiplied by 10−6.
c Parameters were obtained with SAT varied and OASS fixed. Values were calculated from the slope of the dependence of kobs on [SAT].
The CS bienzyme complex is stabilized by bisulfide (21, 44), but the meaning of this effect is poorly understood. The pKa value for the H2S to SH− ionization is 7, and experiments were carried out at pH 8 where H2S is more than 90% dissociated to bisulfide (43, 45). Traces in the presence of bisulfide are invariably noisier than those collected in its absence. Blanks collected in the presence of bisulfide appeared noisier with respect to those collected on the buffer, an indication that turbidity due to sulfur precipitation can be responsible for the bad quality of the traces. Kinetic parameters obtained in the presence and absence of bisulfide are shown in Table 3 (supplemental Fig. S2, C and D). A small, less than 2-fold, effect on k3 is observed with no effect on the second order kinetic constant. Similar results were obtained using 100 μm bisulfide (data not shown).
pH Dependence of the Kinetic Parameters
There are only small differences in the kinetic parameters calculated at pH 7 and 8, mainly accounted for by an increase in the ionic strength from 0.017 to 0.069 m (supplemental Fig. S3). On the contrary, a larger effect is observed at pH 9 (ionic strength 0.026 m), with an increase in Kd from 4 to 13 μm, and a decrease in k3 from 99 to 55 s−1, giving a decrease in the second order rate constant of about 8-fold (Table 4).
TABLE 4.
Effect of pH on kinetic parameters for formation of cysteine synthase
Ionic strength was 0.017, 0.069, and 0.026 m at pH 7, 8, and 9, respectively.
| pH 7 | pH 8 | pH 9 | |
|---|---|---|---|
| k3 (s−1) | 99 ± 13a | 91 ± 15a | 55 ± 10a |
| Kd (μm) | 4 ± 1a | 5 ± 1a | 13 ± 3a |
| k3/Kd (m−1 s−1)b | 25 ± 7a | 18 ± 5a | 4 ± 1a |
| 13 ± 1c | 12.0 ± 0.2c | 2.2 ± 0.1c |
a Parameters were obtained with OASS varied and SAT fixed.
b Values were multiplied by 10−6.
c Parameters were obtained with SAT varied and OASS fixed. Values were calculated from the slope of the dependence of kobs on [SAT].
Activity of SAT in Cysteine Synthase
Initial rates were measured as a function of either acetyl-CoA or serine for SAT. It is reported in the literature that complex formation significantly affects the catalytic efficiency of Glycine max SAT, with an 8-fold increase in kcat/KAcCoA (15). In the case of H. influenzae SAT, there was no significant change in Km for either substrate, whether SAT is free or in complex with OASS.
DISCUSSION
Although CS was one of the first complexes involved in a metabolic pathway to be studied (21), its function in the reductive sulfate assimilation pathway is still debated, and the full network of regulatory complexes that underlies sulfur metabolism started only recently to be unveiled. It seems that the role played by CS in plants and bacteria is, at least to some extent, different. In both kingdoms, CS is at the branching point of sulfur and nitrogen assimilation pathways (Scheme 1) (18), but although bacteria rely on cysteine biosynthesis only when cysteine-starved (absence of cysteine in the growth medium), plants are primary producers and have to face situations such as dark and light cycles and changing temperatures that have a great impact on sulfur assimilation and on the biosynthesis of sulfur-containing biomolecules (11, 46). In plants and bacteria, the product of SAT, i.e. OAS, efficiently dissociates the CS complex, whereas bisulfide stabilizes it (20, 21). Furthermore, OASS activity is decreased in CS (34) down to 5% of the value for the uncomplexed enzyme in E. coli and to about 50% in S. typhimurium (21). Opposed to the report for CS in E. coli (35), plant SAT is activated in CS, mainly as a result of an increase in kcat/KAcCoA (15). Studies in Arabidopsis have suggested a sulfur-sensing role for CS (20, 47). An abundance of bisulfide stabilizes the complex, activates SAT, and leads to maximal production of cysteine. When bisulfide concentration is low, the accumulation of OAS leads to complex dissociation, to activation of the transcription of the cysteine operon (24), and to reduction of SAT activity until recovery of the sulfate-rich status. Until now, a similar regulatory effect of CS in bacteria has not been reported (11), although a central role of CS is demonstrated by the cysteine auxotrophy associated with an alteration of complex formation (48).
In the absence of a three-dimensional structure of CS, pre-steady state studies offer a powerful method to gain insight into the mechanism of complex formation. Furthermore, pre-steady state experiments are collected in solution and thus allow an understanding of the dynamics of biological systems that only on rare occasions can be attained by structural methods. In particular, stopped-flow methods allow a study of complex kinetics and determination of microscopic rate constants for multistep mechanisms. They differ from other pre-steady state methods, such as surface plasmon resonance, in that one can study the effect on the microscopic kinetic constants (i.e. on the single steps of the process monitored) of ligands, ionic strength, pH, temperature, and viscosity. However, stopped-flow investigations can only rarely be applied to bi-enzyme complex formation, due to the lack of an intrinsic spectroscopic probe and the need for high amount of proteins (about 150 mg in this study). In this view, CS is an outstanding system for dynamic investigations, due to the presence of a spectroscopic probe for complex formation and to high yields of recombinant protein attained by our group. It is noteworthy to stress that fluorescent probes, here the intrinsic chromophore PLP, are environment-sensitive and allow monitoring of processes that cannot be followed by absorbance spectroscopy.
In the case of H. influenzae CS, data obtained in these studies adhere to Reaction 2 shown under “Experimental Procedures.” The mechanism allows for the rapid formation of a weak interaction complex, which exhibits a dissociation constant, Kd. This is followed by the rate-limiting formation of a tight complex involving a conformational change. The tight complex is formed via the first order rate constant k3, and the reverse reaction is determined by the rate constant k4. At 20 °C, with OASS varied and SAT fixed at 80 nm, Kd is about 4 μm. The value of k4 is close to zero but can be estimated using a combination of the data discussed above, and the Kdoverall was estimated by equilibrium fluorescence studies and values available in the literature. Kdoverall is the dissociation constant for the (SAT·OASS)* complex to SAT and OASS in Reaction 2. The overall Kd value is the product of the Kd value for dissociation of SAT·OASS to SAT and OASS and the equilibrium constant for the conformational change in the direction of SAT·OASS, i.e. k4/k3. A value of 0.15 nm was measured for the Kdoverall of the complex in E. coli (35), whereas a value of <2 nm was estimated for CS from H. influenzae (8). Thus, for the value of 0.15 nm, Equations 6 and 7 are achieved,
 |
and
 |
whereas a value of ≤0.05s−1 was calculated using the value of ≤2 nm. Data are summarized in Reaction 3.
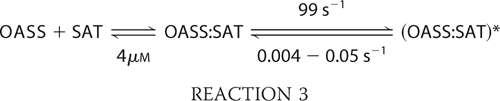 |
A value of 0.004–0.05 s−1 for k4 would be difficult to see in the experiments carried out in this study. Data suggest the overall equilibrium greatly favors the tight form of the SAT·OASS complex, with a Keq of 2.5 × 10⁴ to 2 × 10³ for the conformational change in the direction of the tight complex.
In principle, when linear and hyperbolic dependences of kobs on ligand concentration are observed, they can arise from an isomerization step preceding binding (49). In the case of CS, a step involving SAT isomerization could be feasible, but the good agreement between microscopic rate constants calculated from linear and hyperbolic dependences (see for example Fig. 3, A and B) using Equations 2 and 3 points to a ligand-induced conformational change. The conclusion that can be drawn from these results is that OASS undergoes an open to closed conformational transition, by a mechanism where binding of the C-terminal carboxylate of SAT to the active site of the enzyme triggers active site closure (31). This result becomes even more remarkable in consideration of the lack of structural data pointing to a conformational transition of OASS following complex formation. In fact, a closed conformation, superimposable with that of S. typhimurium OASS complexed with methionine (31), could not be obtained for any of the OASS·SAT C-terminal peptide complexes solved to date (9, 10, 12). A possible explanation is that the crystallization conditions lock an open structure compatible with peptide binding. However, it is more likely that only whole SAT interacting with OASS is capable of triggering the conformational transition, whereas the peptides are not. This observation is confirmed by the fact that in many instances the experimentally determined affinity of OASS for peptides is far lower than that for SAT.
The Kd value for OASS·SAT is temperature-dependent (Fig. 3C), and a fit to the van't Hoff equation gives ΔH0 of 11.9 ± 1.6 kcal/mol and a ΔS0 of 0.066 ± 0.005 kcal/K·mol. From the expression ΔG0 = ΔH0 − TΔS0 (11.9 kcal/mol − (0.066 kcal/K·mol)·(293.15 K)), a value of −7.4 ± 1.6 kcal/mol was obtained, equal within error to the value of −7.2 ± 0.9 kcal/mol calculated using ΔG0 = −RTln(1/Kd). Thus, the formation of the initial interaction complex is entropically driven, given the large value of ΔS0. Increasing the ionic strength results in the inability to saturate, an indication that the Kd has increased significantly; this is also seen in the 6-fold decrease in k3/Kd as the ionic strength increases from 0.117 to 0.517 m. As expected, the effect of ionic strength on a two-step process is mainly at the expense of the first step, i.e. formation of the encounter complex described by Kd values. Taken together, the van't Hoff analysis and data at high ionic strength suggest that formation of CS involves a desolvation step that drives the encounter between OASS and SAT, whose interaction is mainly stabilized by electrostatic bonds. This finding supports the results of a recent study on A. thaliana CS where the complex generated by docking simulations is mainly stabilized by electrostatic interactions (36). The knowledge of the solvent conditions that stabilize CS can be exploited for the rational optimization of complex crystallization, an elusive goal so far. A fit of k3/Kd in Table 1 to Equation 5 gives ΔH‡ of 13.2 ± 0.1 kcal/mol and ΔS‡ of 0.020 ± 0.002 kcal/K·mol, giving a value of 7.3 ± 0.1 kcal/mol for ΔG‡. One can consider ln(k3/Kd) consisting of ln(k3)(1/Kd), i.e. a pre-equilibrium formation of the initial OASS·SAT interaction complex followed by a slower conversion to the tight complex. Corrected values of ΔH‡ and ΔS‡ cannot be accurately calculated because of the large errors, but it is clear that the overall enthalpy and entropy of activation is dominated by the formation of the initial interaction complex.
Not surprisingly, given the role of electrostatic interactions in complex formation, the kinetics of CS assembly is pH-dependent, with a 6-fold decrease of the second order rate constant going from pH 7 to 9 (Table 4 and supplemental Fig. S3). From the limited data available, it is hard to derive conclusions. However, it seems likely that residue(s) external to the OASS active side are involved. In fact, binding of SAT C-terminal penta- and decapeptides to OASS is almost pH-independent, with a 3-fold increase in Kd values going from pH 7 to 9.4 Structural and functional data on OASS of A. thaliana and S. typhimurium suggest a role for conserved basic residues at the active site entrance (6, 50). Lys217, His221, and Lys222 (A. thaliana numbering) are fundamental for the SAT-OASS interaction, and their substitution with Ala completely abolishes binding (6), although no interactions were detected between these residues and the SAT C-terminal octapeptide (10). The stopped-flow experimental setup will allow a detailed study of the effect of such mutations on the kinetics of complex formation, and production of the mutants is currently underway in our laboratory.
The network of protein-protein interactions that regulate sulfate assimilation in bacteria is further complicated by the action of effectors that modulate enzyme activity and conformation. As opposed to other fold type II PLP-dependent enzymes, like tryptophan synthase, that bind cations with regulatory effects (51), no cation-binding site has ever been identified on OASS. On the contrary, a site for chloride has been identified in the crystal structure of S. typhimurium OASS (30). Binding of chloride induces a partially closed conformation that is intermediate between the internal aldimine open and the external Schiff base closed conformations. Because of the high dissociation constant for chloride, the biological significance of its binding to OASS is questionable, whereas it seems plausible that, in vivo, the binding site is occupied by bisulfide, which has roughly the same ionic radius (30). Inhibition of OASS activity by chloride and bisulfide (52–54) further supports the stabilization of a partially inactive conformation. Bisulfide is the product of cysteine desulfuration by intracellular desulfurases and could thus inhibit the buildup of the toxic molecule cysteine above a given concentration (30). Furthermore, a stabilizing effect of bisulfide on CS is reported (21, 44). The effect of chloride and bisulfide on the kinetics of complex formation is different, with chloride giving a 16-fold decrease of the second order kinetic constant k3/Kd and bisulfide giving almost no effect. Even though part of the effect of chloride is due to ionic strength, a 3-fold reduction of k3/Kd is ascribed to chloride binding and to a subsequent decrease in the amount of the initial interaction complex, i.e. a higher Kd. Bisulfide gives a 2-fold decrease in the value of k3 similar to the approximate 3-fold decrease in k3/Kd observed in the presence of chloride. It seems plausible that the presence of chloride and bisulfide mainly affects k4, whose value, however, cannot be determined with accuracy due to large errors associated with extrapolation to zero ligand concentration. In agreement with this observation, surface plasmon resonance experiments revealed that low affinity mutants of E. coli SAT exhibit an invariant value of kon but a larger value of koff (44). However, previous studies (44) showed that koff values in the presence of bisulfide are of the same order of magnitude as those in its absence. It should be noted, however, that by surface plasmon resonance, only an overall koff value can be calculated, i.e. in a two-step process koff is given by k2k4/(k2 + k3), and if k3 < k2, as is true in the current case, the off rate constant is approximately equal to k4. In the case of bisulfide and chloride, binding to OASS is thought to stabilize a partially closed conformation, and an increase in k2 is expected, but once the encounter complex is formed, a greater affinity of SAT for OASS should be reflected in a decrease of k4, i.e. a more stable closed conformation.
Cysteine is a product of the OASS reaction and binds to the active site of the enzyme, forming the external Schiff base of lanthionine, formed upon elimination of SH− from the cysteine external Schiff base followed by the attack of a second cysteine thiol (55). Cysteine is also a feedback inhibitor of its own synthesis, binding to the active site of SAT and competing with acetyl-CoA and serine (27). The feedback control is the most important regulatory mechanism of the cysteine biosynthetic pathway, excluding regulation of gene expression (24). Because cysteine itself can undergo S-acetylation, resulting in a poor inhibitory effect, the simultaneous binding of cysteine and acetyl-CoA to SAT is prevented by an elegant structural stratagem. The C-terminal tail of SAT binds with residues 241–257 to the cofactor-binding site thus decreasing the affinity of acetyl-CoA. Under the conditions tested here, binding of cysteine to OASS is negligible, and thus any observed effect is due to binding to SAT. As reported in Table 3, there is a 2-fold decrease in k3, the rate constant for formation of the tight complex. Although the effect reported here is small, and thus suggestive of very different affinities of the SAT C terminus for OASS- and acetyl-CoA-binding sites, a destabilization of CS in the presence of cysteine is likely. In fact, equilibrium measurements revealed that the fluorescence emission of the CS complex in the presence of cysteine is about 1.5 times lower than that in the absence of the amino acid. This is suggestive of a shift in the equilibrium toward the dissociated enzymes. In plants, CS formation relieves the intramolecular inhibition exerted by the SAT C-terminal sequence on its own activity and results in an increase of kcat/Km for acetyl-CoA (15). We cannot observe the same effect on H. influenzae SAT, in agreement with data in E. coli (35), and therefore, a different mechanism for complex regulation by effectors seems to be present in bacteria and plants. In plants, the release of the competitive intrasteric inhibition on SAT in the presence of OASS on the acetyl-CoA site allows for the increase in the activity of SAT in response to increased demand (15). It should be noticed, in fact, that cysE is not part of the cysteine regulon (24), and thus its expression is not regulated by the same sulfur starvation signals that induce transcription of the enzymes of the reductive sulfate assimilation pathway. One possible explanation relies on different basal levels of SAT and OASS expression in bacteria and plants so that in bacteria the amount of SAT is always enough for maximal OAS production.
Our results indicate that modulation by cysteine of CS functional properties is at least negligible. In fact, the concentrations of cysteine tested here (e.g. 2 mm), although higher than those physiologically relevant, exerts only a small, if any, effect on the affinity of SAT for OASS. Cysteine concentration under normal growth conditions in E. coli cells is about 200 μm and increases to about 1.5 mm in sulfur-starved, cystine-treated cells (56), e.g. in a nonphysiological condition. However, evidence suggests a relevant role for bisulfide. Putting together our results with those of previous studies (21, 30, 44), it seems likely that the anion-binding site identified on S. typhimurium OASS does not have any role in the control of OASS activity in vivo. In fact, the KI for bisulfide is about 50 μm, and although a direct measurement of bisulfide concentration has never been carried out, it is hard to think that a concentration of HS− higher than 100 μm could ever be found inside bacterial cells (24). This point needs further study, but it is likely that bacteria (differently from plants) use CS as a buffer for fully active OASS that can be quickly freed from the complex when cysteine concentration lowers below a given threshold. It should be kept in mind, in fact, that bisulfide, apart from being produced through the reduction of sulfate, is released from cysteine by the action of desulfurases and signals a sulfur-replete condition that needs OASS inhibition.
Conclusions
The rate-limiting step in the formation of the CS is a conformational change, likely an open to closed transition of OASS, that follows the formation of the initial encounter complex. The isomerization step, with a Keq of about 104–103 in the direction of the tight complex, is thus the main contribution to the reported high affinity of SAT for OASS. Interestingly, the only competitive modulator of CS is OAS, whereas both cysteine and bisulfide act on protein conformation. In fact, cysteine stabilizes a low affinity conformation of SAT where the C terminus is, at least to some extent, engaged in binding to the acetyl-CoA subsite. On the other side, bisulfide strengthens CS by stabilizing a closed conformation of OASS.
Supplementary Material
Acknowledgment
We thank Dr. Elisabetta Passera for help with optimization of the fermentation procedure.
This work was supported by the Grayce B. Kerr endowment to the University of Oklahoma (to P. F. C.), by grants from the Italian Ministry of University and Research COFIN2007 (to A. M.), and by the International Exchange Program 2005 (to A. M. and P. F. C.).

The on-line version of this article (available at http://www.jbc.org) contains supplemental Figs. S1–S3.
E. Salsi, unpublished results.
- CS
- cysteine synthase
- Ches
- 2-(cyclohexylamino)ethanesulfonic acid
- OASS
- O-acetylserine sulfhydrylase
- OAS
- O-acetylserine
- SAT
- serine acetyltransferase
- OASS-A
- O-acetylserine sulfhydrylase-A
- PLP
- pyridoxal 5′-phosphate
- Pipes
- 1,4-piperazinediethanesulfonic acid.
REFERENCES
- 1.Ovadi J. (1991) J. Theor. Biol. 152, 1–22 [PubMed] [Google Scholar]
- 2.Huang X., Holden H. M., Raushel F. M. (2001) Annu. Rev. Biochem. 70, 149–180 [DOI] [PubMed] [Google Scholar]
- 3.Miles E. W., Rhee S., Davies D. R. (1999) J. Biol. Chem. 274, 12193–12196 [DOI] [PubMed] [Google Scholar]
- 4.Bernhard S. A. (1988) Cell Biophys. 12, 119–132 [DOI] [PubMed] [Google Scholar]
- 5.Raboni S., Pioselli B., Bettati S., Mozzarelli A. (2003) Biochim. Biophys. Acta 1647, 157–160 [DOI] [PubMed] [Google Scholar]
- 6.Bonner E. R., Cahoon R. E., Knapke S. M., Jez J. M. (2005) J. Biol. Chem. 280, 38803–38813 [DOI] [PubMed] [Google Scholar]
- 7.Burns K. E., Baumgart S., Dorrestein P. C., Zhai H., McLafferty F. W., Begley T. P. (2005) J. Am. Chem. Soc. 127, 11602–11603 [DOI] [PMC free article] [PubMed] [Google Scholar]
- 8.Campanini B., Speroni F., Salsi E., Cook P. F., Roderick S. L., Huang B., Bettati S., Mozzarelli A. (2005) Protein Sci. 14, 2115–2124 [DOI] [PMC free article] [PubMed] [Google Scholar]
- 9.Huang B., Vetting M. W., Roderick S. L. (2005) J. Bacteriol. 187, 3201–3205 [DOI] [PMC free article] [PubMed] [Google Scholar]
- 10.Francois J. A., Kumaran S., Jez J. M. (2006) Plant Cell 18, 3647–3655 [DOI] [PMC free article] [PubMed] [Google Scholar]
- 11.Wirtz M., Hell R. (2006) J. Plant Physiol. 163, 273–286 [DOI] [PubMed] [Google Scholar]
- 12.Schnell R., Oehlmann W., Singh M., Schneider G. (2007) J. Biol. Chem. 282, 23473–23481 [DOI] [PubMed] [Google Scholar]
- 13.O'Leary S. E., Jurgenson C. T., Ealick S. E., Begley T. P. (2008) Biochemistry 47, 11606–11615 [DOI] [PMC free article] [PubMed] [Google Scholar]
- 14.Tanous C., Soutourina O., Raynal B., Hullo M. F., Mervelet P., Gilles A. M., Noirot P., Danchin A., England P., Martin-Verstraete I. (2008) J. Biol. Chem. 283, 35551–35560 [DOI] [PubMed] [Google Scholar]
- 15.Kumaran S., Yi H., Krishnan H. B., Jez J. M. (2009) J. Biol. Chem. 284, 10268–10275 [DOI] [PMC free article] [PubMed] [Google Scholar]
- 16.Soutourina O., Poupel O., Coppée J. Y., Danchin A., Msadek T., Martin-Verstraete I. (2009) Mol. Microbiol. 73, 194–211 [DOI] [PubMed] [Google Scholar]
- 17.Williams R. A., Westrop G. D., Coombs G. H. (2009) Biochem. J. 420, 451–462 [DOI] [PubMed] [Google Scholar]
- 18.Kopriva S., Suter M., von Ballmoos P., Hesse H., Krähenbühl U., Rennenberg H., Brunold C. (2002) Plant Physiol. 130, 1406–1413 [DOI] [PMC free article] [PubMed] [Google Scholar]
- 19.Wei J., Tang Q. X., Varlamova O., Roche C., Lee R., Leyh T. S. (2002) Biochemistry 41, 8493–8498 [DOI] [PubMed] [Google Scholar]
- 20.Hell R., Hillebrand H. (2001) Curr. Opin. Biotechnol. 12, 161–168 [DOI] [PubMed] [Google Scholar]
- 21.Kredich N. M., Becker M. A., Tomkins G. M. (1969) J. Biol. Chem. 244, 2428–2439 [PubMed] [Google Scholar]
- 22.Cook P. F., Wedding R. T. (1977) Arch. Biochem. Biophys. 178, 293–302 [DOI] [PubMed] [Google Scholar]
- 23.Kredich N. M. (1992) Mol. Microbiol. 6, 2747–2753 [DOI] [PubMed] [Google Scholar]
- 24.Kredich N. M. (1996) in Escherichia coli and Salmonella (Neidhardt F. C. ed) 2nd Ed., pp. 514–527, American Society for Microbiology, Washington, DC [Google Scholar]
- 25.Sekowska A., Kung H. F., Danchin A. (2000) J. Mol. Microbiol. Biotechnol. 2, 145–177 [PubMed] [Google Scholar]
- 26.Gorman J., Shapiro L. (2004) Acta Crystallogr. D Biol. Crystallogr. 60, 1600–1605 [DOI] [PubMed] [Google Scholar]
- 27.Olsen L. R., Huang B., Vetting M. W., Roderick S. L. (2004) Biochemistry 43, 6013–6019 [DOI] [PubMed] [Google Scholar]
- 28.Hindson V. J., Moody P. C., Rowe A. J., Shaw W. V. (2000) J. Biol. Chem. 275, 461–466 [DOI] [PubMed] [Google Scholar]
- 29.Pye V. E., Tingey A. P., Robson R. L., Moody P. C. (2004) J. Biol. Chem. 279, 40729–40736 [DOI] [PubMed] [Google Scholar]
- 30.Burkhard P., Tai C. H., Jansonius J. N., Cook P. F. (2000) J. Mol. Biol. 303, 279–286 [DOI] [PubMed] [Google Scholar]
- 31.Burkhard P., Tai C. H., Ristroph C. M., Cook P. F., Jansonius J. N. (1999) J. Mol. Biol. 291, 941–953 [DOI] [PubMed] [Google Scholar]
- 32.Burkhard P., Rao G. S., Hohenester E., Schnackerz K. D., Cook P. F., Jansonius J. N. (1998) J. Mol. Biol. 283, 121–133 [DOI] [PubMed] [Google Scholar]
- 33.Mino K., Hiraoka K., Imamura K., Sakiyama T., Eisaki N., Matsuyama A., Nakanishi K. (2000) Biosci. Biotechnol. Biochem. 64, 1874–1880 [DOI] [PubMed] [Google Scholar]
- 34.Mino K., Yamanoue T., Sakiyama T., Eisaki N., Matsuyama A., Nakanishi K. (1999) Biosci. Biotechnol. Biochem. 63, 168–179 [DOI] [PubMed] [Google Scholar]
- 35.Mino K., Yamanoue T., Sakiyama T., Eisaki N., Matsuyama A., Nakanishi K. (2000) Biosci. Biotechnol. Biochem. 64, 1628–1640 [DOI] [PubMed] [Google Scholar]
- 36.Feldman-Salit A., Wirtz M., Hell R., Wade R. C. (2009) J. Mol. Biol. 386, 37–59 [DOI] [PubMed] [Google Scholar]
- 37.Riek U., Tuerk R., Wallimann T., Schlattner U., Neumann D. (2008) BioTechniques 45, 187–189 [DOI] [PubMed] [Google Scholar]
- 38.Johnson C. M., Huang B., Roderick S. L., Cook P. F. (2004) Arch. Biochem. Biophys. 429, 115–122 [DOI] [PubMed] [Google Scholar]
- 39.Riddles P. W., Blakeley R. L., Zerner B. (1983) Methods Enzymol. 91, 49–60 [DOI] [PubMed] [Google Scholar]
- 40.Li S., Rosen B. P., Borges-Walmsley M. I., Walmsley A. R. (2002) J. Biol. Chem. 277, 25992–26002 [DOI] [PubMed] [Google Scholar]
- 41.McClure G. D., Jr., Cook P. F. (1994) Biochemistry 33, 1674–1683 [DOI] [PubMed] [Google Scholar]
- 42.Schnackerz K. D., Tai C. H., Simmons J. W., 3rd, Jacobson T. M., Rao G. S., Cook P. F. (1995) Biochemistry 34, 12152–12160 [DOI] [PubMed] [Google Scholar]
- 43.Tai C. H., Burkhard P., Gani D., Jenn T., Johnson C., Cook P. F. (2001) Biochemistry 40, 7446–7452 [DOI] [PubMed] [Google Scholar]
- 44.Zhao C., Moriga Y., Feng B., Kumada Y., Imanaka H., Imamura K., Nakanishi K. (2006) Biochem. Biophys. Res. Commun. 341, 911–916 [DOI] [PubMed] [Google Scholar]
- 45.Hedderich R., Klimmek O., Kröger A., Dirmeier R., Keller M., Stetter O. K. (1999) FEMS Microbiol. Rev. 22, 353–381 [Google Scholar]
- 46.Kumaran S., Jez J. M. (2007) Biochemistry 46, 5586–5594 [DOI] [PubMed] [Google Scholar]
- 47.Wirtz M., Droux M., Hell R. (2004) J. Exp. Bot. 55, 1785–1798 [DOI] [PubMed] [Google Scholar]
- 48.Becker M. A., Tomkins G. M. (1969) J. Biol. Chem. 244, 6023–6030 [PubMed] [Google Scholar]
- 49.Garland D. L. (1978) Biochemistry 17, 4266–4272 [DOI] [PubMed] [Google Scholar]
- 50.Tai C. H., Rabeh W. M., Guan R., Schnackerz K. D., Cook P. F. (2008) Biochim. Biophys. Acta 1784, 629–637 [DOI] [PubMed] [Google Scholar]
- 51.Peracchi A., Mozzarelli A., Rossi G. L. (1995) Biochemistry 34, 9459–9465 [DOI] [PubMed] [Google Scholar]
- 52.Kredich N. M., Tomkins G. M. (1966) J. Biol. Chem. 241, 4955–4965 [PubMed] [Google Scholar]
- 53.Cook P. F., Wedding R. T. (1976) J. Biol. Chem. 251, 2023–2029 [PubMed] [Google Scholar]
- 54.Tai C. H., Nalabolu S. R., Jacobson T. M., Minter D. E., Cook P. F. (1993) Biochemistry 32, 6433–6442 [DOI] [PubMed] [Google Scholar]
- 55.Woehl E. U., Tai C. H., Dunn M. F., Cook P. F. (1996) Biochemistry 35, 4776–4783 [DOI] [PubMed] [Google Scholar]
- 56.Park S., Imlay J. A. (2003) J. Bacteriol. 185, 1942–1950 [DOI] [PMC free article] [PubMed] [Google Scholar]
- 57.DeLano W. L. (2002) The PyMOL Molecular Graphics System, DeLano Scientific LLC, San Carlos, CA [Google Scholar]
Associated Data
This section collects any data citations, data availability statements, or supplementary materials included in this article.