

Abstract
There are two predominant theories for lumen formation in tissue morphogenesis; cavitation driven by cell death, and membrane separation driven by epithelial polarity. To define the mechanism of lumen formation in prostate acini we examined both theories in several cell lines grown in 3D Matrigel culture. Lumen formation occurred early in culture and preceded the expression of cell death markers for apoptosis (active caspase 3) and autophagy (LC-3). Active caspase 3 was expressed by very few cells and inhibition of apoptosis did not suppress lumen formation. Despite LC-3 expression in all cells within a spheroid, this was not associated with cell death. However, expression of the prostate secretory protein coincided with lumen formation and subsequent disruption of polarized fluid movement led to significant inhibition of lumen formation. This work indicates that lumen formation is driven by the polarized movement of fluids and proteins in 3D prostate epithelial models and not by cavitation.
Keywords: Prostate, lumen, polarization, development, cell death
Introduction
The functional unit of glandular tissues such as the prostate, breast and lung is based on a spherical unit of epithelia known as an acinus. A single or bilayer of polarized epithelia, encircle a liquid filled lumen. The mechanisms controlling epithelial polarity and lumen formation are poorly understood, however, three dimensional (3D) modelling of cells in vitro has provided valuable insights. The most important studies have arisen from 3D culture of MDCK (Madin-Derby canine kidney) cells in collagen 1 gels 1. Results from this work have led to the proposal that epithelia are driven by an intrinsic programme to form 3 surfaces; a basal surface which interacts with the basement membrane through integrin molecules, a lateral membrane where adjacent cells contact through E-cadherin, tight junctions and desmosomes and an apical membrane which faces the lumen 2,3. The establishment of epithelial polarity was followed by cellular proliferation and lumen formation occurred as the apical membranes separated 3. Membrane separation was also the proposed mechanism of lumen formation in zebrafish models and blastocoel formation in embryos4, 5. Under the control of tcf2, Na+/K+ATPase expression generates an electrochemical gradients which drives ion movement and therefore fluid movement and accumulation leading to the formation and maintenance of an open luminal space in vivo.
Using 3D Matrigel models to recapitulate breast acini there has been much important research by the groups of Brugge and Bissel to understand breast epithelial morphogenesis and lumen formation 6, 7. Breast epithelia form solid cell masses which then cavitate using a mechanism similar to that seen in embryogenesis 8, 9. Cavitation occurred by a co-ordinated mechanism of inner cell mass death by apoptosis, and basement membrane signalling of survival of the cells lining the cavity 10. Autophagy has also been implicated in developmental tissue remodeling and differentiation and has been proposed as a mechanism of cell death in breast luminal cell clearance 9, 11. Autophagy is activated during situations of cellular stress and starvation, resulting in autophagic vacuoles which engulf cellular proteins, organelles or cytoplasm to recycle nutrients. This has led to autophagy becoming known as a self-eating mechanism - however it is uncertain whether it can cause cell death directly. Autophagy acts as a clearance mechanism after apoptotic cell death and autophagy gene deficient embryoid bodies fail to cavitate, due to the failure of autophagic cells to clear the cellular debris 12.
Therefore, two predominant theories exist for lumen formation; cavitation by cell death, and membrane separation. There have been no studies to examine lumen formation in prostate acini. Our unpublished observations from 3D modeling indicated that prostatic lumen form early in culture and they developed slowly as the acinus grows in size, with little observable cell death and or cavitation. To understand the mechanism of lumen formation in prostatic acini we examined both theories of lumen formation in several prostatic cell lines and primary cell cultures. We discovered that lumen formation was driven by the polarized movement of fluids and proteins, and not by an apoptotic driven cavitation.
Results
Caspase dependent cell death is infrequent in Prostatic acini
Prostatic three-dimensional cultures form hollow and solid acinus-like spheroids. This morphology is not dependent on the malignant status of the cell 13, 14. To investigate lumen formation we examined 4 cell lines (RWPE-1, BPH-1, Shmac 5, PC-3) all known to form acini with a lumen. Formation of prostatic luminal structures occurs early in culture, between days 2 to 4 of culture (figure 1), this is similar to the MDCK cell line 15, but in contrast to the breast cell line MCF10A which does not develop lumen in 3D until day 10 to 12 16. Figure 1 illustrates the growth of BPH-1 acini at days 2, 3, 4, 5 and 7 of culture. Phase images indicate that lumen can be seen by day 3 of culture. This was typical of all the cell lines (results not shown). Using confocal microscopy to transect the acini, and expression of prostate specific antigen (PSA) to mark the area of the cell, lumen formation was visible by day 3. Our previous observations of prostatic acini indicated very little cell death and electron microscopy indicates that very little cellular debris exists in the middle of prostatic acini (figure 1b). To assess the level of cell death occurring in 3D acini we labelled acini for active caspase 3 or LC-3 (markers of apoptosis and autophagy respectively). To compare the level of apoptosis in acini grown from different prostate cell lines we counted the number of active caspase 3 positive cells as a percentage of the total number of cells in an acinus (summarised in figure 2a). There is always heterogeneity in the architecture of acini within a culture derived from primaries or cell lines 17, 18, therefore, we established the median count of 10 random acini. Spheroids grown from Hela cells clearly showed strong staining for both markers at day 7 of culture with no lumen formation (figure 1c), whilst MCF-10A cells showed positive expression of caspase 3, but not LC-3 (figure 1d). Spheroids were analysed at each day for the presence of active caspase 3 but only after 7 days growth did we detect consistent positive staining for 2% of the total cells within an acinus (figures 1a and 2a). Positive cells were found in the central lumen (figure 1a). Analysis of the other three cell lines confirmed that caspase 3 staining was not detected before lumen formation (at days 2 or 3, results not shown). In contrast, Hela cells grown for 7 days under the same culture conditions demonstrated that many more cells (7.5%) were positive for active caspase 3 (figure 2a) and were also positive at day 4 (results not shown).
Figure 1. Caspase dependent cell death is an infrequent event in prostatic acini.
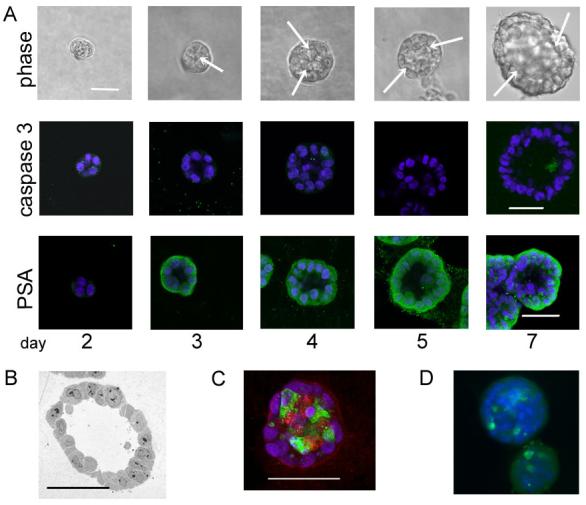
A. BPH-1 cells were grown in Matrigel for the indicated number of days. Acini were fixed and stained for active caspase 3 (green) or PSA (green), nuclei were counterstained with DAPI. Representative images are shown that cross section through the middle of acini. Arrows indicate the edge of the forming lumen. The experiments shown are representative of a minimum of three replicates.
B. Transmission electron microscopy of a BPH-1 acinus grown in Matrigel for 7 days.
C. and D. Representative image of Hela (C) and MCF-10A 9 (D) cells grown in Matrigel for 7 days, fixed and stained for active caspase 3 (green) and LC-3 (red). Nuclei were counterstained with DAPI (blue). All bars indicate 50 μm.
Figure 2. Caspase dependent cell death in acini derived from cell lines and primary cells.
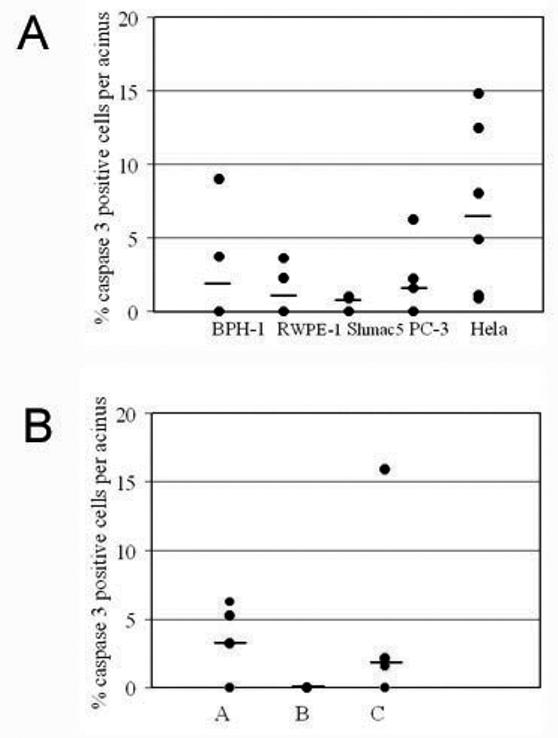
Indicated cell lines (A) or primary cells (B) were grown in Matrigel for 7 days and then fixed and stained for active caspase 3. The number of cells in an acinus which stained positively for active caspase 3 was counted and calculated as a percentage of the total cells present per acinus. The percentage of caspase 3 positive cells was calculated for 10 acini selected at random. Each acini is represented as a single spot. Some spots represent multiple points. The bar indicates the median value for each cell line. Primary cultures were derived from patients (A, B or C).
Primary cultures form lumen at varying rates between different patient samples. On average we found that 35% of acini were hollow at day 5 and 56% at day 7. Importantly, analysis of hollow acini grown from three different primary epithelial cell cultures also found that a low (0-3%) percentage of cells expressed active caspase 3 (figure 2b).
To test whether caspase dependent cell death was a requisite for lumen formation in prostatic acini we cultured both RWPE-1 and BPH-1 cells in the presence of a general caspase inhibitor (Z-VAD-FMK). In the presence of inhibitor we found a large and significant (p<0.001) reduction in the number of acini containing cells expressing active caspase 3 (figure 3a) but there was little or no reduction in the number of acini which were hollow at 7 days (figure 3b) or 4 days culture (results not shown). Analysis of the acini by confocal microscopy indicated that whilst the acini maintained a lumen, the lumen frequently contained more cells (figure 3c and S1).
Figure 3. Inhibition of caspase dependent cell death in prostatic acini.
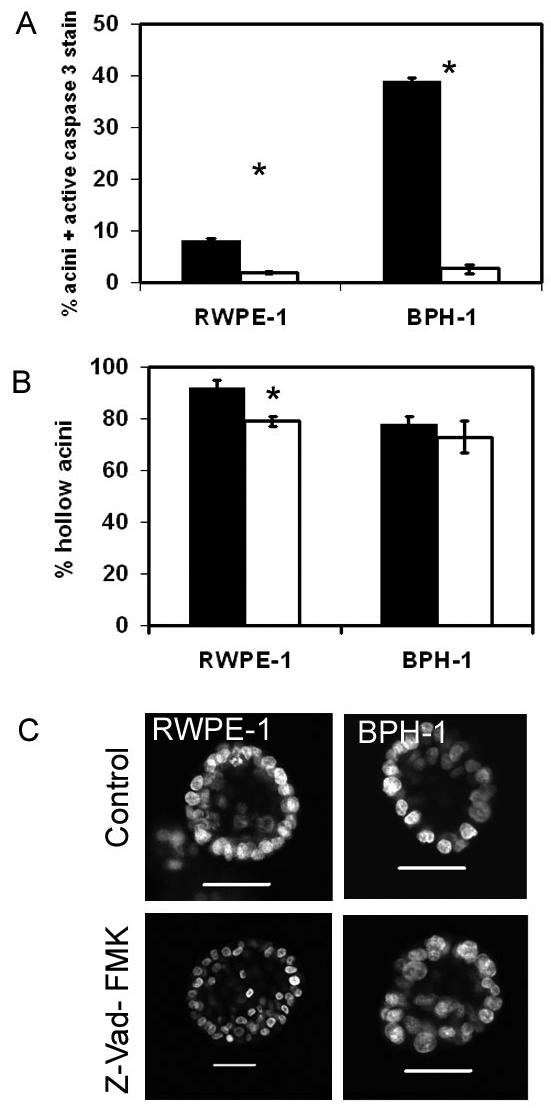
Prostate cells were grown in Matrigel for 2 days and then grown in the presence of 100 μM Z-VAD-FMK (open) or DMSO control (filled). Acini were grown for a further 4 days and then fixed and stained for active caspase 3, nuclei were counterstained with DAPI. A hundred acini were counted for the expression of active caspase 3 (A) or the presence of lumen (B). The graphs indicate the results of 3 replicate experiments ± sem, * p<0.015 (students t-test). Representative images of RWPE-1 or BPH-1 cells grown with or without caspase inhibitor, and nuclei were counterstained with DAPI are shown in (C). All bars indicate 50 μm. Images are cross-sections through the middle of acini.
Prostatic acini express the autophagic marker LC3
Autophagy has been proposed as an alternative cell death mechanism involved in lumen formation due to cavitation8. To investigate the presence of autophagy in 3D cultures of prostatic acini we looked for expression of the marker LC-3. After 7 days culture in Matrigel, RWPE-1 cells showed strong and punctate expression of LC-3 by immunohistochemistry (figure 4a). This pattern of staining was associated with the presence of active autophagic vacuoles and was seen in all cells of the acini and all acini examined. LC-3 expression was not seen in any cell line at day 3 or 4 (results not shown). BPH-1 cells showed very weak expression of LC-3 staining (figure 4c), to confirm expression, immuoblotting was performed on all cell lines grown in monolayer and 3D (figure 4e). All cell lines in both culture conditions showed the expression of both LC-3 I (18kDa) and LC-3 II (16kDa). Conversion of LC-3 I to LC-3 II by proteolysis is indicative of autophagic activity and therefore confirms active autophagy in all cell lines. Only RWPE-1 cells showed punctuate expression of LC-3 at day 3 or 4, this was in 30% of all acini counted and within all the cells of those acini (results not shown). Punctate expression of LC-3 was observed in acini grown from primary epithelia (3/3 tissue cultures) and in the luminal cells of adult prostate tissue (3/3 tissue samples). Therefore, autophagy is present and active in vivo (figure 4b and d). Since we have demonstrated cavitation does not occur in prostate acini and that the expression of LC-3 is seen within the growing cells of an acinus, the results suggest that autophagy is not causing cell death but plays another role.
Figure 4. Expression of autophagy markers by prostatic acini.
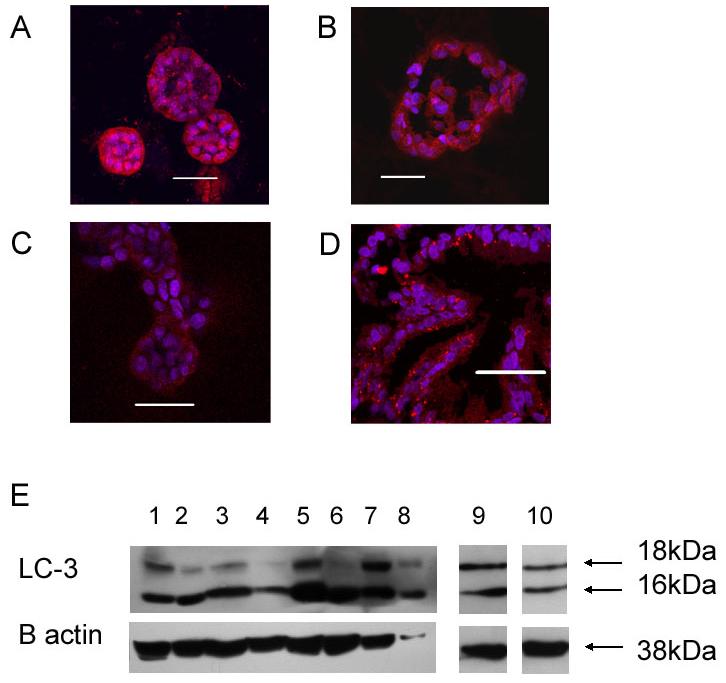
A-D. Immunohistochemical expression of LC-3 in cell lines (A, RWPE-1; C, BPH-1) grown in Matrigel for 7 days, primary cultures grown for 14 days (B) or normal prostate tissue (D). Acini were fixed and stained for LC-3 (red) and nuclei were counterstained with DAPI. Representative images are shown that cross-section through the middle of acini. All bars indicate 50 μm.
E. Acini prepared as described above were immunoblotted for LC-3. Lanes are as follows: 1, BPH-1 grown in monolayer culture; 2, BPH-1 grown in 3D Matrigel; 3, Shmac 5, in monolayer; 4, Shmac 5 in 3D; 5, RWPE-1 in monolayer; 6, RWPE-1 in 3D; 7, PC-3 in monolayer; 8, PC-3 in 3D; 9, Hela in monolayer; 10, primary prostate cells (patient D). ß actin was used to indicate protein loading.
The expression of polarization markers and lumen morphogenesis
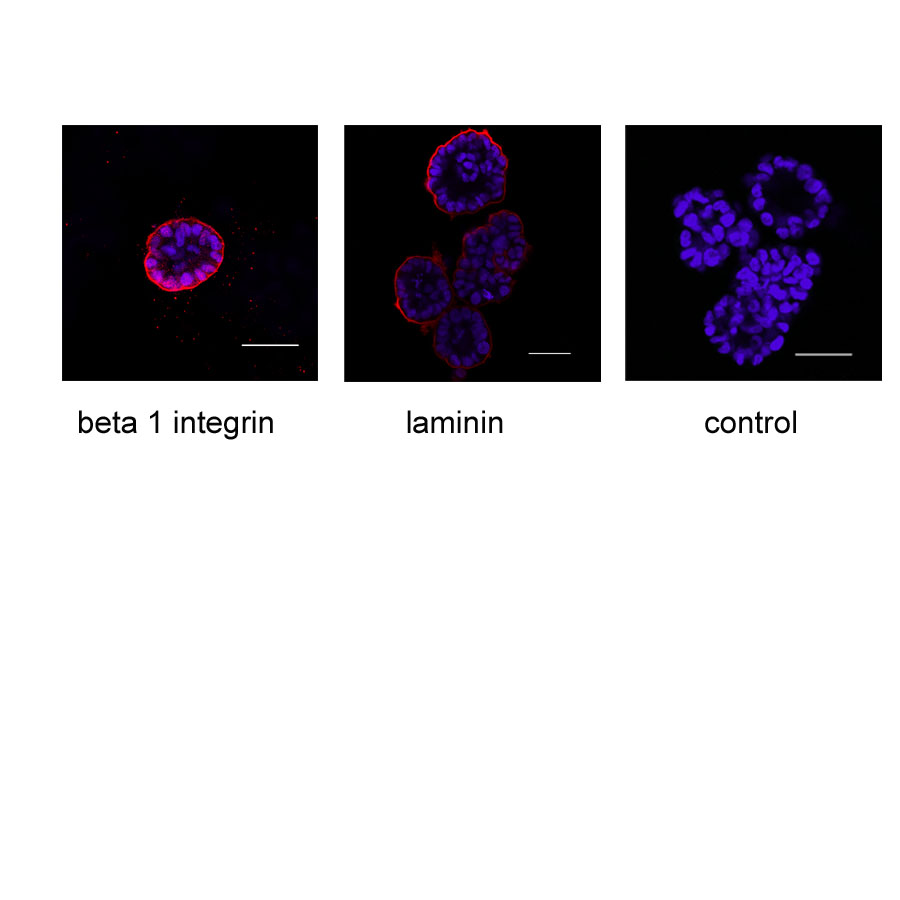
To better understand how luminal structures form in 3D culture we examined the contribution of cellular polarization. We tracked the appearance of several polarization markers over 7 days in 3D BPH-1 and RWPE-1 culture (results summarized in table 1 and table S1). Basal membrane polarization was tracked using the expression of β1 and β4 integrin. Expression of E-cadherin was used to identify the organization of lateral membrane domains, while expression of PSA was used to indicate establishment of secretory function. Acini were able to secrete a basement membrane, this was monitored using antibodies specific to human laminin. Lumen formation was clearly visible after 3- 4 days in culture (figure 5). After one day in culture both E-cadherin and β4 integrin were expressed at the cell membrane of single or doublet cells. After 2 days in culture acini have 2-5 cells and β4 integrin expression was polarised to the basal membrane, whilst E-cadherin remained expressed on all cell membranes. By day 3-4 expression of E-cadherin became basolateral and expression was lost from the apical membrane. β1 integrin and laminin were not strongly expressed until day 7 of culture, at which time both markers were basally expressed (supplementary figure S2). PSA expression was apparent after three days of culture (figure 1a). Beyond 7 days no visible differences in culture morphology or phenotype were noted. Similar findings were found for the RWPE-1 cell line (supplementary table S1). PSA was the only marker found in both cell lines to co-express with lumen formation.
Table 1. Time course analysis of polarization markers and lumen formation in BPH-1 prostatic acini.
| marker\ day | 1 | 2 | 3 | 4 | 7 |
|---|---|---|---|---|---|
| Lumen | − | − | + | + | + |
| ß1 integrin | − | − | − | − | + |
| ß4 integrin | + | + | + | + | + |
| E-cadherin | + | + | + | + | + |
| PSA | − | − | + | + | + |
| Laminin | − | − | − | − | + |
Figure 5. Polarisation of E-cadherin and beta 4 integrin in BPH-1 epithelial acini.
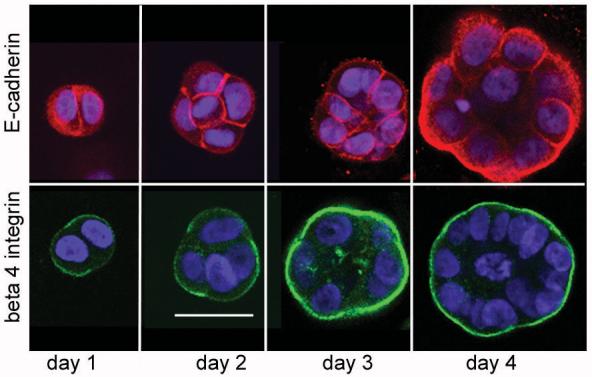
BPH-1 cells were grown in Matrigel for the indicated number of days. Acini were then fixed and stained for E-cadherin (red) or beta 4 integrin (green), nuclei were counterstained with DAPI. Representative images (of 3 independent experiments) are shown that cross section through the middle of cells or developing acini. Images were taken at x20 magnification, the bar indicates 50 μm.
Inhibition of polarised fluid movement prevents lumen formation
The finding that secretory protein expression follows the same time course as lumen formation strongly indicated that polarized fluid movement may provide a mechanism for lumen formation in adult epithelial acini, using a mechanism recently identified in Zebrafish models4 and human embryos5. To test this idea we inhibited the paracellular fluid movement of polarised epithelia using ouabain to disrupt the electrochemical gradient established by the Na+/K+ ATPase. Figure 6a indicates that 1 nM ouabain could significantly inhibit the formation of single lumen containing acini in BPH-1 and RWPE-1 acini. BPH-1 cells were particularly sensitive to ouabain, in control conditions 84% of acini contained single lumen, whilst after treatment with ouabain only 13% of acini contained single lumen. At 1nM Ouabain was not toxic to the cells, and the acini could be maintained for several more days in culture (results not shown). Similar results were found if Ouabain was added before or after lumen formation (at 2 days or 5 days culture). If Z-VAD-FMK was added in combination with ouabain, there was no further inhibition of lumen formation (results not shown). Immunohistochemical analysis revealed that inhibition of Na+/K+ ATPase caused multiple lumen formation or complete loss of lumen (figure 6b and d). This finding was identical to the response of MDCK cysts to ouabain4. Ouabain also inhibited PSA expression in both cell lines and E-cadherin expression in BPH-1 acini (figure 6). Quantification of immunohistochemical results indicated that 88% of BPH-1 acini lost both hollow lumen and expression of PSA, whilst 82% lost both lumen and had decreased E-cadherin expression. RWPE-1 cells were less sensitive to ouabain and 60% of acini lost hollow lumen whilst, 79% lost PSA expression and 53% showed a loss or decreased E-cadherin expression. Lumen formation was also significantly inhibited by inhibition of Na+/K+ ATPase activity with a monoclonal antibody (figure 6c and 6d)19.
Figure 6. Ouabain and anti-Na+/K+ATPase inhibition of lumen formation in prostatic acini.
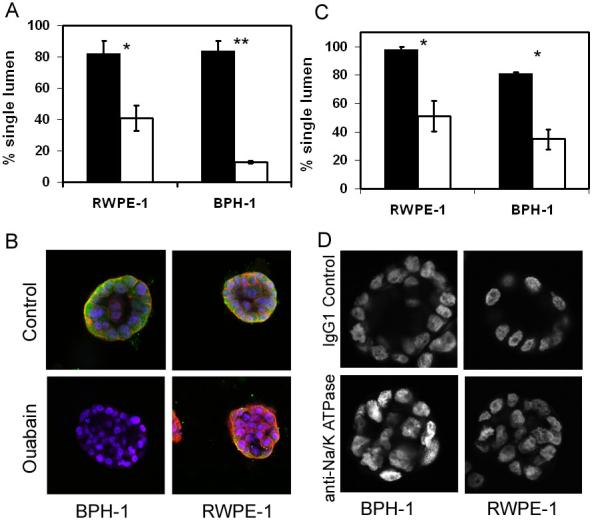
A. RWPE-1 or BPH-1 cells were grown in 3D Matrigel culture for 4 days and then treated with 1 nM ouabain (open) or DMSO control (filled). After 24 hours culture 50 acini were counted for the presence of single lumen. B. Acini were stained for E-cadherin (red) and PSA (green), nuclei were counterstained with DAPI. Images were taken at x20 magnification.
C. Cells were plated into 3D Matrigel and treated with 1/100 IgG1 control (filled) or 1/100 anti-Na+/K+ ATPase (open) for 6 days. 50 acini were counted for the presence of single lumen. All graphs indicate the results of 3 replicate experiments ± sem, * p<0.05, **p<0.0003 (students t-test). D. Acini were stained with DAPI and mid-section images were taken at x20 magnification.
Discussion
Morphogenesis is driven by the co-ordinated regulation of polarity, apoptosis, migration, proliferation and differentiation. The mechanisms connecting them all are unknown but many similarities exist between different developing tissues suggesting a common mechanism. Present knowledge suggests that the important mechanisms for luminal morphogenesis include a) polarisation of cells and b) cavitation of central cells and cell survival of cells in contact with the basement membrane. We propose that polarisation of epithelia is the driving force of lumen formation in prostatic acini. Establishment of polarity is followed by asymmetric fluid movement and its accumulation in apical spaces. This results in membrane separation and the formation of a lumen. This mechanism was previously identified in zebra fish, MDCK cysts4 and embryos5, now we reveal its importance in human adult morphogenesis.
In prostate models, the cues to orientate the axis of polarity are likely to include E-cadherin and β4 integrin and its interaction with the basement membrane. Early expression of E-cadherin at cellular junctions during the development of acini and its loss from the luminal surfaces during early lumen formation indicates an important role for E-cadherin in the spatial cues for establishing membrane domains. Consistent with this idea, E-cadherin mediated cell adhesion can provides signals to target proteins to basolateral and luminal surfaces and initiate membrane domain organization during polarization 20, 21. In agreement with our work, early ligation of β4 integrin is an important signal for the formation of mammary acini and contributes to the establishment of polarity and lumen 2, 22, 23. In addition, β4 integrin ligation via NFκB activation plays an important role in conferring resistance to apoptosis of both malignant and non-malignant breast cells in response to basement membrane 24.
Our results also demonstrated that disruption of polarity led to the loss of PSA expression, demonstrating that epithelial polarisation is required for subsequent differentiation and secretory function. How cellular polarization can specify lumen formation remains unknown. Cellular polarity is under the control of evolutionary conserved protein complexes linked by direct protein interactions. Of importance are the PAR/aPKC complex and the Dlg/Lgl/SCRIB complex. These complexes are the central components of several significant pathways controlling polarity, asymmetric division and proliferation and include those involving E-cadherin, Erb2 and ß4 integrin (reviewed in Wodarz25 and Wodarz and Näthke 26). Further studies should address how E-cadherin and ß4 integrin interact with these conserved complexes. The model presented here may prove useful for the further study of this process in adult tissues.
Caspase dependent cell death was not responsible for prostate lumen development and a cavitation event did not occur. Cells found within prostatic lumen which were positive for active caspase 3 were most likely cells undergoing apoptosis after terminal differentiation, or anoikis, once they had shed into the lumen, as discussed in Debnath et al., 8. 3D breast epithelial cell cultures undergo a massive apoptosis of the central cells or cavitation event to form luminal spaces within acini. Although apoptosis has been proposed as the mechanism for lumen formation in several models systems, these studies have also found that it cannot be the sole driving force, since inhibition of apoptosis only delays lumen formation 8, 9, 27, 28, 29. This may suggest a role for epithelial polarization in the lumen formation of breast acini but other groups have also proposed that caspase independent cell death mechanisms, such as autophagy, can compensate for lumen clearance 8, 9, 28. We found that autophagy was active in human tissues and all the 3D models tested. However the expression of LC-3 by the majority of cells in an acinus, which are healthy and dividing, indicated its role is not one of cell death but most likely as a clearance mechanism. Autophagic cells may act to recycle cellular debris from the lumen, though this clearly needs further investigation.
The different mechanisms for lumen formation produced from the research of prostate and breast models may reflect differences in the behaviour of epithelial cells from different tissues and indicate they are controlled by different intrinsic and extrinsic signals for differentiation. Considered from a developmental point of view the finding may reflect the embryological origins of the different tissues. Mammary epithelia are ectodermal, whilst prostate is endodermal in common with the gut of zebrafish models. Kidney (MDCK) cells are derived from the mesoderm but share a common ureteric origin with the prostate. Therefore prostate, gut and kidney may all share common pathways of morphological differentiation, not shared by ectodermal tissues. The different mechanisms of lumen formation could be due to the use of different cell culture conditions. Different prostate cell lines develop into very different structures in Matrigel and this is not dictated by a cell being tumour or non-tumour, but by the ability of a cell to respond to the differentiation signals provided by Matrigel and its own intrinsic differentiation programme 12, 17,18. Culture conditions also have an important impact on 3D architecture when cells are grown in Matrigel. The addition of serum and EGF are important for lumen formation, whilst high calcium concentrations decrease lumen formation and apoptosis 17, 18. Recent work, has shown that the growth of acini from single cells or aggregates can dictate the development of lumen 15. Acini grown from single cells develop lumen using membrane separation mechanisms whilst acini grown from aggregates develop lumen by cavitation. It was concluded that apoptosis can act as a control mechanism ensuring lumen clearance when polarization is delayed. The inherent complexities of 3D modeling with Matrigel as discussed, indicate that experiments should be carried out on several cell lines to try and eliminate false positives and provide robust results. The strength of the work presented here is the use of several cell lines and primary cultures plated as single cells to model acinus-like structures with lumen.
Our results clearly indicate that inhibition of the Na+/K+ ATPase could not inhibit lumen formation in all acini. This result may reflect the heterogeneity of the acini within a culture and implies that not all use fluid movement to driven by Na+/K+ ATPase to drive lumen formation. It is likely that fluid movement is driven by alternative mechanisms or by differences in the expression of polarization molecules such as Na+/K+ ATPase. In addition the expression of tight junctions may affect the sensitivity of the cells to ouabain 4. Alternative mechanisms for lumen formation have been reported elsewhere. Kirschner et al., 27 and Yokoyama et al., 29 reported that whilst apoptosis inhibitors had little effect on lumen formation CEACAM1-4s could restore normal morphology to mammary carcinoma cells in 3D. Mirror symmetric cell division and inheritance of polarized proteins is a powerful morphogenetic force in embryogenic lumen formation 30. During acinus development, one could imagine the mirror symmetric inheritance of polarity complex proteins, integrins or tight junction proteins might be important in adult epithelia 26. Recent research in Drosophila has indicated that an apical matrix is deposited during early lumen formation and acts as a supportive scaffold, it remains to be determined whether a similar matrix exists in human adult epithelia 31, 32.
Understanding tissue morphogenesis is important to enhance our understanding of differentiation but also to understand the breakdown of tissue architecture during disease formation. The mechanisms of morphogenesis are also important to the field of tissue engineering and to ensure representative 3D models of tissue can be designed in vitro. This is the first time that fluid movement has been shown to be an important morphological event in adult epithelia. Our results indicate that in adult prostate epithelial morphogenesis where secretory function is paramount then the mechanism of lumen formation is driven by membrane separation due to polarized fluid movement and apoptosis is secondary.
MATERIALS AND METHODS
Materials
General chemicals were purchased from Sigma (Poole, UK), tissue culture medium from Invitrogen (Paisley, UK) and tissue culture plastic from Corning Costar Ltd (High Wycombe, UK), unless otherwise stated.
Culture of cell lines
PC-3 cells (prostate carcinoma) were obtained from the European Collection of Animal Cell Cultures (Porton Down, UK) and were routinely cultured in Hams F12 culture media supplemented with 7 % foetal calf serum (PAA Laboratories, GmbH, Linz, Austria) and 2 mM glutamine. Hela (cervical carcinoma) and RWPE-1 (normal prostate epithelia) were obtained from the American Type Culture Collection and were routinely cultured in DMEM supplemented with 10% FCS or KSFM supplemented with 5 ng/ml epidermal growth factor, 25 μg/ml bovine pituitary extract and 2mM glutamine, respectively. BPH-1 (normal prostate epithelia) were kindly provided by Prof Simon Hayward (Vanderbilt University Medical Center, USA) and were routinely grown in RPMI 1640 supplemented with 5 % FCS and 2mM glutamine. Shmac 5 (prostate carcinoma) cells were derived in our laboratory14 and were routinely cultured in keratinocyte serum free media supplemented with 2 % foetal calf serum, 5 ng/ml epidermal growth factor and 25 μg/ml bovine pituitary extract.
Primary prostatic epithelial cells were prepared as described before 16. All cells were routinely cultured without antibiotics in a humidified atmosphere at 37°C and 5% CO2.
Three dimensional culture of cells in Matrigel
A 40 μl plug of Matrigel (growth factor reduced and phenol red free, Becton Dickinson, Plymouth, UK) was plated to the well of an 8 well LabTek Chambered coverglass (Nunc, Rochester, USA) and set at 37 °C for 30 minutes. On ice, epithelial cells were prepared at a concentration of 5 000 cells/ml in KSFM supplemented with 5 ng/ml EGF, 2% (v/v) FCS, 4% (v/v) Matrigel. This media has been found to be optimal for prostate acinus formation 18. 0.2 ml of this cell solution was plated onto the Matrigel plug and incubated for 30 minutes at 37 °C, afterwhich 0.2 ml of growth media was added (KSFM supplemented with 5 ng/ml EGF, 2% (v/v) FCS). Cultures were fed every 2-3 days by removal of 200 μl of spent media and the addition of 200 μl of fresh media.
Immunofluorescent analysis and imaging
Immunostaining was based the method by Debnath et al., 33 and carried out at room temperature throughout. Cells grown in Matrigel were fixed directly using 4% (w/v) paraformaldehyde for 20 minutes, followed by permeabilisation with 0.5% TX-100 (v/v). Cultures were incubated with primary antibodies, as indicated in the supplementary table S2, for 1 hour. Cultures were then incubated with Alexa 568 or 488 conjugated secondary antibodies (Molecular Probes, Invitrogen, Paisley, UK) diluted 1/500 for 1 hour. Nuclei were counterstained with 0.1 ug/ml DAPI for 5 minutes. Cells were imaged using a Zeiss LSM 510 meta laser scanning confocal microscope on an Axiovert 200M fluorescent microscope. All images were recorded at x20 magnification. Confocal images were taken at mid-section through the acini to ensure the correct analysis of the lumen. Phase images were observed with a Nikon TE300 inverted microscope, captured with a Hamamatsu video camera and analysed using Velocity 4, (Improvision, Coventry, UK). Digitised images were subsequently prepared using Adobe Photoshop 6. Specificity of the LC-3 antibody has been demonstrated by Castino et al 2008 34.
Assessment of apoptosis and autophagy
Different cell lines produce spheroids of different cell sizes in Matrigel and are often heterogeneous within a given culture. To compare the level of cell death between spheroids grown from different cell lines we counted the total number of caspase 3 positive cells in a spheroid and then determined what percentage this represented of the total number of cells in a spheroid. This was performed by scanning a complete spheroid for positively stained cells using confocal microscopy. The total number of cells in a spheroid was calculated from the diameter of individual spheroids and cells (both of which can be measured during microscopy) using one of the following calculations:
Total number of cells in a solid spheroid = volume of spheroid/ volume of single cell = (4/3Πr13) / (4/3Πr23).
Total number of cells in a hollow spheroid (assuming a monolayer of cells) = surface area of spheroid/ cross-sectional area of a single cell = (4Πr12) / (Πr22)
6-10 spheroids were analysed for each experiment and a median value was calculated. Fisher’s exact test was used to compare to variables within individual experiments, whilst the students t-test was used to compare the results between experiments..
Supplementary Material
BPH-1 cells were grown in Matrigel for 2 days and then grown in the presence of 100 μM Z-VAD-FMK. Acini were grown for a further 4 days and then the nuclei were counterstained with DAPI. A z stack series was collected from the bottom to mid-section at 4.75μm intervals to demonstrate the presence of hollow lumen. The bar indicates 50 μm. These images were replicated in multiple independent experiments.
BPH-1 cells were grown in Matrigel for 7 days. Acini were then fixed and stained for beta 1 integrin (red), or human laminin (red), nuclei were counterstained with DAPI. Representative images are shown that cross section through the middle of acini. The bar indicates 50 μm. These images were replicated in multiple independent experiments.
Acknowledgements
We thank Prof. Norman Maitland for his generous support of the project and provision of laboratory space. Many thanks to M. Stower for providing prostate tissue samples. We also thank the members of the Yorkshire Cancer Research laboratory for their useful discussions and technical help. We are grateful to Dr Anne Collins for her comments on the manuscript. This work was supported by the Wellcome Trust [GR076612MA]; BBSRC [BB/E021409/1] and Yorkshire Cancer Research.
Abbreviations
- 3D
three dimensional
- PSA
prostate specific antigen
Footnotes
Supplementary Information accompanies the paper on Cell Death and Differentiation website
References
- 1.Zegers MMP, O'Brien LE, Yu W, Datta A, Mostov KE. Epithelial polarity and tubulogenesis in vitro. Trends in Cell Biol. 2003;13:169–176. doi: 10.1016/s0962-8924(03)00036-9. [DOI] [PubMed] [Google Scholar]
- 2.O'Brien LE, Zegers MMP, Mostov KE. Building epithelial architecture: insights from three-dimensional culture models. Nat. Rev. Mol. Cell Biol. 2002;3:531–537. doi: 10.1038/nrm859. [DOI] [PubMed] [Google Scholar]
- 3.Kroschewski R. Molecular Mechanisms of Epithelial Polarity: About Shapes, Forces, and Orientation Problems. News in Physiological Sci. 2004;19:61–66. doi: 10.1152/nips.01501.2003. [DOI] [PubMed] [Google Scholar]
- 4.Bagnat M, Cheung ID, Mostov KE, Stainier DYR. Genetic control of single lumen formation in the zebrafish gut. Nat. Cell Biol. 2007;9:954–960. doi: 10.1038/ncb1621. [DOI] [PubMed] [Google Scholar]
- 5.Houghton FD, Humpherson PG, Hawkhead JA, Hall CJ, Leese HJ. Na+, K+, ATPase activity in the human and bovine preimplantation embryo. Dev. Biology. 2003;263:360–366. doi: 10.1016/j.ydbio.2003.07.014. [DOI] [PubMed] [Google Scholar]
- 6.Schmiechel KL, Bissell MJ. Modeling tissue-specific signaling and organ function in three dimensions. J. Cell Sci. 2003;116:2377–2388. doi: 10.1242/jcs.00503. [DOI] [PMC free article] [PubMed] [Google Scholar]
- 7.Mills Shaw KR, Wrobel CN, Brugge JS. Use of Three-Dimensional Basement Membrane Cultures to Model Oncogene-Induced Changes in Mammary Epithelial Morphogenesis. J. Mammary Gland Biology and Neoplasia. 2004;9:297–310. doi: 10.1007/s10911-004-1402-z. [DOI] [PMC free article] [PubMed] [Google Scholar]
- 8.Debnath J, Mills K, Collins N, Reginato M, Muthuswamy S, Brugge J. The Role Of Apoptosis In Creating and Maintaining Luminal Space Within Normal and Oncogene-Expressing Mammary Acini. Cell. 2002;111:29–40. doi: 10.1016/s0092-8674(02)01001-2. [DOI] [PubMed] [Google Scholar]
- 9.Mailleux AA, Overholtzer M, Schmelzle T, Bouillet P, Strasser A, Brugge J. BIM regulates apoptosis during mammary ductal morphogenesis, and its absence reveals alternative cell death mechanisms. Dev. Cell. 2007;12:221–234. doi: 10.1016/j.devcel.2006.12.003. [DOI] [PMC free article] [PubMed] [Google Scholar]
- 10.Coucouvanis E, Martin GR. Signals for death and survival: a two-step mechanism for cavitation in the vertebrate embryo. Cell. 1995;83:279–87. doi: 10.1016/0092-8674(95)90169-8. [DOI] [PubMed] [Google Scholar]
- 11.Tsujimoto Y, Shimizu S. Another way to die: autophagic programmed cell death. Cell Death and Diff. 2005;12:1528–1534. doi: 10.1038/sj.cdd.4401777. [DOI] [PubMed] [Google Scholar]
- 12.Qu X, Zou Z, Sun Q, Luby-Phelps K, et al. Autophagy gene-dependent clearance of apoptotic cells during embryonic development. Cell. 2007;128:931–46. doi: 10.1016/j.cell.2006.12.044. [DOI] [PubMed] [Google Scholar]
- 13.Lang SH, Sharrard RM, Stark M, Villette JM, Maitland NJ. Prostate epithelial cell lines form spheroids with evidence of glandular differentiation in three-dimensional Matrigel cultures. British Journal of Cancer. 2001;85:590–599. doi: 10.1054/bjoc.2001.1967. [DOI] [PMC free article] [PubMed] [Google Scholar]
- 14.Lang SH, Smith J, Hyde C, Macintosh C, Stower M, Maitland NJ. Differentiation of prostate epithelial cell cultures by Matrigel/ stromal reconstruction. In Vitro Cell. Dev. Biol. Animal. 2006;42:273–280. doi: 10.1290/0511080.1. [DOI] [PubMed] [Google Scholar]
- 15.Martín-Belmonte F, Yu W, Rodríguez-Fraticelli AE, Ewald A, Werb Z, Alonso MA, Mostov K. Cell-Polarity Dynamics Controls the Mechanism of Lumen Formation in Epithelial Morphogenesis. Curr. Biol. 2008;18:507–513. doi: 10.1016/j.cub.2008.02.076. [DOI] [PMC free article] [PubMed] [Google Scholar]
- 16.Muthuswamy SK, Li D, Lelivere S, Bissell M, Brugge JS. ErbB2, but not ErbB1, reinitiates proliferation and induces luminal repopulation in epithelial acini. Nat. Cell Biol. 2001;3:785–792. doi: 10.1038/ncb0901-785. [DOI] [PMC free article] [PubMed] [Google Scholar]
- 17.Lang SH, Stark M, Collins A, Paul AB, Stower MJ, Maitland NJ. Experimental Prostate Epithelial Morphogenesis in Response to Stroma and Three-Dimensional Matrigel Culture. Cell Growth & Diff. 2001;12:631–640. [PubMed] [Google Scholar]
- 18.Tyson DR, Inokuchi J, Tsunoda T, Lau A, Ornstein DK. Culture requirements of prostatic epithelial cell lines for acinar morphogenesis and lumen formation in vitro: role of extracellular calcium. Prostate. 2007;67:1601–13. doi: 10.1002/pros.20628. [DOI] [PubMed] [Google Scholar]
- 19.Schenk DB, Leffert HL. Monoclonal antibodies to rat Na+, K+- ATPase block enzymatic activity. PNAS. 1983;80:5281–5285. doi: 10.1073/pnas.80.17.5281. [DOI] [PMC free article] [PubMed] [Google Scholar]
- 20.Nejsum LN, Nelson WJ. A molecular mechanism directly linking E-cadherin adhesion to initiation of epithelial cell surface polarity. J. Cell Biol. 2007;178:323–335. doi: 10.1083/jcb.200705094. [DOI] [PMC free article] [PubMed] [Google Scholar]
- 21.Cohen D, Tian Y, Müsch A. Par1b Promotes Hepatic-type Lumen Polarity in MDCK Cells via Myosin II and E-Cadherin-dependent Signaling. Mol. Biol. Cell. 2007;18:2203–2215. doi: 10.1091/mbc.E07-02-0095. [DOI] [PMC free article] [PubMed] [Google Scholar]
- 22.Bello-DeOcampo D, Kleinman HK, Deocampo ND, Webber MM. Laminin-1 and α6ß1 integrin regulate acinar morphogenesis of normal and malignant human prostate epithelial cells. The Prostate. 2001;46:142–153. doi: 10.1002/1097-0045(20010201)46:2<142::aid-pros1018>3.0.co;2-b. [DOI] [PubMed] [Google Scholar]
- 23.Gudjonsson T, Rønnov-Jessen L, Villadsen R, Rank F, Bissell MJ, Petersen OW. Normal and tumor-derived myoepithelial cells differ in their ability to interact with luminal breast epithelial cells for polarity and basement membrane deposition. Journal of Cell Science. 2002;115:39–50. doi: 10.1242/jcs.115.1.39. [DOI] [PMC free article] [PubMed] [Google Scholar]
- 24.Weaver V, Lelièvre S, Lakins J, Chrenek M, Jones J, Giancotti F, Werb Z, Bissell M. β4 integrin-dependent formation of polarized three-dimensional architecture confers resistance to apoptosis in normal and malignant mammary epithelium. Cancer Cell. 2002;2:205–216. doi: 10.1016/s1535-6108(02)00125-3. [DOI] [PMC free article] [PubMed] [Google Scholar]
- 25.Wodarz A. Molecular control of cell polarity and asymmetric cell division in Drosophila neuroblasts. Curr. Op.Cell Biol. 2005;17:475–481. doi: 10.1016/j.ceb.2005.08.005. [DOI] [PubMed] [Google Scholar]
- 26.Wodarz A, Näthke I. Cell polarity in development and cancer. Nature Cell Biol. 2007;9:1016–1024. doi: 10.1038/ncb433. [DOI] [PubMed] [Google Scholar]
- 27.Kirshner J, Chen CJ, Liu P, Huang J, Shively JE. CEACAM1-4S, a cell-cell adhesion molecule, mediates apoptosis and reverts mammary carcinoma cells to a normal morphogenic phenotype in a 3D culture. PNAS. 2003;100:521–526. doi: 10.1073/pnas.232711199. [DOI] [PMC free article] [PubMed] [Google Scholar]
- 28.Abud HE. Shaping developing tissues by apoptosis. Cell Death and Diff. 2004;11:797–799. doi: 10.1038/sj.cdd.4401455. [DOI] [PubMed] [Google Scholar]
- 29.Yokoyama S, Chen C-J, Nguyen T, Shively JE. Role of CEACAM1 isoforms in an in vivo model of mammary morphogenesis: mutational analysis of the cytoplasmic domain of CEACAM1-4S reveals key residues involved in lumen formation. Oncogene. 2007;26:7637–7646. doi: 10.1038/sj.onc.1210577. [DOI] [PubMed] [Google Scholar]
- 30.Tawk M, Araya C, Lyons DA, Reugels AM, Girdler GC, Bayley PR, Hyde DR, Tada M, Clarke JDW. A mirror-symmetric cell division that orchestrates neuroepithelial morphogenesis. Nature. 2007;446:797–800. doi: 10.1038/nature05722. [DOI] [PubMed] [Google Scholar]
- 31.Devine WP, Lubarsky B, Shaw K, Luschnig S, Messina L, Krasnow MA. Requirement for chitin biosynthesis in epithelial tube morphogenesis. PNAS. 2005;102:17014–17019. doi: 10.1073/pnas.0506676102. [DOI] [PMC free article] [PubMed] [Google Scholar]
- 32.Husain N, Pellikka M, Hong H, Klimentova T, Choe K, Clandinin TR, Tepass U. The Agrin/Perlecan-Related Protein Eyes Shut Is Essential for Epithelial Lumen Formation in the Drosophila Retina. Dev. Cell. 2006;11:483–493. doi: 10.1016/j.devcel.2006.08.012. [DOI] [PubMed] [Google Scholar]
- 33.Debnath J, Muthuswamy SK, Brugge JS. Morphogenesis and oncogenesis of MCF-10A mammary epithelial acini grown in three-dimensional basement membrane cultures. Methods. 2003;30:256–268. doi: 10.1016/s1046-2023(03)00032-x. [DOI] [PubMed] [Google Scholar]
- 34.Castino R, Lazzeri G, Lenzi P, Bellio N, Follo C, Ferrucci M, Fornai F, Isidoro C. Suppression of autophagy precipitates neuronal cell death following low doses of methamphetamine. J Neurochemistry. 2008 doi: 10.1111/j.1471-4159.2008.05488.x. DOI 10.1111/j.1471-4159.2008.05488. [DOI] [PubMed] [Google Scholar]
Associated Data
This section collects any data citations, data availability statements, or supplementary materials included in this article.
Supplementary Materials
BPH-1 cells were grown in Matrigel for 2 days and then grown in the presence of 100 μM Z-VAD-FMK. Acini were grown for a further 4 days and then the nuclei were counterstained with DAPI. A z stack series was collected from the bottom to mid-section at 4.75μm intervals to demonstrate the presence of hollow lumen. The bar indicates 50 μm. These images were replicated in multiple independent experiments.
BPH-1 cells were grown in Matrigel for 7 days. Acini were then fixed and stained for beta 1 integrin (red), or human laminin (red), nuclei were counterstained with DAPI. Representative images are shown that cross section through the middle of acini. The bar indicates 50 μm. These images were replicated in multiple independent experiments.