Abstract
A continuous-flow microspotter was used to generate planar arrays of stabilized bilayers composed of the polymerizable lipid bis-SorbPC and dopant lipids bearing ligands for proteins. Fluorescence microscopy was used to determine the uniformity of the bilayers and to detect protein binding. After UV-initiated polymerization, poly(lipid) bilayer microarrays were air-stable. Cholera toxin subunit b (CTb) bound to an array of poly(lipid) bilayers doped with GM1, and the extent of binding was correlated to the mole percentage of GM1 in each spot. A poly(lipid) bilayer array composed of spots doped with GM1 and spots doped with biotin-DOPE specifically bound CTb and streptavidin to the respective spots from a dissolved mixture of the two proteins. Poly(bis-SorbPC)/GM1 arrays retained specific CTb binding capacity after multiple regenerations with a protein denaturing solution and also after exposure to air. In addition, these arrays are stable in vacuum, which allows the use of MALDI-TOF mass spectrometry to detect specifically bound CTb. This work demonstrates the considerable potential of poly(lipid) bilayer arrays for high-throughput binding assays and lipidomics studies.
Keywords: supported lipid bilayer, microarray, continuous-flow microspotter, GM1, MALDI-TOF MS, cholera toxin, poly(lipid)
INTRODUCTION
Microarrays have shown increasing potential as a component of high-throughput analytical devices for the rapid detection of biomolecules for a variety of applications such as drug screening. Microarrays of proteins, DNA, carbohydrates, and lipid bilayers have been prepared (1). Protein microarrays have applications in proteomics and protein functional studies (2), DNA chips are used in gene expression studies and rapid DNA sequencing (3), and carbohydrate microarrays can be used in glycomics studies and pathogen identification (4). Lipid bilayer arrays have potential for high-throughput characterization of ligand—lipid binding as well as matrices for the reconstitution of active transmembrane proteins that are pharmacological targets.
Several methods have been used to generate lipid bilayer arrays (5), including microcontact blotting and printing (6, 7), substrate micropatterning (8–10), UV photolithography (11–15), robotic microspotting (16), and microfluidics (17–23). Among these techniques, microfluidics is perhaps the most promising because it allows for the creation of arrays of more than two lipid compositions. However, most microfluidic chips are two-dimensional, which makes it difficult to form a row of bilayer spots that differ in lipid composition.
A newer method to make lipid bilayer arrays uses a continuous-flow microspotter (CFM). The CFM is comprised of a poly(dimethylsiloxane) (PDMS) slab containing an array of vertical channels, each contacting the substrate at a micrometer-sized spot and having an individually addressable inlet and outlet, thereby permitting a different bilayer composition to be formed at each spot. After formation, each spot can be exposed to a different solution of ligands, or all of the spots can be exposed to the same solution simultaneously by removing the CFM from the substrate. The CFM has been used to make fluid lipid bilayer arrays bearing a variety of ligands, such as ovine brain ganglioside (GM1) and dinitrophenyl-capped phosphatidylethanolamine, that specifically bind their respective protein targets, cholera toxin subunit b (CTb) and anti-DNP antibody, respectively (24). However, as for any planar supported lipid bilayer (PSLB) composed of fluid lipids deposited on a glass substrate, the stability of these arrays is limited (25–27).
Lipid bilayers are self-associated and adsorbed to planar substrates by weak noncovalent interactions that render them unstable to drying, surfactants, organic solvents, heat, and mechanical stress, all of which limit their commercial applications (25–29). A variety of stabilization techniques exist, including covalently attaching one leaflet to the substrate (30, 31), tethering a floating bilayer to the substrate (32–36), attaching proteins (37) and polymers (38) to the upper surface of the lipid bilayer, and polymerizing reactive lipids (29). A variety of polymerizable lipids have been used, including methacryloyl, diacetylenic, and dienoyl lipids (39–44). Extremely stable PSLBs have been formed using 1,2-bis[10-(2′,4′-hexadienoloxy)decanoyl]-sn-glycero-3-phosphocholine (bis-SorbPC) (27), and functionalization of these bilayers with water-soluble and transmembrane proteins has been described (45, 46).
In this paper, a CFM is used to produce microarrays of poly(bis-SorbPC) bilayers that are stable to air and vacuum exposure. Poly(bis-SorbPC) arrays were doped with GM1 and 1,2-dioleoyl-sn-glycero-3-phosphoethanolamine-N-biotinyl (biotin-DOPE). These arrays bound their respective, fluoro-labeled protein targets from a dissolved mixture with little cross-talk. Gradient arrays of GM1 were created, and the extent of CTb binding was correlated with the mole percentage of GM1 in the poly(lipid) spots. Exposure of GM1 gradient arrays to denaturants removed CTb and regenerated the array, which maintained its CTb binding capacity even after multiple regeneration cycles as well as air drying. Specifically bound CTb could also be detected using MALDI-TOF mass spectrometry.
EXPERIMENTAL SECTION
Materials
1,2-Dioleoyl-sn-glycero-3-phosphocholine (DOPC), 1,2-dipalmitoyl-sn-glycero-3-phosphoethanolamine-N-(lissamine rhodamine B sulfonyl) (Rh-DPPE), biotin-DOPE, and GM1 were purchased from Avanti Polar Lipids. Bis-SorbPC was synthesized as previously described (47). Phosphate-buffered saline (PBS), pH 7.4, was made containing the following components: 140 mM sodium chloride, 3 mM potassium chloride, 10 mM dibasic sodium phosphate, 2 mM monobasic potassium phosphate, and 1 mM sodium azide. Bovine serum albumin (BSA) was obtained from Sigma-Aldrich. Tetramethylrhodamine-labeled streptavidin (TRITC-SA) with a 3:1 dye/protein ratio was obtained from Pierce Biotechnology. CTb labeled with Alexa Fluor 488 (Alexa488CTb) at a 5:1 dye/protein ratio was obtained from Invitrogen. Quartz microscope slides from Chemglass and silicon wafers from Wacker Chemie AG were used. Water from a Nanopure Infinity Ultrapure purification system or a Barnstead Nanopure system with a minimum resistivity of 18MΩ · cm was used. A regeneration solution of 6 M urea, 0.1 M glycine, and 0.2 M NaCl adjusted to pH 3 with hydrochloric acid was made using chemicals from Sigma-Aldrich.
Preparation of Small Unilamellar Vesicles (SUVs)
Dopant lipids (Rh-DPPE, biotin-DOPE, or GM1) were mixed with bis-SorbPC or DOPC at appropriate molar ratios (expressed below as the mole percentage) in benzene or chloroform. The organic solvent was removed from lipid stock solutions under a stream of argon or nitrogen, followed by vacuum drying for at least 2 h. The lipid was then rehydrated with PBS to a concentration of 0.5 mg/mL, vortexed to suspend the lipid, and then sonicated in either a bath sonicator or a Branson sonicator with a cup horn, at a temperature above the lipid main-phase transition temperature, until no longer cloudy.
PSLB Microarray Formation
Quartz slides were cleaned in a piranha solution (3:7 30% H2O2/18 M H2SO4) and rinsed thoroughly in water. Each slide was then oven-dried at 120 °C, plasma-cleaned (Harrick PDC-32G) with argon for 3 min, and assembled into the CFM. The details of the CFM construction are given elsewhere (48). In brief, the CFM is a 5 × 12 mm PDMS print head capable of producing up to 48 spots, each 400 µm × 400 µm, with an 875 µm pitch. The PDMS print head was degassed under vacuum before each use in order to minimize bubble formation within its microchannels. SUVs were flowed through the channels of the CFM and allowed to fuse to the quartz for 15 min, forming PSLB microarrays, and then the channels were rinsed with PBS. A low-pressure mercury pen lamp with a rated intensity of 4500 µW/cm2 at 254 nm was directed through a bandpass filter (330 nm, 140 nm fwhm; U-330, Edmund Optics) and through the quartz slide for 15 min to polymerize bis-SorbPC. The slide was removed from the CFM underwater and assembled into an epifluorescence flow cell. A solution of 2 mg/mL of BSA in PBS was then injected over the array and allowed to adsorb for 20 min to the PDMS residue between PSLB spots. Binding assays were performed by incubating PSLB arrays with solutions of Alexa488CTb (14 µg/mL) in PBS, TRITC-SA (0.1 mg/mL) in PBS, or a mixture thereof. In all cases, protein solutions were incubated with arrays for 45 min before washing with PBS.
Experiments were also performed on extended PSLBs. Silicon wafers were cleaned in a piranha solution and rinsed thoroughly in water. The wafers were dried with a stream of nitrogen, covered in a SUV solution for 15 min to form PSLBs, and placed in a container of excess water for rinsing. UV irradiation was used as described above to polymerize bis-SorbPC. The wafers were then removed from water, rinsed with water, and dried with a nitrogen stream. Binding assays were performed as described above.
Fluorescence Microscopy
Arrays were imaged using an Olympus BX40 microscope equipped with a Photometrics CoolSNAP color camera (Roper Scientific) and 4× and 10× objectives. Two optical filter sets with excitation/emission wavelengths of 510/526 and 557/571 nm were used for fluorescence imaging of Alexa488 and rhodamine, respectively. Images were acquired at 4× and, in some cases, spliced together into larger images using either GIMP or Canvas X software. Intensities of images captured at 10× were analyzed using Image J software, available online from NIH. Intensity data were corrected for background using images taken before exposure of PSLBs to fluorescent proteins.
Mass Spectrometry
An Alexa488CTb solution was adsorbed to PSLBs on silicon wafers for 45 min, rinsed with water, and dried under a nitrogen stream. The wafer samples were mounted with double-sided tape onto a conductive MALDI plate [a microtitre plate adapter for Prespotted AnchorChip targets (Bruker)] for effective ion transmission. Samples were then spotted with 1 µL of a matrix consisting of saturated sinapinic acid in 70:30:1 water/acetonitrile/trifluoroacetic acid and then air dried. MALDI-TOF mass spectrometry was performed with a Reflex-III mass spectrometer (Bruker Daltonik, Bremen, Germany) run in linear mode using 200 shots of the 337 nm line of a nitrogen laser per spectrum. The mass/charge (m/z) ratios were calibrated using BSA. Peak m/z values were determined using the Fit Gaussian routine in Microcal Origin software.
RESULTS AND DISCUSSION
PSLB Microarray Formation and Stability
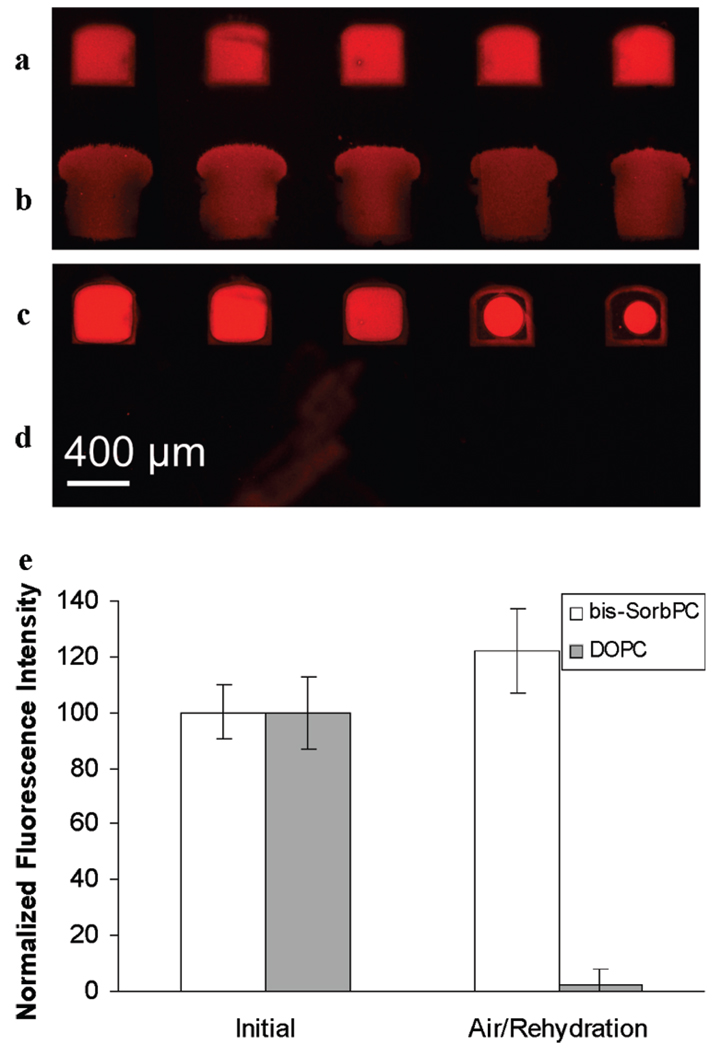
The CFM was used to generate a microarray of poly(bis-SorbPC) PSLB spots doped with 1.9% Rh-DPPE on a quartz slide. For comparison purposes, an array of DOPC PSLB spots doped with 1.0% Rh-DPPE was also formed. An epifluorescence image of the arrays after UV irradiation is shown in Figure 1, rows a and b. Both exhibit uniform fluorescence, indicating the presence of a continuous PSLB in each spot. Variations in the geometry of the channel openings where the CFM head contacts the quartz slide account for differences in the spot shape, and differences in the Rh-DPPE mole percentage account for variations in brightness.
FIGURE 1.
Epifluorescence images of a PSLB microarray consisting of UV-irradiated Rh-DPPE/bis-SorbPC (a and c) and Rh-DPPE/DOPC (b and d) before (a and b) and after (c and d) exposure to air. The Rh-DPPE loadings in bis-SorbPC and DOPC bilayers are 1.9% and 1.0% (mol/mol), respectively. (e) Plot of normalized average intensities of the two types of PSLB spots before and after air exposure. The error bars represent the standard deviations of five trials.
The stability of the PSLB spots was examined by injecting air into the epifluorescence cell at a rate of approximately 1 mL/min for 1 min, followed by a static incubation period of ca. 5 min, after which the cell was refilled with PBS at a rate of 1 mL/min for 1 min. An image of the resulting array is shown in Figure 1, rows c and d. Row c, consisting of Rh-DPPE/poly(bis-SorbPC) bilayers, remained mostly intact with large areas of uniform fluorescence, although some lipid was removed at the edges of the spots, adjacent to the regions where the PDMS print head contacted the slide. After exposure to air, the Rh-DPPE/DOPC bilayers were almost completely removed, with little discernible fluorescence (Figure 1, row d). A square region of interest (ROI) slightly smaller than the uniformly bright area of the rightmost spot of Figure 1, row c, was used to determine the average intensity within each spot before and after the air/PBS treatment. These data were averaged to generate the plot in Figure 1e, which shows that the Rh-DPPE/DOPC spots were nearly quantitatively desorbed while the Rh-DPPE/poly(bis-SorbPC) spots remained largely intact. Previous work has shown that unpolymerized bis-SorbPC PSLBs are also completely desorbed when removed from water (27). There was a measurable increase in Rh-DPPE/poly(bis-SorbPC) fluorescence after drying/rehydrating; however, the difference is not statistically significant (i.e., the error bars overlap). It may have been caused by redistribution of Rh-DPPE within the polymerized bilayer, resulting in a lower level of self-quenching after rehydration.
To investigate the origin of the lipid removal at the edges of the spots in Figure 1c, additional experiments were performed with millimeter-sized spots of bis-SorbPC PSLBs, with the edges either free-standing (i.e., limited by bilayer spreading (25)) or surrounded by PDMS. After polymerization, drying, and rehydration, the edges of free-standing spots remained intact whereas the edges of spots surrounded by PDMS were frequently desorbed (data not shown). The underlying cause of this observation is not clear, but one possibility is that low-molecular-weight components in PDMS contaminate the surface of the slide adjacent to the edges of the bulk PDMS and thereby disrupt adhesion of the PSLB to the slide.
CTb Binding to a GM1 Gradient Microarray
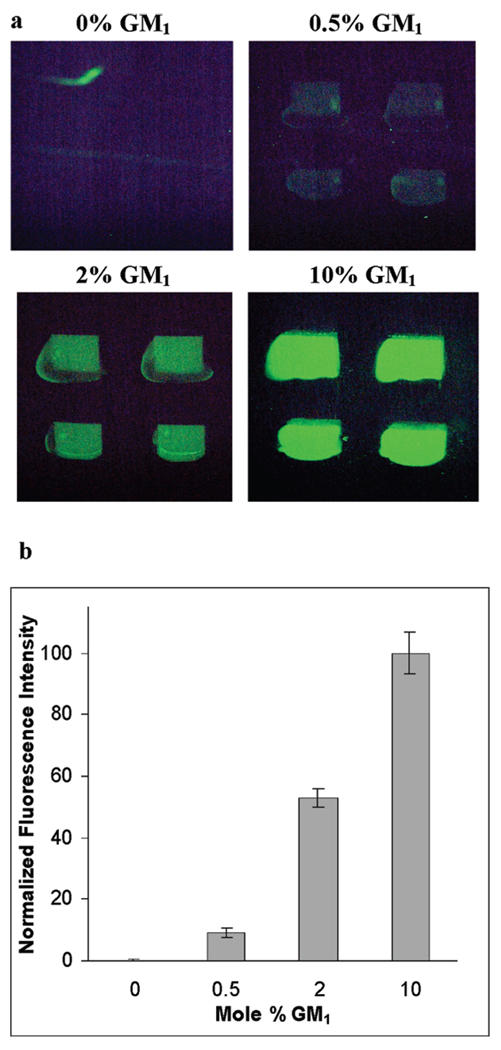
The CFM was used to construct a PSLB array composed of poly(bis-SorbPC) doped with GM1 at mole percentages ranging from 0% to 10%. A solution of Alexa488CTb was subsequently injected and allowed to adsorb to the array before a PBS rinse was performed to remove unbound protein. An epifluorescence image of the resulting array is shown in Figure 2a. The mean intensity within the same ROI in each spot was averaged to generate the plot in Figure 2b, which shows that the fluorescence intensity due to bound Alexa488CTb is correlated with the GM1 mole percentage in the respective PSLB spot. In a separate experiment, Alexa488CTb binding to a 10% GM1/bis-SorbPC PSLB that was not exposed to UV illumination was compared to a PSLB that was UV-polymerized. No change in the amount of Alexa488CTb binding was observed, showing that UV irradiation and bis-SorbPC polymerization did not measurably affect the capacity of GM1-doped PSLBs to bind Alexa488CTb (data not shown). However, when irradiation was performed without the U-330 bandpass filter, no Alexa488CTb binding was observed, showing that shorter-wavelength UV light degrades GM1.
FIGURE 2.
(a) Epifluorescence images of a lipid microarray of 0%, 0.5%, 2%, and 10% GM1 in poly(bis-SorbPC) after adsorption of Alexa488CTb. (b) Plot of the normalized average intensities of the gradient array shown in part a. The error bars represent the standard deviations of six trials.
Simultaneous Multianalyte Detection
Multianalyte detection using microarrays bearing different ligands at spatially distinct locations was also investigated. The CFM was used to prepare an array of PSLB spots composed of 0–10% GM1 in poly(bis-SorbPC) and 30% biotin-DOPE in poly(bis-SorbPC). A mixture of Alexa488CTb and TRITC-SA was then injected and allowed to adsorb to the array before PBS rinsing. A larger mole percentage of biotin-DOPE was used because a significant decrease in streptavidin binding after UV irradiation of 30% biotin-DOPE/poly(bis-SorbPC) PSLBs was observed (up to 90% loss; data not shown), presumably because of photodegradation of biotin.
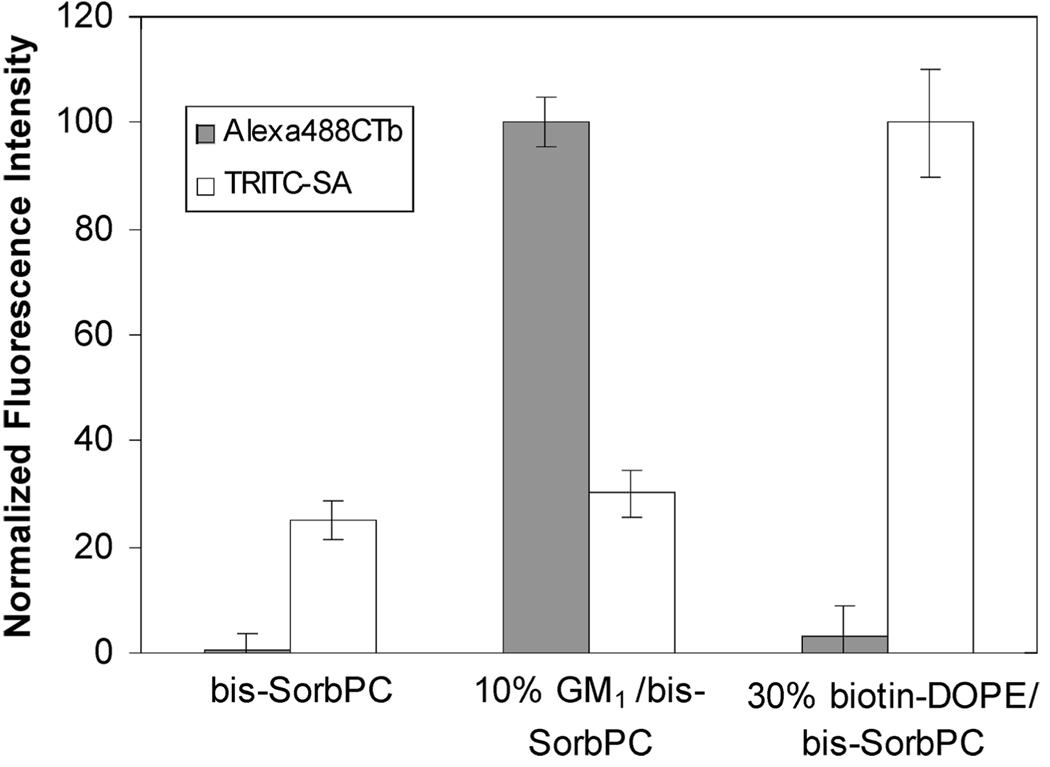
Figure 3 displays normalized fluorescence intensities of Alexa488CTb and TRITC-SA adsorbed to pure poly(bis-SorbPC), 10% GM1/poly(bis-SorbPC), and 30% biotin-DOPE/poly(bis-SorbPC). A relatively high level of Alexa488CTb binding occurs on the spots containing 10% GM1 but not on the spots containing 30% biotin-DOPE, demonstrating specificity and a lack of cross-talk. Minimal fluorescence of Alexa488CTb is observed on pure poly(bis-SorbPC) and 30% biotin-DOPE, indicating very low nonspecific adsorption. In contrast, TRITC-SA shows an apparently higher degree of nonspecific adsorption on pure poly(bis-SorbPC) and 10% GM1. This higher level can be understood as follows: As noted above, UV irradiation destroys most of the specific binding capacity of a 30% biotin-DOPE/poly(bis-SorbPC) bilayer. This reduces the ratio of specific binding to nonspecific adsorption to about 2. Because the data in Figure 3 are normalized to the total amount of TRITC-SA bound to 30% biotin-DOPE, the apparent level of nonspecific adsorption on bilayers lacking biotin-DOPE appears to be high because the specific binding on 30% biotin-DOPE is relatively low. Despite the problem with UV degradation of biotin-DOPE, overall these results demonstrate the ability to distinguish among multiple protein analytes bound to poly(bis-SorbPC) microarrays.
FIGURE 3.
Plot of normalized average fluorescence intensities of Alexa488CTb and TRITC-SA adsorbed from a mixture of the two proteins to a lipid microarray consisting of 30% biotin-DOPE in poly(bis-SorbPC), 10% GM1 in poly(bis-SorbPC), and pure poly(bis-SorbPC). The error bars represent the standard deviations of six trials.
Regeneration and Reuse
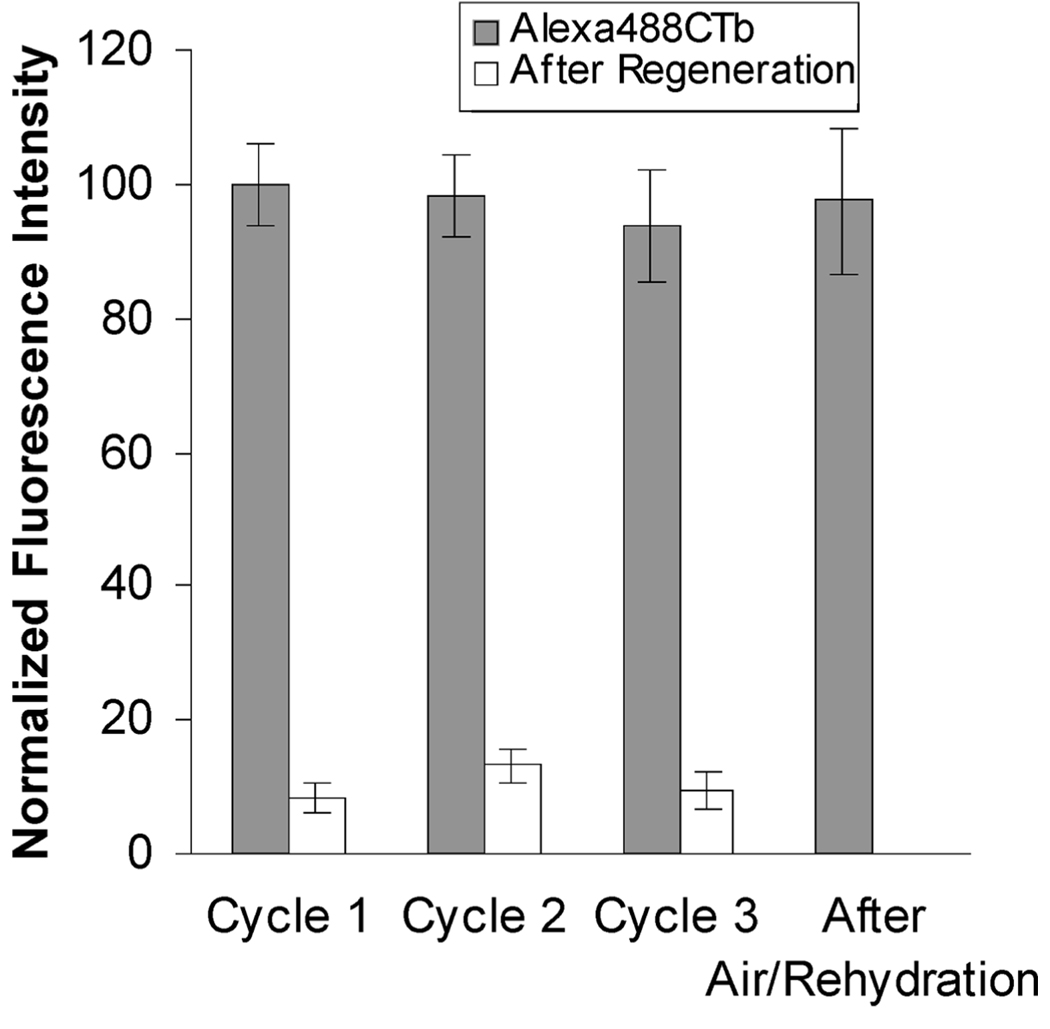
The ability to regenerate and reuse these arrays would enhance their utility for commercial applications and therefore was also examined. A 10% GM1/poly(bis-SorbPC) PSLB array was prepared, exposed to an Alexa488CTb/TRITC-SA solution mixture, rinsed with PBS, and then exposed to a denaturing solution (urea, glycine, and NaCl at pH 3) for 10 min to remove the bound Alexa488CTb, followed by another PBS rinse. This cycle was repeated three times. Mean fluorescence intensities for the PSLB spots in contact with PBS measured before and after each regeneration are plotted in Figure 4. The Alexa488CTb fluorescence decreased to ca. one-tenth the initial value after exposure to the denaturing solution, indicating that most of the bound CTb was removed. Reintroduction of the protein solution produced intensities equivalent to those measured in the first cycle, demonstrating that the GM1-CTb binding activity was retained through multiple regeneration cycles. After the third regeneration, the slide was transferred from solution into air, reassembled into the epifluorescence cell, and flushed with PBS before being exposed again to the Alexa488CTb/TRITCSA solution. The mean emission intensity (last column of Figure 4) was unchanged from the previous cycles, demonstrating that drying and rehydration had no measurable effect on the capacity of GM1-doped PSLBs to bind Alexa488-CTb. Complete retention of the binding capacity through multiple regeneration cycles, including air exposure, was also observed for lower GM1 mole percentages (data not shown). The 0% GM1 spots [pure poly(bis-SorbPC)] in the array exhibited minimal fluorescence signals after air and Alexa488CTb/TRITC-SA exposure, indicating that specific binding of CTb to GM1 rather than nonspecific adsorption was responsible for the data shown in Figure 4. Overall, these experiments demonstrate the ability to regenerate and reuse poly(bis-SorbPC) arrays for capturing and detecting CTb without loss in ligand binding capacity. However, they do not address whether the specific activity of GM1 is affected by polymerization, drying, and rehydration; this topic will be the subject of future studies.
FIGURE 4.
Plot of the average fluorescence intensity of Alexa488CTb adsorbed to a 10% GM1/poly(bis-SorbPC) PSLB through three regeneration cycles followed by air exposure. The error bars represent the standard deviations of four to six trials.
Mass Spectrometric Detection
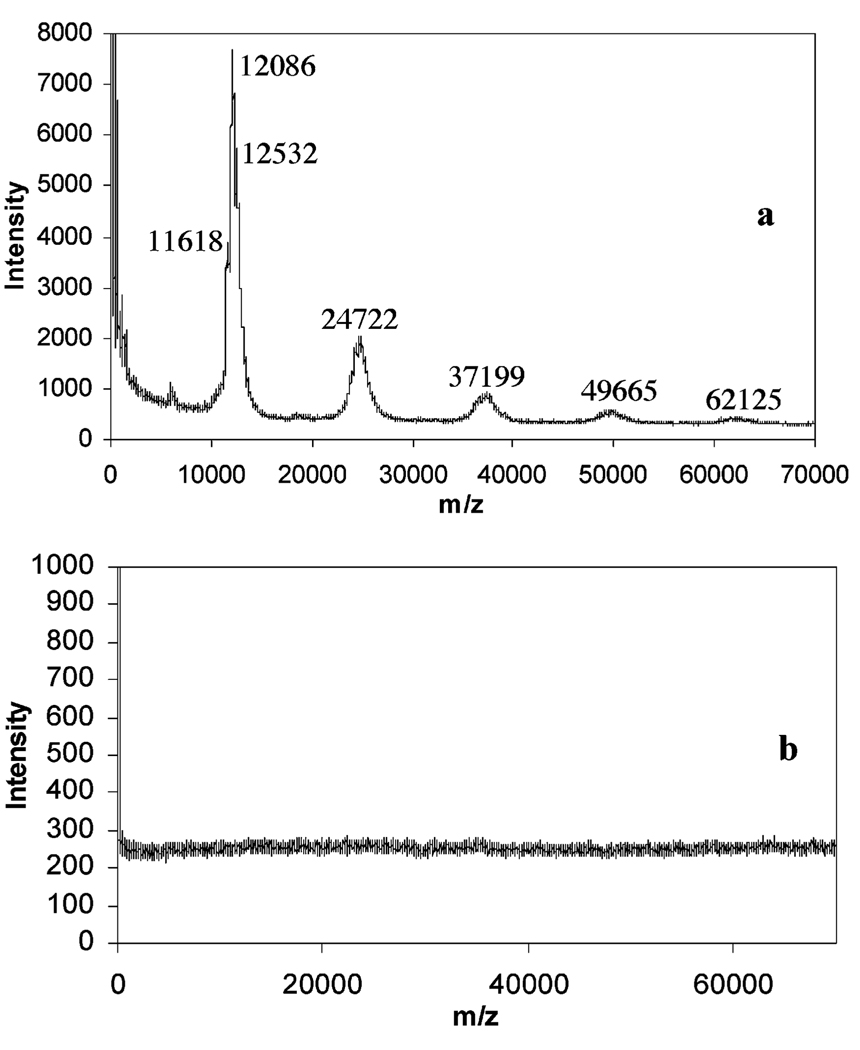
To further assess the utility of using polymerized PSLBs for protein detection and identification, MALDI-TOF mass spectrometry was performed. PSLBs of poly(bis-SorbPC) and poly(bis-SorbPC)/10% GM1 on silicon wafers were dried, exposed to Alexa488CTb, rinsed with water, and dried again. The wafers were spotted with a sinapinic acid matrix, air-dried, and placed under a vacuum in the MALDI-TOF mass spectrometry source after being affixed to a conductive plate. The mass spectra of both bilayers (with GM1 and without) are displayed in Figure 5. In the spectra obtained from the GM1-containing bilayer (Figure 5a), peaks at multiples of ca. 12.4 kDa are observed, while the spectrum obtained from the protein-resistant poly(bis-SorbPC) bilayer shows that no adsorption of Alexa488CTb is detected, as expected (49).
FIGURE 5.
MALDI-TOF mass spectra of Alexa488CTb adsorbed to bilayers of (a) 10% GM1/poly(bis-SorbPC) and (b) pure poly(bis-SorbPC).
The reported value for the molecular weight of the CTb monomer is 11.6 kDa (50). The discrepancy between the molecular weight of the monomer seen in the spectra and the reported molecular weight represents the number of dye molecules attached to CTb. A separate analysis involving the direct ionization of spotted Alexa488CTb with MALDI-TOF mass spectrometry showed that the dye/protein monomer ratio is a distribution of primarily 1:1 at 12 103 Da, with a lesser amount of 0:1 (no dye) and 2:1 at 11 586 and 12 619 Da, respectively (spectra not shown). This analysis was performed in the reflectron mode calibrated with cytochrome c, providing an accurate mass for the determination of dye/protein ratios. The spectra in Figure 5 were taken in linear ion mode, calibrated with BSA; this detection mode produces slightly broader peaks but allows for detection over a much larger mass/charge range to allow for detection of monomer through pentamer of Alexa488CTb desorbed from the PSLB surfaces.
CONCLUSIONS
Microarrays composed of polymerized lipid bilayers were formed using a CFM and shown to be highly stable and resistant to nonspecific protein adsorption. Arrays doped with ligand-bearing lipids selectively capture their respective protein targets from dissolved mixtures, and the extent of target binding is correlated with the mole percentage of dopant. These arrays can be regenerated and reused multiple times and even maintain specific binding, with no apparent change in binding capacity, after exposure to air. Mass spectrometry detection of specifically bound Alexa488CTb demonstrates the possibility of using these poly(lipid) arrays for the identification of captured proteins. In summary, these results show that poly(PSLB) microarrays have considerable potential for use in membrane-based binding assays, with applications in high-throughput pharmacological screening and disease diagnosis.
Acknowledgment
We thank Wasatch Microfluidics for supplying the CFM and Adam R. Miles for assistance. This material is based upon work supported by the National Science Foundation under Grant CHE-0518702 and the National Institutes of Health under Grants R01-EB007047, S10RR13818, U54 AI065359, and R01-GM068120. Any opinions, findings, conclusions, or recommendations expressed in this material are those of the authors and do not necessarily reflect the views of the National Science Foundation or the National Institutes of Health.
REFERENCES AND NOTES
- 1.Muller UR, Nicolau DV, editors. Microarray Technology and Its Applications. Berlin: Springer; 2005. [Google Scholar]
- 2.Stoll D, Templin M, Bachmann J, Thomas Joos T. Microsystems. 2006;16:245–267. [Google Scholar]
- 3.Chen T. Infect. Disord.: Drug Targets. 2006;6:263–279. doi: 10.2174/187152606778249962. [DOI] [PubMed] [Google Scholar]
- 4.Park S, Lee MR, Shin I. Chem. Commun. 2008:4389–4399. doi: 10.1039/b806699j. [DOI] [PubMed] [Google Scholar]
- 5.Castellana ET, Cremer PS. Surf. Sci. Rep. 2006;61:429–444. doi: 10.1016/j.surfrep.2006.06.001. [DOI] [PMC free article] [PubMed] [Google Scholar]
- 6.Kung LA, Kam L, Hovis JS, Boxer SG. Langmuir. 2000;16:6773–6776. [Google Scholar]
- 7.Majd S, Mayer M. Angew. Chem., Int. Ed. 2005;44:6697–6700. doi: 10.1002/anie.200502189. [DOI] [PubMed] [Google Scholar]
- 8.Cremer PS, Yang TL. J. Am. Chem. Soc. 1999;121:8130–8131. [Google Scholar]
- 9.Orth RN, Kameoka J, Zipfel WR, Ilic B, Webb WW, Clark TG, Craighead HG. Biophys. J. 2003;85:3066–3073. doi: 10.1016/S0006-3495(03)74725-0. [DOI] [PMC free article] [PubMed] [Google Scholar]
- 10.Moran-Mirabal JM, Edel JB, Meyer GD, Throckmorton D, Singh AK, Craighead HG. Biophys. J. 2005;89:296–305. doi: 10.1529/biophysj.104.054346. [DOI] [PMC free article] [PubMed] [Google Scholar]
- 11.Yee CK, Amweg ML, Parikh AN. Adv. Mater. 2004;16:1184–1189. [Google Scholar]
- 12.Yu CH, Parikh AN, Groves JT. Adv. Mater. 2005;17:1477–1480. [Google Scholar]
- 13.Yee CK, Amweg ML, Parikh AN. J. Am. Chem. Soc. 2004;126:13962–13972. doi: 10.1021/ja047714k. [DOI] [PubMed] [Google Scholar]
- 14.Morigaki K, Kiyosue K, Taguchi T. Langmuir. 2004;20:7729–7735. doi: 10.1021/la049340e. [DOI] [PubMed] [Google Scholar]
- 15.Morigaki K, Baumgart T, Offenhausser A, Knoll W. Angew. Chem., Int. Ed. 2001;40:172–174. doi: 10.1002/1521-3773(20010105)40:1<172::AID-ANIE172>3.0.CO;2-G. [DOI] [PubMed] [Google Scholar]
- 16.Yamazaki V, Sirenko O, Schafer RJ, Nguyen L, Gutsmann T, Brade L, Groves JT. BMC Biotechnol. 2005;5:18. doi: 10.1186/1472-6750-5-18. [DOI] [PMC free article] [PubMed] [Google Scholar]
- 17.Yang TL, Jung SY, Mao HB, Cremer PS. Anal. Chem. 2001;73:165–169. doi: 10.1021/ac000997o. [DOI] [PubMed] [Google Scholar]
- 18.Burridge KA, Figa MA, Wong JY. Langmuir. 2004;20:10252–10259. doi: 10.1021/la0489099. [DOI] [PubMed] [Google Scholar]
- 19.Shi JJ, Yang TL, Kataoka S, Zhang YJ, Diaz AJ, Cremer PS. J. Am. Chem. Soc. 2007;129:5954–5961. doi: 10.1021/ja069375w. [DOI] [PMC free article] [PubMed] [Google Scholar]
- 20.Phillips KS, Cheng Q. Anal. Chem. 2005;77:327–334. doi: 10.1021/ac049356+. [DOI] [PubMed] [Google Scholar]
- 21.Kam L, Boxer SG. J. Am. Chem. Soc. 2000;122:12901–12902. [Google Scholar]
- 22.Kam L, Boxer SG. Langmuir. 2003;19:1624–1631. [Google Scholar]
- 23.Perez TD, Nelson WJ, Boxer SG, Kam L. Langmuir. 2005;21:11963–11968. doi: 10.1021/la052264a. [DOI] [PMC free article] [PubMed] [Google Scholar]
- 24.Smith KA, Gale BK, Conboy JC. Anal. Chem. 2008;80:7980–7987. doi: 10.1021/ac800860u. [DOI] [PMC free article] [PubMed] [Google Scholar]
- 25.Cremer PS, Boxer SG. J. Phys. Chem. B. 1999;103:2554–2559. [Google Scholar]
- 26.McBee TW, Saavedra SS. Langmuir. 2005;21:3396–3399. doi: 10.1021/la047646f. [DOI] [PubMed] [Google Scholar]
- 27.Ross EE, Rozanski LJ, Spratt T, Liu SC, O’Brien DF, Saavedra SS. Langmuir. 2003;19:1752–1765. [Google Scholar]
- 28.Liu SC, O’Brien DF. J. Am. Chem. Soc. 2002;124:6037–6042. doi: 10.1021/ja0123507. [DOI] [PubMed] [Google Scholar]
- 29.Sisson TM, Lamparski HG, Kolchens S, Elayadi A, O’Brien DF. Macromolecules. 1996;29:8321–8329. [Google Scholar]
- 30.Parikh AN, Beers JD, Shreve AP, Swanson BI. Langmuir. 1999;15:5369–5381. [Google Scholar]
- 31.Meuse CW, Krueger S, Majkrzak CF, Dura JA, Fu J, Connor JT, Plant AL. Biophys. J. 1998;74:1388–1398. doi: 10.1016/S0006-3495(98)77851-8. [DOI] [PMC free article] [PubMed] [Google Scholar]
- 32.Raguse B, Braach-Maksvytis V, Cornell BA, King LG, Osman PDJ, Pace RJ, Wieczorek L. Langmuir. 1998;14:648–659. [Google Scholar]
- 33.Naumann R, Schiller SM, Giess F, Grohe B, Hartman KB, Karcher I, Koper I, Lubben J, Vasilev K, Knoll W. Langmuir. 2003;19:5435–5443. [Google Scholar]
- 34.Terrettaz S, Mayer M, Vogel H. Langmuir. 2003;19:5567–5569. [Google Scholar]
- 35.Janshoff A, Steinem C. Anal. Bioanal. Chem. 2006;385:433–451. doi: 10.1007/s00216-006-0305-9. [DOI] [PubMed] [Google Scholar]
- 36.Atanasov V, Knorr N, Duran RS, Ingebrandt S, Offenhausser A, Knoll W, Koper I. Biophys. J. 2005;89:1780–1788. doi: 10.1529/biophysj.105.061374. [DOI] [PMC free article] [PubMed] [Google Scholar]
- 37.Holden MA, Jung SY, Yang TL, Castellana ET, Cremer PS. J. Am. Chem. Soc. 2004;126:6512–6513. doi: 10.1021/ja048504a. [DOI] [PubMed] [Google Scholar]
- 38.Lasic DD. Angew. Chem., Int. Ed. Engl. 1994;33:1685–1698. [Google Scholar]
- 39.Ringsdorf H, Schlarb B, Venzmer J. Angew. Chem., Int. Ed. Engl. 1988;27:113–158. [Google Scholar]
- 40.O’Brien DF, Armitage B, Benedicto A, Bennett DE, Lamparski HG, Lee YS, Srisiri W, Sisson TM. Acc. Chem. Res. 1998;31:861–868. [Google Scholar]
- 41.Mueller A, O’Brien DF. Chem. Rev. 2002;102:727–757. doi: 10.1021/cr000071g. [DOI] [PMC free article] [PubMed] [Google Scholar]
- 42.Armitage BA, Bennett DE, Lamparski HG, O’Brien DF. Adv. Polym. Sci. 1996;126:53–84. [Google Scholar]
- 43.Bader H, Dorn K, Hupfer B, Ringsdorf H. Adv. Polym. Sci. 1985;64:1–62. [Google Scholar]
- 44.Nakaya T, Li YJ. Prog. Polym. Sci. 1999;24:143–181. [Google Scholar]
- 45.Ross EE, Joubert JR, Wysocki RJ, Nebesny K, Spratt T, O’Brien DF, Saavedra SS. Biomacromolecules. 2006;7:1393–1398. doi: 10.1021/bm050727l. [DOI] [PubMed] [Google Scholar]
- 46.Subramaniam V, Alves ID, Salgado GFJ, Lau PW, Wysocki RJ, Salamon Z, Tollin G, Hruby VJ, Brown MF, Saavedra SS. J. Am. Chem. Soc. 2005;127:5320–5321. doi: 10.1021/ja0423973. [DOI] [PubMed] [Google Scholar]
- 47.Sells TD, O’Brien DF. Macromolecules. 1994;27:226–233. [Google Scholar]
- 48.Chang-Yen DA, Myszka DG, Gale BK. J. Microelectromech. Syst. 2006;15:1145–1151. [Google Scholar]
- 49.Ross EE, Spratt T, Liu SC, Rozanski LJ, O’Brien DF, Saavedra SS. Langmuir. 2003;19:1766–1774. [Google Scholar]
- 50.Holmgren J. Nature. 1981;292:413–417. doi: 10.1038/292413a0. [DOI] [PubMed] [Google Scholar]


