Abstract
Non-Cartesian and rapid imaging sequences are more sensitive to scanner imperfections such as gradient delays and eddy currents. These imperfections vary between scanners and over time and can be a significant impediment towards successful implementation and eventual adoption of non-Cartesian techniques by scanner manufacturers. Differences between the k-space trajectory desired and the trajectory actually acquired lead to misregistration and reduction in image quality. While early calibration methods required considerable scan time, more recent methods can work more quickly by making certain approximations. We examine a rapid gradient calibration procedure applied to multi-echo 3DPR acquisitions where the calibration runs as part of every scan. After measuring the trajectories traversed for excitations on each of the orthogonal gradient axes, trajectories for the oblique projections actually acquired during the scan are synthesized as linear combinations of these measurements. The ability to do rapid calibration depends on the assumption that gradient errors are linear and time-invariant. This work examines the validity of these assumptions and shows that the assumption of linearity is reasonable, but that gradient errors can vary over short time periods (due to changes in gradient coil temperature) and thus it is important to use calibration data matched to the scan data.
INTRODUCTION
Significant efforts have been focused on minimizing the impact of gradient imperfections on rapid and non-Cartesian imaging sequences as well as phase-sensitive techniques like phase-contrast imaging (1,2,3,4,5,6,7,8,9). Gradient delays and eddy currents can cause differences between the specified k-space trajectory and the k-space trajectory that is actually acquired. If these errors are not properly eliminated or compensated for during acquisition or in reconstruction, they lead to undesirable image degradation. Rapid imaging techniques which use short receiver sampling periods and put high demands on gradient hardware can exacerbate these effects, as timing errors of only a few microseconds can lead to a misalignment of a significant fraction of a k-space sample point or more.
The necessity of improving the robustness of non-Cartesian acquisitions was described at the “Unmet Needs” session at the 2006 annual ISMRM meeting. Non-Cartesian acquisitions such as radial and spiral imaging are more sensitive to gradient errors than conventional Cartesian sequences. As scanner manufacturers typically design and maintain scanners to perform conventional Cartesian imaging techniques, many instabilities and non-linearities that do not impact conventional techniques remain that can significantly degrade non-Cartesian MRI. The differences from ideal behavior vary significantly from site to site, scanner to scanner, and even over time, negatively impacting the robustness of non-Cartesian techniques, a problem that becomes especially evident when new techniques make the transition from research sites to a wider range of imaging centers.
Scanner manufacturers have long utilized pre-emphasis compensation (10,11,12) in their gradient hardware to limit the effects of eddy currents. However, these filters are typically tuned to mitigate the effects of the longer time-constant eddy currents that can interfere with the conventional Cartesian acquisitions predominantly used clinically. Short time-constant gradients errors are not fully compensated and the pre-emphasis filter settings are typically updated only rarely, often in conjunction with scheduled service visits. Even with these filters, a significant degree of eddy-current induced gradient distortion still exists.
As radial techniques acquire the center of k-space in every TR, variations in gradient timing can lead to misregistration of k-space samples from multiple excitations near the center of k-space (1). While gradient timing errors for Cartesian imaging cause a linear bulk shift of the k-space data and thus only affect image phase, the non-uniform shifts seen with non-Cartesian imaging are far more destructive. A variety of calibration techniques have been discussed (1,2,3,4,6,7,8,9) to measure gradient errors and compensate for them, either by adjusting the sequence timing, using compensatory prephasing blips at the time of the scan, or by taking into account gradient errors during reconstruction. However, many of these techniques are too lengthy and/or complex to be performed except during scanner service or perhaps as part of a daily scanner calibration. To be practical and most effective, a calibration must be fast and reliable enough to be completed prior to every clinical scan.
Sequences using multiple-echo trajectories such as SPIDER (multi-echo 2DPR), VIPRME (multi-echo 3DPR), SMART (3D Rosettes), and in general any sequence using bipolar gradients to sample k-space in differing directions, can be particularly susceptible to undesirable artifacts due to k-space deviations (13,14,15). As k-space is sampled repeatedly within a readout along a trajectory that crosses the center of k-space in opposing directions, slight gradient timing errors can lead to misregistration of data and destructive interference within a single readout. For multi-echo radial imaging, this can be especially problematic, as the misregistration particularly affects spectral content at crucial low spatial frequencies near the center k-space. When a trajectory begins and ends at the origin of k-space or crosses the center of k-space in opposing directions within a single readout, simple compensatory blips at the beginning of the readout are inadequate to re-center each echo in the echo-train.
Duyn (8) proposed a simple technique to measure the actual k-space trajectory for each of the individual gradient waveforms to be used in a scan. Such an approach is very time consuming for sequences with numerous gradient waveforms, such as radial scans. Instead, Lu (16) measured the actual path traversed through k-space for each of the three physical, orthogonal gradients at one scalar multiple of the gradient amplitude on a per-scan basis. This calibration allowed k-space deviations for any projection within the scan to be estimated and corrected using a linear combination of the three orthogonal measurements.
Using an enhanced version of this calibration on every scan has proven successful in improving image quality for research and clinical scans, even in the presence of large and variable gradient system imperfections. Gradient deviations leading to errors of an entire k-space point or more are not uncommon on systems used clinically, and errors of several points are seen when pre-emphasis compensation is disabled.
This accelerated calibration depends on the ability to characterize the gradients as a linear time-invariant (LTI) system. There are 2 assumptions inherent in this model: 1) that the effects of gradient delays and eddy currents on the k-space trajectory are constant over time in the course of a single scan, and 2) the measured k-space trajectory deviations vary linearly with gradient amplitude. This work examines the validity of these assumptions on modern scanners and the impact of k-space deviations on image quality.
THEORY
Gradient Delay Errors
Gradient delays, the differences between the actual and nominal (programmed) gradient start time, can result from poor characterization of various components in the gradient subsystem, or from time-varying properties of these subsystems. Delays lead to k-space trajectory deviations that resemble a scaled version of the gradient waveform. Considering a single axis, a gradient, G(t), would ideally produce a k-space trajectory k(t):
| [1] |
using τ as a dummy integration variable. In the presence of a gradient delay, Δt, the actual gradient, G’(t), would be:
| [2] |
and the resulting k-space trajectory, k’(t), becomes:
| [3] |
The resulting k-space trajectory error, kerror(t) is then:
| [4] |
For small Δt, this can be approximated as:
| [5] |
This means that the k-space trajectory error caused by an uncompensated delay resembles a scaled version of the gradient waveform. As each axis is associated with a separate physical gradient with separate hardware, the delays and thus the trajectory error may vary independently between axes.
Gradient Electrical Model
Gradient coils present an inductive and resistive load to gradient power amplifiers. Considering the gradient coil as a simple series combination with inductance L and resistance R, its step response is a decaying exponential with time constant τ = L/R. One source of gradient delays is variations in the time constant of the gradient coils due to variations of the resistance of the coil with temperature. As the gradient coils consist of conductive metals, resistance increases with temperature, decreasing the time constant and leading to a quicker response. Thus, if the gradient amplifier is tuned to deal with warm gradient coils, then the system will show some “lag” when the gradient coils are cooler. Similarly, tuning with the gradients cold will cause the gradients to start earlier than expected when the system is warm. Feedback paths in the gradient amplifier sense this change in performance and adjust the drive voltage to compensate, but feedback bandwidth is necessarily limited and thus the gradient waveform can still be affected.
Eddy Current Errors
Pre-emphasis filters are commonly used in the gradient waveform generator hardware to compensate for lag in the requested output waveform caused by eddy currents. These filters are usually designed to mitigate longer time-constant terms that negatively impact the primarily Cartesian sequences used clinically and may not correct shorter time-constant terms. Additionally, due to variations in the magnitude and decay rate of eddy current deviations and changes in gradient system performance, the filters may under or over-compensate for the deviations, and thus deviations due to eddy currents may be manifested either as a “lag” or “overshoot” at each gradient ramp.
For single-echo radial sequences that don’t use ramp sampling, eddy current induced errors can be modeled as a gradient delay, since approximately the same shift is seen across the entire echo. This means that adjustment of the pre-emphasis filter, sometimes done as part of the manufacturer’s service calibration, may result in changes to the measured effective gradient delays. However, this simple bulk-delay model ignores the fact that eddy currents cause error that may vary during the readout. For sequences such as rosettes or multiple echo radial trajectories that traverse the center of k-space more than once per TR, this model may be unable to center the k-space origin for each of these echoes. Furthermore, it fails to account for gradient deviations which occur during and near periods of gradient ramps.
Measuring k-space Trajectory
Duyn (8) proposed a simple technique to measure the actual k-space trajectory traversed due to a single spatial encoding axis during an acquisition. Duyn pointed out that, as the gradient introduces a spatial variation in resonant frequency, a phase progression, ϕr(t), accumulates, that corresponds to the actual k-space trajectory. To make a measurement, a thin slice is excited a known distance, Dr, from isocenter, orthogonal to the gradient under test. After excitation, the phase of the excited slice is measured while the readout gradient under test is played. In a second experiment, the phase of the excited slice is also measured without the gradient under test to determine the phase accrual simply due to off-resonance. The phase from the second experiment is subtracted from the phase of the first to eliminate errors due to off-resonance spins and other effects, and the resulting phase difference, Δϕr(t), is directly proportional to the actual k-space trajectory:
| [7] |
The choice of test slice location is important to avoid ambiguity due to phase wrapping in the measurement. For a slice at the edge of the field of view (FOV), π phase accumulates between each k-space point, making phase unwrapping challenging in the presence of noise. For a slice closer to isocenter, the corresponding phase of the test slice accumulates much more slowly and thus unwrapping phase is much simpler. The phase difference can be unwrapped and scaled by a factor of FOV/Dr to obtain the actual k-space trajectory.
This technique measures k-space trajectories along a single axis and cannot be directly used to measure trajectories achieved using two or three gradients simultaneously. However, separate measurements made on each axis may be combined to synthesize a waveform for arbitrary k-space trajectories.
For situations like breast and extremity imaging, patient position and coil sensitivity patterns often mean there is no source of signal near the magnet isocenter. Phase accrual for an excited slice further off isocenter would normally be faster and thus more sophisticated phase unwrapping would be necessary. Jung et al. describes a technique using the hardware demodulation capabilities in the receiver to limit phase accrual. These off-isocenter calibration measurements remain sensitive to gradient non-linearity and uncompensated delays between the gradient and receiver frequency modulation subsystem. Jung’s technique uses two slices on either side of a selected center point to yield a robust measurement of k-space trajectory based on signal from an off-isocenter point in the scanner, even in the presence of errors in the demodulation system. While the individual trajectories are corrupted by these delay errors, the difference between the two slices allows measurement of the true trajectory (18).
METHODS
Trajectory Calibration and Correction
A k-space trajectory measurement was added to a standard 3D radial, RF spoiled, gradient recalled sequence, termed 3DPR-SPGR. The measurements are performed automatically at the end of every scan. The gridding-based reconstruction technique was modified to incorporate k-space trajectory measurements, with samples gridded to a point in k-space corresponding to their measured location, rather the nominal position predicted by assuming ideal gradient performance.
As it is not feasible to acquire k-space trajectory measurements for every projection used in the 3D radial acquisition, measurements are made on each of the physical gradient axes and linearly combined to synthesize trajectories for the oblique projections used in the actual acquisition.
To guard against failure when there are limited sources of signal in the body, multiple slices are acquired and signal from the best slice is chosen automatically. For each logical gradient axis (kx, ky, and kz), calibration measurements are made on four slices, at ±20 mm and ±40 mm from the center of the prescribed FOV. Pairs of opposed slices are selected by using a fixed slice select gradient and by altering only the RF modulation frequency. Though errors in the center frequency of the magnet may alter the absolute positions of the pair of slices, the distance between the slices will be precisely known. At each slice, measurements are made with a readout gradient corresponding to a projection aligned perpendicular to that slice (“gradient on”) as well as with a no readout gradient (“gradient off”), so there are four experiments for each equidistant slice pair. Each experiment is repeated ten times for signal averaging.
To provide meaningful phase measurements to determine the k-space trajectory, the signal magnitude must always be non-zero. The test slice thickness is chosen to be equivalent to the scan resolution (typically 0.4 – 2.0 mm), limiting dephasing within the calibration test slice that would cause signal dropouts.
A total of 240 experiments (4 slices * 3 axes * 2 gradient settings * 10 repetitions) are conducted, with a TR of approximately 10-15 ms, for a total calibration time of approximately 3 s. On each axis, experiments are interleaved among the slices to increase recovery time between repetitions on each slice, yielding increased signal. The data is normally processed online as part of a C-based reconstruction program, but in this work it is also processed off-line using analysis tools developed in MATLAB (The MathWorks, Inc., Natick, MA).
For each axis, the pair of slices with the best signal (defined as the set of four experiments with the greatest magnitude for the minimum signal value) is selected. For each receiver, the signal is summed from the ten experiments and the phase progressions in the “gradient on” and “gradient off” configurations are subtracted to give a phase difference map. Receiver phase difference maps are combined on a point-by-point basis by weighting according to the square of the receiver signal (using the product of the magnitudes of the “gradient off” and “gradient on” experiments) to yield a phase difference map for each axis (19). The phase difference map is unwrapped using a simple algorithm that replaces absolute jumps greater than π with their 2π complement. The unwrapped phase difference maps for the two slices are then subtracted and scaled according to the field-of-view and slice separation to yield a map of the k-space trajectory for a projection along that axis.
During image reconstruction, the gradient calibration measurements are used to more accurately interpolate the data into a Cartesian grid. For each acquired sample point, its actual position along each of the k-space axes is estimated by scaling the measured k-space position of that sample point for a full-magnitude gradient waveform by the programmed gradient amplitude on that axis. The sample weighting for density compensation is similarly adjusted by the estimated rate of travel through k-space at that point using the weighted sum of the rate of position change (using a double-sided first-order difference) on each k-space axis.
Analysis of Gradient Performance
Testing took place on a variety of GE Healthcare Excite 1.5 and 3.0 T scanners with dual gradient systems. The shorter gradient system had peak strength of 40 mT/m while the longer gradient system had a peak strength of, 23 mT/m. A quality assurance phantom was scanned on a 1.5 T scanner with the higher speed gradient subsystem in a quadrature T/R head-coil using a 40 s multi-echo 3D radial, RF spoiled, gradient-recalled acquisition which collected four half-echoes at four unique projection angles per 4.5 ms TR, with ±125 kHz bandwidth (4 μs sampling period) and 30° flip, to image a 26 cm spherical FOV with 1.0 mm isotropic resolution. The described gradient calibration was run automatically at the end of each scan and was used to measure k-space trajectories. To increase signal levels, the calibration used a (unspoiled) gradient-recalled echo sequence with a 15° flip angle and a TR of 10 ms.
Generally, calibration data is processed automatically during image reconstruction, with the best pair of slices chosen using an algorithm that considers raw signal level and a heuristic based on symmetry and smoothness of the resulting k-space trajectory. For the purposes of this work, the automated system was bypassed to improve consistency, and measurements from the slices at ±4 mm were selected manually for analysis.
To examine the accuracy of these measurements, the scan and calibration were repeated twice and the root-mean-square difference between the measured k-space trajectories was calculated. The entire process was repeated with the standard pre-emphasis filters disabled in order to assess the robustness of the calibration and correction to very large gradient errors.
Variations in Gradient Delay with Gradient Temperature
To measure the effect of gradient temperature on gradient delays, a gradient measurement was performed repeatedly, interleaved with an imaging sequence that used high gradient amplitudes and duty cycle to cause gradient heating. The imaging sequence was a four half-echo 3D radial, RF spoiled, gradient-recalled sequence with a 30° flip angle, ±125 kHz bandwidth (4 μs sampling period), 20 cm FOV and 0.78 mm isotropic resolution on a 3.0 T scanner using the shorter, faster gradients with peak strength of 40 mT/m. To maximize calibration SNR, a large phantom was used that entirely filled the imaging FOV. The calibration measured the same four half-echo trajectory with a GRE sequence, 15° flip, and 10 ms TR. Measurements were made after the scanner had been idle for several hours. The sequence was quite gradient intensive, with gradients active on all three axes for approximately 2/3 of each TR, with high slew rates occurring during much of this time.
First, a trajectory measurement was performed five times at one minute intervals to obtain a baseline trajectory. The trajectory measurement is brief and should not result in significant gradient heating. Next, a four-minute imaging scan was performed, immediately followed by an additional trajectory measurement. This sequence of four minutes of scanning followed by a trajectory measurement was repeated five times at five minute intervals over a 25-minute time period. Scanner bore temperature, measured by the manufacturer’s patient comfort monitoring system, was recorded at the completion of each scan.
The delays in the resulting k-space trajectory waveforms were estimated using the following algorithm implemented in MATLAB. The measured waveform was upsampled by a factor of 100 (using piecewise cubic spline interpolation) and cross-correlated against the ideal waveform, with the peak of the cross-correlation curve corresponding to the gradient delay. The gradient waveform timing shift for each axis was plotted against time.
Linearity of Gradient Errors with Gradient Magnitude
The rapid calibration technique depends on the assumption that the actual k-space trajectory varies linearly with gradient magnitude. To determine whether trajectory errors vary linearly with gradient magnitude, gradient measurements were repeatedly performed on a phantom, with the magnitude of the gradient being varied. A large phantom was scanned using a four half-echo 3D radial acquisition with ±125 kHz bandwidth (4 μs sampling period), 26-cm FOV and 1.0 mm isotropic resolution. Instead of the simple rapid calibration described earlier that used a single measurement made at full gradient strength, the gradient calibration was performed several times, with gradients varied in 10% increments from full-strength (100%) down to 10% strength, with a final full-strength measurement made again to guard against temporal variations. Testing was performed on a GE Healthcare 1.5 T scanner with a maximum slew rate of 150 mT/m/ms using a normal clinical configuration as well as a modified configuration in which the pre-emphasis filters were deliberately disabled.
For each gradient strength, the measured trajectory was subtracted from the programmed trajectory to yield a deviation waveform. The deviation waveform for the full-strength measurement was linearly scaled according to the gradient strength of each reduced-strength measurement, providing an estimate for the deviation waveform at that strength based on the linear model. This estimate was subtracted from the actual measured reduced-strength deviation waveform, to yield a measurement of the k-space positioning error due to the assumption of linearity. This waveform, showing the unmodeled trajectory deviation, was differentiated to yield a map of unmodeled gradient error.
To examine the effect of these errors on image quality, images were reconstructed incorporating these additional measurements into the gridding process. Instead of the previously described gridding using full-magnitude measurements scaled according to the gradient amplitude, a modified implementation was used that synthesized the k-space position of each sample by linearly interpolating between the two gradient waveform measurements on each axis closest in magnitude to the actual gradient strength used for that projection. Images resulting from this improved implementation were compared to images from the same scan generated using only the full-strength gradient measurements.
RESULTS
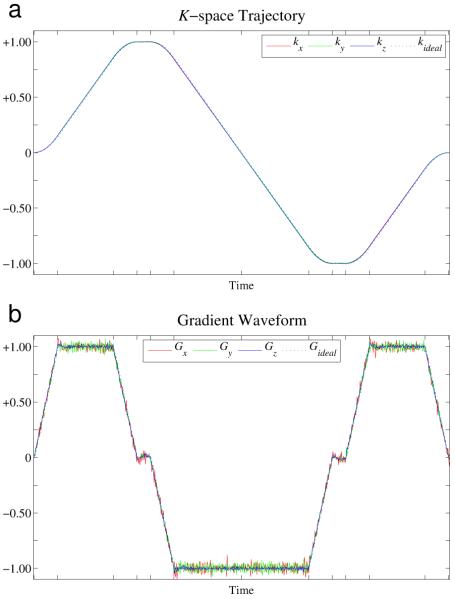
Figure 1 shows measurement for the phantom scan. Measurements of the k-space trajectory for full-magnitude readouts on each of the three gradient axes are shown in the left plot. The trajectories are shown normalized to [−1,+1], though the k-space position actually varies over a nominal range of [−128, +128]. Differentiating this k-space trajectory waveform yields an estimate of the actual gradient at each sample, shown in the right plot. The gradient waveform is normalized such that a magnitude of unity corresponds to changing k-space position by the nominal maximum rate of one cycle over the field-of-view per sample. In each of these plots, the nominal waveforms are shown for reference as a black dotted line.
Figure 1.
(a) Gradient calibration yields a measurement of the actual k-space trajectory traversed for a projection along each of the gradient axes. (b) Differentiating the measured k-space trajectory yields an estimate of the actual gradient waveform. These are plotted against the nominal (commanded) gradient waveform. Notice the overshoots at the end of each gradient ramp.
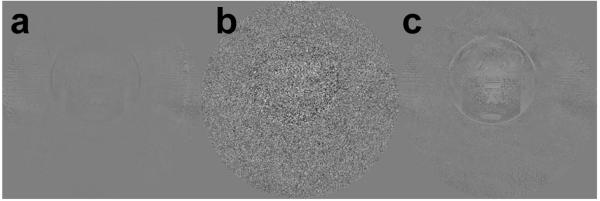
The difference between two trajectory measurements made in rapid succession having a sample-by-sample root-mean-square inconsistency of 0.02-0.03%, small enough to have visually imperceptible effect on image quality. Visual examination of this difference over the course of the readout shows it to be a combination of random noise and contributions correlated to both the k-space trajectory and gradient waveform, so is partially due to slight scan-to-scan variations in gradient amplitude (which causes deviations resembling the k-space trajectory) and delay (which causes deviations resembling the gradient waveform). The scan-to-scan image variation due to changes in calibration data is substantially smaller than the variation due to noise in the image data. The image variation due to changes in calibration data, shown in Figure 2(a) is relatively small, with differences of 1-2% of peak signal values seen in the region of the phantom. This is dwarfed by the 15-20% scan-to-scan variation due to noise in the image data, shown in Figure 2(b).
Figure 2.
Two successive scans are reconstructed in a variety of ways, to demonstrate the consistency of the measurement. Each image shown is a difference image between two reconstructed images, normalized such that white and black represents variation of ±20% of the peak signal value. Image (a) shows the effect of reconstructing a single imaging dataset using k-space trajectories calculated from two different calibration datasets. Image (b) shows, for comparison, the effect of reconstructing two separate imaging datasets using the same k-space trajectory measurement, demonstrating that the scan-to-scan difference due to noise in the image data is significantly larger. Image (c) shows that rapid calibration yields substantially similar images to a more thorough version that measures k-space trajectories at several different gradient amplitudes. A dataset from a single scan was reconstructed using the normal gradient calibration and correction technique as well as the multi-amplitude version and the difference between these two images is shown. Note that the errors associated with the described calibration technique (a and c) are substantially smaller than the errors due to noise (b).
Separating Effects of Delay and Eddy Current
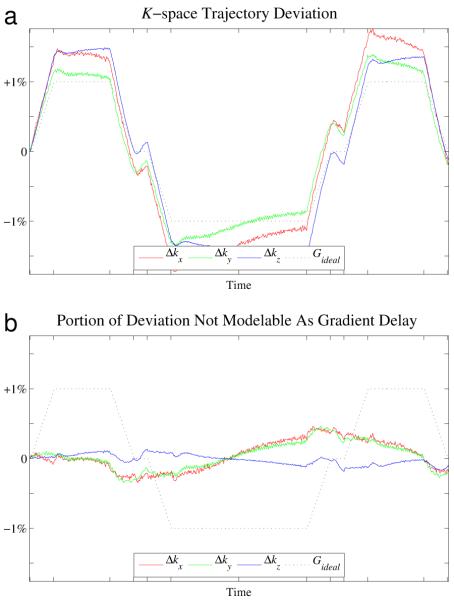
Subtracting the nominal k-space trajectory from each of the measured trajectories yields per-axis trajectory deviation waveforms, which are shown in Figure 3(a). It is apparent that the deviations substantially resemble scaled version of the gradient waveform (shown in black) and thus correspond to gradient delays, or equivalently, mistiming in the pulse sequence between the start of the acquisition and the start of the readout gradient. The magnitude of the deviations correspond to gradient delays of −1.78, −1.41, and −1.77 samples at the ±125 kHz bandwidth used in the exam, or physical advances in gradient timing of 7.1 μs, 5.6 μs, and 7.1 μs.
Figure 3.
(a) Total deviation between measured and nominal k-space trajectories. (b) Component of the deviation that cannot be modeled as a simple gradient delays.
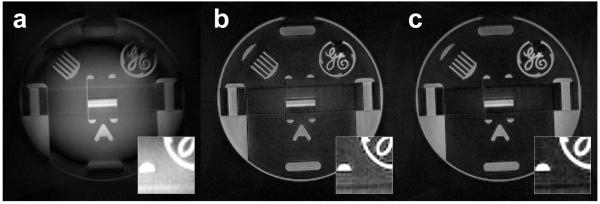
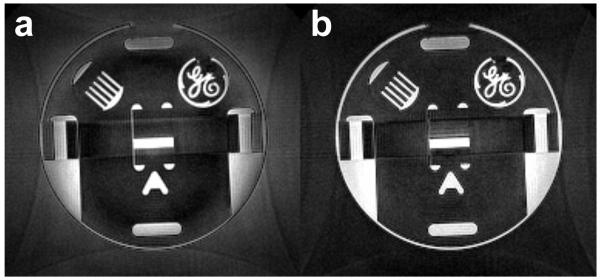
The k-space deviation curve can be modeled as two components: a portion that can be modeled as a gradient delay and a residual portion that cannot be attributed to delay. The non-delay portion is primarily due to eddy currents and is shown in Figure 3(b). While the deviations are substantially smaller, significant errors of over half a k-space point remain. More importantly, errors are still present at one of the k-space center crossings. While single-parameter correction techniques that characterize gradient error using only a bulk delay can properly re-center the origin of k-space in a single-echo readout, the possibility of differing effective delays at the multiple center crossings acquired in multi-echo techniques require more flexible calibration techniques. Figure 4 shows images reconstructed without gradient correction (a), with correction for delays only (b), and with correction for both delays and eddy currents (c). Note that, while both the delay-only corrected and fully corrected images show reduction in background signal level and enormous improvements in image fidelity (e.g. the perimeter of the phantom and shape of top and bottom “bars”), the delay-only correction still shows some erroneous background signal, as well as overshoot (ringing) at high-contrast edges.
Figure 4.
Axial slices through a phantom volume image demonstrate the effect of gradient calibration and correction. (a) Reconstructing the images using the nominal gradient waveforms, without any calibration measurements, leads to obvious degradation in image quality. (b) Using the calibration to estimate effective gradient delays, then reconstructing using the nominal k-space trajectory shifted by these delays yields a substantially improved image that is unaffected by gradient delays, but still damaged by eddy currents, causing some loss of contrast and blurring of high-frequency features. (c) Using the full gradient calibration and correction deals both with delays and eddy currents, yielding the best image quality. The insets show close-ups of each image with expanded contrast – note the lack of ringing at edges and reduced signal level in background areas in image generated using the full calibration.
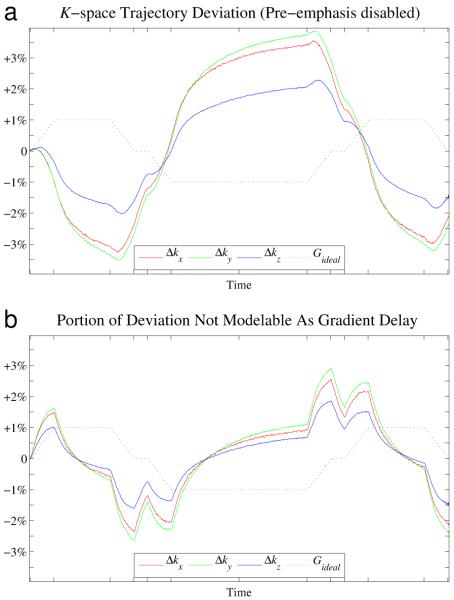
Figure 5 shows the same deviation and no-delay deviation curves for an acquisition in which the standard pre-emphasis filters were disabled. The deviations are now nearly three times larger, but also note that nearly all the increase comes from the portion that cannot be modeled as a simple delay. Large deviations are even seen at the crucial k0 crossing points. While gradient characterization using a simple bulk delay may be adequate for very well-tuned systems, poor eddy current tuning can lead to variable or poor performance that overwhelms these simple systems, another reason flexible calibration are needed for robustness.
Figure 5.
Disabling the standard pre-emphasis filter leads to a substantial increase in gradient errors. Note the differing scale between this and the previous chart. (a) Total deviation between measured and nominal k-space trajectories. (b) Component of the deviation that is not attributable to gradient delays. While the non-delay component is insignificant with pre-emphasis, in this case it is very large, showing that a calibration and correction scheme that characterizes the gradients using a single bulk delay term is not adequate in all cases.
Variations in Gradient Delay with Gradient Temperature
Repeated gradient measurements made as a scanner “warms up” from a period of non-use show that gradient delays vary substantially over time, even through the course of a single scan session. Delays change by nearly 1.5 μs across the session, with almost 0.5 μs of that change occurring during the course of a single scan. The scanner bore temperature was 22°C at the start of the session, and maintained this temperature through the first five brief trajectory measurements. The bore temperature increased monotonically from 22°C to 27°C as the gradient-intensive imaging scans were performed. Bore temperature is likely to be a lagging indicator of gradient temperature, due to thermal insulation and liquid cooling systems.
The gradient delays calculated from these experiments were plotted against time in Figure 6. All three axes show a reduction in gradient delay (an “advance” in the gradient timing) as the scans progressed and temperature increased, which agrees with the predictions of the electrical model discussed earlier. Gradient timing advances of 1.4 μs, 1.3 μs, and 0.4 μs were observed on the X (up/down), Y (left/right), and Z (in/out) physical gradient axes, respectively. It seems most likely that these variations are due to changes in gradient coil temperature, though they could also be due to temperature-related or other changes in gradient amplifier behavior.
Figure 6.
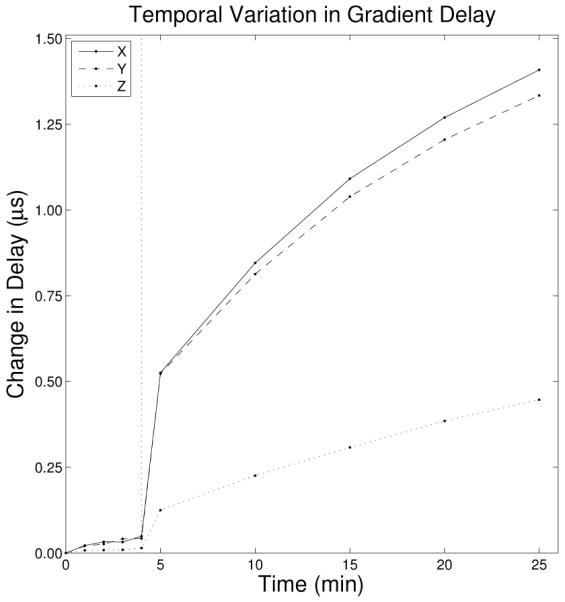
Gradient delays can vary over time based on changes in gradient coil temperature. The variation in delay over time is shown here for each gradient axis. The initial four minutes correspond to measurements made prior to gradient heating, while the later measurements were made at approximately five minute intervals during a gradient-intensive imaging sequence. Correlating each measured k-space waveforms against shifted versions of the nominal waveform allows an estimation of the gradient delay. Changes in gradient delay on the order of a microsecond are seen on all three axes.
At a receiver bandwidth of ±125 kHz, where complex sampling intervals are 4 μs, the observed gradient delay changes of up to 1.4 μs can lead to gridding errors of ⅓ k-space point. Errors of this magnitude significantly impact image quality, as shown in Figure 7. The errors are particularly apparent near the edges of the phantom and near the edge of the FOV, where a marked loss of image quality is apparent.
Figure 7.
Significant changes in gradient timing observed in the course of a single exam session point to the necessity of acquiring gradient calibration data on a per-scan basis, rather than using a per-patient or daily calibration. Using calibration data matched to the acquisition is crucial to achieving maximum image quality. In (a), a slice image is reconstructed from data acquired near the end of the session using calibration data acquired at the beginning of the session (unmatched). In (b), the same end-of-session image dataset is reconstructed using calibration data acquired at the end of the session (matched). Image quality is markedly improved in (b), especially near the edges of the phantom and the FOV.
Significant change in gradient timing can be observed across a single scan. The x and y gradient timings changed by nearly ½ μs over the first 4 minute of imaging, corresponding to an error of ⅛ k-space point, though later scans showed significantly less change as the gradient temperatures approached a steady state.
Linearity of Gradient Errors with Gradient Magnitude
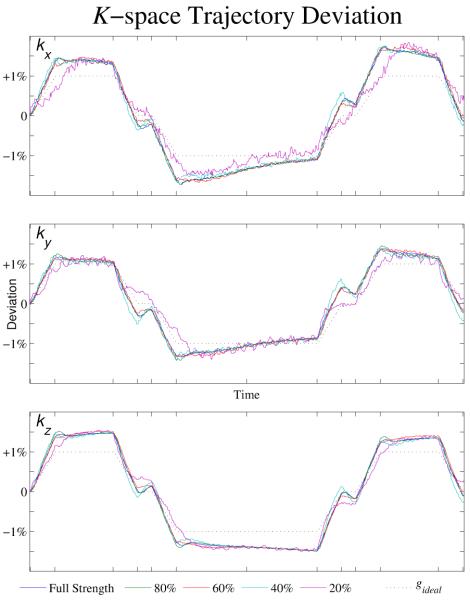
A pair of gradient measurement datasets was selected for analysis. The peak gradient amplitude corresponding to traversing one k-space point per sample, will be referred to as a normalized gradient amplitude of 1.0. In addition to the full-strength measurement, reduced-strength gradient amplitudes of 0.8, 0.6, 0.4, and 0.2 of full-strength were examined. The nominal k-space trajectory was subtracted from each of these and the difference, the k-space trajectory deviation, was plotted in Figure 8, normalized against the programmed gradient amplitude. The nominal gradient waveform is shown for reference as a black dotted line. As discussed earlier, it is clear that the deviation waveforms take the shape of the gradient waveform and thus are predominantly due to gradient delays. The component of the trajectory error which can be modeled as a delay varies linearly with respect to gradient amplitude and is fully corrected during reconstruction. The relative deviations curves closely match between the reduced-strength and full-strength measurements.
Figure 8.
K-space trajectory deviations appear to vary approximately linearly with gradient amplitude, as shown here by subtracting nominal waveforms from the measured waveform for several gradient amplitudes. The k-space trajectory deviation is showed as a percentage deviation from the desired trajectory for several gradient amplitudes. As the deviation waveforms have a shape that is similar to the gradient waveform (black dotted line), it is apparent that they the deviations are predominantly due to a gradient delay rather than eddy currents.
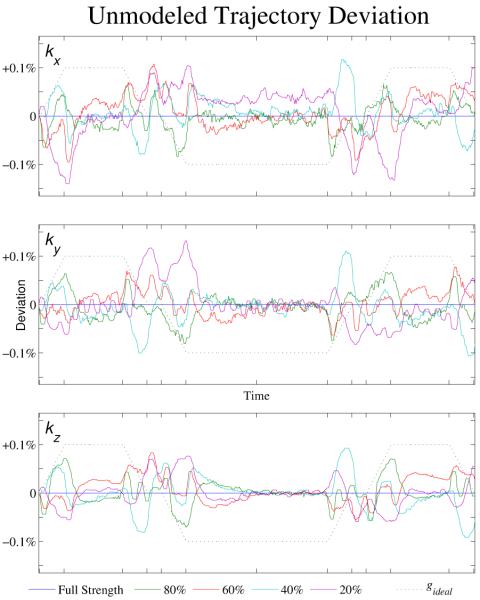
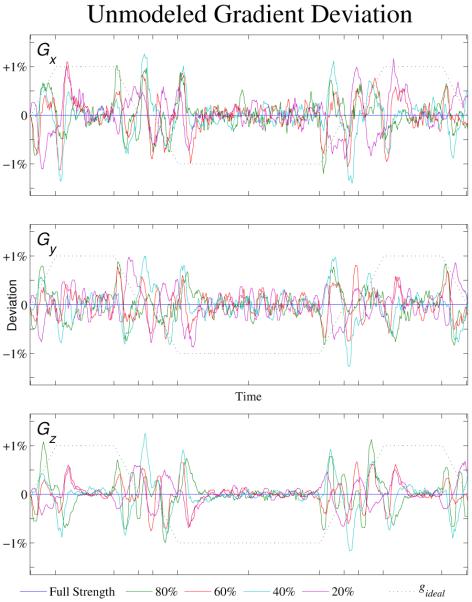
Subtracting the actual measured deviations from the predicted deviations yields the component that cannot be properly handled using only peak amplitude measurements. The resulting error waveforms are shown in Figure 9, as a percentage of the maximum k-space position with full-strength gradients. A three-term median filter was used to reduce noise and improve readability. Note that the maximum residual deviations are now on the order of 0.1% of maximum k-space position, with the typical deviations significantly smaller. As the uncorrected waveform showed raw deviations larger than 1%, this indicates that assuming linear behavior by using the single-strength calibration algorithm allows for the correction of a significant portion of the k-space trajectory error. The largest remaining deviations are seen during or just after periods of gradient ramps, with better-predicted behavior during periods of constant gradients.
Figure 9.
Shown here is the remaining k-space trajectory error (as a percentage deviation from the desired trajectory) that is not corrected by the described algorithm. The remaining deviations are due to non-linear errors in the gradient waveform and cannot be corrected using only data from a single measurement at maximum gradient amplitude.
The impact on image quality of the unmodeled non-linear portion of the deviation is relatively small. Figure 2(c) compares images reconstructed using the conventional full-strength gradient calibration measurement with images that also incorporate the additional information from the reduced strength measurements. The change is not visually noticeable, except in a difference image and the difference, with maximum variations of less than 5% of peak image intensity, is far smaller than the typical scan-to-scan differences seen due to image noise.
When the manufacturer’s standard pre-emphasis filter is turned off, gradient deviations are substantially larger causing k-space position errors of up to 4% of maximum k-space position. However, the unmodeled portion of the k-space position error is still held to approximately 0.1%, showing that the vastly increased eddy current errors can still be compensated using the simple linear model.
DISCUSSION
The ability of this calibration and correction technique to predict k-space errors for any radial acquisition angle based on only three orthogonal measurements is to be expected when the gradient system architecture is examined. Gradient delays and true eddy currents are linear time-invariant phenomena, so using linear combination and time-shifting operators on a single measurement should be adequate to model them. Deviations from linearity are most likely due to variability and/or instability in the gradient amplifier. It is well-known that gradient amplifiers utilize differing switching modes to achieve variable slew rates, so it is reasonable to expect non-linear performance during these periods. Differentiating the trajectory errors yields the causative gradient errors, shown in Figure 10 (filtered using a ten-term median filter to attenuate the noise amplification from differentiation), and it is clear in these plots that larger inconsistencies between gradient deviations are seen for wide variations in gradient amplitude, indicating that the hardware compensation mechanisms do not work equally well across all amplitude ranges. Note however, that while the shape of the gradient waveform varies significantly during and just after ramps, the total area under the gradient curve is well-controlled, so the resultant net change in k-space position is very consistent after a settling time of about 100 μs of the end of a ramp. This means that these errors are entirely irrelevant for acquisitions that do not use ramp sampling and do not acquire central spatial frequencies immediately after or during gradient slewing. As these include most conventional clinically-used sequences, fixing such errors is not a high priority for scanner manufacturers.
Figure 10.
Differentiating the map of uncorrected k-space trajectory error yields the non-linear component of the gradient error which is not modeled using this calibration and correction technique, which is shown here as a percentage of the max desired gradient strength. Delays and eddy currents should lead to gradient errors that vary linearly with amplitude, resulting in similar error curves at all amplitudes. Inconsistency between curves corresponds to non-linear errors that are most likely due to variations in switching behavior of the gradient amplifiers, rather than true eddy currents or delays. Note the significant contribution of noise and that errors are largest during and near periods of gradient ramps.
As the first scan in the temporal stability experiments was performed after a lengthy idle period, it is assumed that the scanner had been allowed to cool below its normal operating temperature. If precise gradient timing is desired, then it might be warranted to use a “warm-up” sequence prior to imaging or to improve the hardware controlling gradient coil temperature. Note that the gradient timing errors shown in Figure 3 are all in the same direction – the gradient is starting earlier than desired – and are rather large – corresponding to more than a sample of misalignment between the start of data acquisition and the gradients. It is apparent that adjusting the pulse sequence to delay the gradients (or equivalently advance the data acquisition window) by 6 μs would effectively eliminate a large portion of the error.
The scanner used here allows gradient timing to be adjusted in 4 μs increments and the data acquisition window to be moved in 1 μs increments through simple modifications to the pulse sequence, so the timing errors could be substantially reduced, though not eliminated entirely, during acquisition. While this would substantially reduce the artifacts in this case, it’s important to remember that such large delays are frequently present and unnoticed on clinically used scanners. The scanner in question had been used clinically without complaint for several months since the last manufacturer’s service. Even on scanners which do permit very precise control of sequence timing, these errors are likely to remain common without automated methods to correct them, especially considering that gradient timing changes of over a microsecond are seen across a single scan session due to changes in system temperature. Such changes have a substantial impact on image quality, reinforcing the idea that a per-scan calibration is beneficial or necessary. To make non-Cartesian acquisitions reliable across a wide installed base of scanner systems, it is crucial that the techniques be robust enough to tolerate significant variations in scanner performance.
It is clear that this calibration and correction technique is robust to large variations in gradient delays and eddy currents, as long as the resulting deviations vary linearly with gradient magnitude. The technique is particularly effective at correcting crucial low spatial frequency data, especially at the k-space origin crossing, which occur at the left edge, center, and right edge of the plot in Figure 9. Visual inspection shows that there is virtually no residual unmodeled error at the first and middle crossing, and relatively small error at the final crossing. The error is larger in the final crossing because it occurs during a period of gradient transition rather than during a flat top, so there is inadequate time for the hardware feedback mechanisms to stabilize after slewing and correct area errors.
Note that many other assumptions are made about the gradient system in the course of imaging that cannot be discussed in this work. One is that gradients are spatially invariant – that programmed gradients cause the magnetic field to linearly over space and thus each location in image space sees the same actual gradient waveform. This can be handled by performing repeated measurements at various locations in image space, but will not be further discussed in this work. Another major assumption is that gradient errors are orthogonally separable – that gradients on one axis do not cause gradient errors on other axes. The spatial consistency of gradients is a major consideration in gradient coil design and will not be examined further here. Cross-axis gradient terms have been discussed by Takahashi and Hinks (17) and are outside the scope of this work. Cross-axis terms do not interfere with this measurement technique, as they merely cause slight phase dispersion across the measurement slice. Since the excited slice must necessarily be perpendicular to the applied gradient, as intraslice dephasing would lead to a complete loss of signal if phase was measured on a slice parallel to the applied gradient, cross-terms cannot be measured with this method. If cross terms were known, they could be corrected during reconstruction by applying similar corrections in the gridding process.
Unlike earlier work that use compensatory blips (2,3) to null gradient errors, the corrections here are performed entirely in reconstruction, requiring no change to the pulse sequence (aside from the collection of calibration data). The calibration measurements can be performed on an arbitrary subject and do not require the use of a large phantom (3), a point source (7), or lengthy calibrations acquisitions (2,4,5). It builds upon the earlier work of Duyn (8) by extending the calibration and correction to multi-echo 3DPR acquisitions and examining the assumptions upon which they depend.
CONCLUSIONS
Effective gradient calibration and correction techniques are necessary for consistent performance for non-Cartesian sequences as well as phase-sensitive imaging techniques (20) on today’s scanners. Measuring and correcting gradient errors using a rapid calibration and linear combination of separate measurements made on orthogonal gradient axes to synthesize the k-space trajectory waveform for each arbitrary projection has proven very successful for research and clinical scans. The rapid calibration is automatically run as part of every scan at our institution. While this technique neglects errors due to non-linearity and temporal variation, these errors are small and impact of the resulting distortions is currently minor. While small gridding errors remain, these are typically less than of a k-space sampling point and have not been observed to have a large impact on image quality.
It has previously been speculated per-scan calibrations will be necessary to achieve the best performance of non-Cartesian techniques on today’s scanners. This view is reinforced by the results of the heating experiments, which show that gradient timing can change by over a microsecond during a single exam session, with nearly half that change occurring across a single scan. Timing changes of this magnitude significantly impact image quality, reinforcing the need for per-scan calibrations on today’s scanners.
Although this work focuses on observations made on scanners available at our site, the gradient measurement technique can be used on any scanner, and the rapid calibration is possible on any scanner with a gradient system that is stable over the course of a single scan and behaves in a largely linear fashion.
For per-scan calibration to be practical and effective for clinical use, it must be fast and reliable across a wide range of scanners, sequences, subjects, and anatomical regions of interest. As radial imaging sequences involve the acquisition of projections on hundreds or thousands of unique angles, it is not feasible to measure the k-space trajectory for every projection, so the ability to synthesize a large set of trajectories from a small set of calibration measurements is essential. Many novel non-Cartesian acquisitions such as SMART (3D Rosettes), zig-zag techniques used for bunched-phase-encoding (BPE), and other techniques which have gained attention lately due to their ability to be accelerated with compressed sensing techniques, also are very sensitive to gradient errors and can benefit from gradient calibration and correction techniques. It seems likely that these techniques will become increasingly important and remain necessary for some time to come.
Acknowledgments
This work was supported in part by NCI 1R01CA116380, NINDS R01NS065034 and GE Healthcare.
REFERENCES
- 1.Dale BM, Duerk JL. The Use of Measured K-space Trajectory For Reconstruction of Radial MRI Data; Proceedings of the 10th Meeting of the ISMRM; Honolulu, HI. 2002.p. 2334. [Google Scholar]
- 2.Peters DC, Derbyshire JA, McVeigh ER. Centering the projection reconstruction trajectory: Reducing gradient delay errors. Magn. Reson. Med. 2003;50(1):1–6. doi: 10.1002/mrm.10501. [DOI] [PMC free article] [PubMed] [Google Scholar]
- 3.Reeder SB, Atalar E, Faranesh AZ, McVeigh ER. Referenceless interleaved echo-planar imaging. Magn. Reson. Med. 1999;41(1):87–94. doi: 10.1002/(sici)1522-2594(199901)41:1<87::aid-mrm13>3.0.co;2-x. [DOI] [PMC free article] [PubMed] [Google Scholar]
- 4.Onodera T, Matsui S, Sekihara K, Kohno H. A Method of measuring field-gradient modulation shapes. Applications to high-speed NMR spectroscopic imaging. J. Phys E: Sci Instrum. 1987;20:416–419. [Google Scholar]
- 5.Papadakis NG, Wilkinson AA, Carpenter TA, Hall LD. A general method for measurement of the time integral of variant magnetic field gradients: application to 2D spiral imaging. Magn. Reson. Imag. 1997;15(5):567–578. doi: 10.1016/s0730-725x(97)00014-3. [DOI] [PubMed] [Google Scholar]
- 6.Takahashi A, Peters T. Compensation of multi-dimensional selective excitation pulses using measured k-space trajectories. Magn. Reson. Med. 1995;34(3):446–456. doi: 10.1002/mrm.1910340323. [DOI] [PubMed] [Google Scholar]
- 7.Mason GF, Harshbarger T, Hetherington HP, Zhang Y, Pohost GM, Twieg DB. A Method to measure arbitrary k-space trajectories for rapid MR imaging. Magn. Reson. Med. 1997;38(3):492–496. doi: 10.1002/mrm.1910380318. [DOI] [PubMed] [Google Scholar]
- 8.Duyn JH, Yang Y, Frank JA, van der Veen JW. Simple Correction Method for K-space Trajectory Deviations in MRI. J. Magn. Reson. 1998;132(1):150–153. doi: 10.1006/jmre.1998.1396. [DOI] [PubMed] [Google Scholar]
- 9.Alley MT, Pineda AR, Bammer R, Markl M, Pelc NJ. A Method for MR Eddy Current Characterization and Compensation; Proceedings of the 11th Meeting of the ISMRM; Toronto, Canada. 2003.p. 1019. [Google Scholar]
- 10.Jensen DJ, Brey WW, Delayre JL, Nayarana PA. Reduction of pulsed gradient settling time in the superconducting magnet of a magnetic resonance instrument. Med. Phys. 1987;14(5):859–862. doi: 10.1118/1.596012. [DOI] [PubMed] [Google Scholar]
- 11.Jehenson P, Westphal M, Schuff N. Analytical method for the compensation of eddy-current effects induced by pulsed magnetic field gradients in NMR systems. J. Magn. Reson. 1990;90:264–278. [Google Scholar]
- 12.van Vaals JJ, Bergman AH. Optimization of eddy-current compensation. J. Magn. Reson. 1990;90:52–70. [Google Scholar]
- 13.Larson AC, Simonetti OF. Real-time cardiac cine imaging with SPIDER: Steady-state projection imaging with dynamic echo-train readout; ISMRM Workshop on Minimum MR Data Acquisition Methods; Marco Island, FL. 2000; p. 186. [DOI] [PubMed] [Google Scholar]
- 14.Barger A, Block WF, Grist TM, Mistretta C. Isotropic resolution and broad coverage in contrast-enhanced MR angiography using undersampled 3D projection trajectories. Magn. Reson. Med. 2002;48(2):297–305. doi: 10.1002/mrm.10212. [DOI] [PubMed] [Google Scholar]
- 15.Noll DC, Peltier SJ, Boada FE. Simultaneous multislice acquisition using rosette trajectories (SMART): A new imaging method for functional MRI. Magn. Reson. Med. 1998;39:709–716. doi: 10.1002/mrm.1910390507. [DOI] [PubMed] [Google Scholar]
- 16.Lu A, Brodsky EK, Grist TM, Block WF. Rapid fat-suppressed isotropic steady-state free precession imaging using true 3D multiple-half-echo projection reconstruction. Magn. Reson. Med. 2005;53(3):692–699. doi: 10.1002/mrm.20389. [DOI] [PubMed] [Google Scholar]
- 17.Takahashi AM, Hinks RS. Measurement of Cross-Axis Gradient Eddy Currents; Proceedings of the 14th Meeting of the ISMRM; Seattle, WA. 2006.p. 1374. [Google Scholar]
- 18.Jung Y, Jashnani Y, Kijowski R, Block WF. Consistent non-cartesian off-axis MRI quality: Calibrating and removing multiple sources of demodulation phase errors. Magn. Reson. Med. 2007;57(1):206–212. doi: 10.1002/mrm.21092. [DOI] [PubMed] [Google Scholar]
- 19.Bernstein MA, Grgic M, Brosnan TJ, Pelc NJ. Reconstruction of phase contrast, phased-array multicoil data. Magn. Reson. Med. 1994;32(3):330–334. doi: 10.1002/mrm.1910320308. [DOI] [PubMed] [Google Scholar]
- 20.Johnson K. Phase contrast eddy current corrections using gradient calibration; Proceedings of the 20th Meeting of the MR Angio Club; Graz, Austria. 2008.p. 105. [Google Scholar]


