

Abstract
The visual system groups similar features, objects, and motion (e.g., Gestalt grouping). Recent work suggests that the computation underlying perceptual grouping may be one of summary statistical representation. Summary representation occurs for low-level features, such as size, motion, and position, and even for high level stimuli, including faces; for example, observers accurately perceive the average expression in a group of faces (J. Haberman & D. Whitney, 2007, 2009). The purpose of the present experiments was to characterize the time-course of this facial integration mechanism. In a series of three experiments, we measured observers’ abilities to recognize the average expression of a temporal sequence of distinct faces. Faces were presented in sets of 4, 12, or 20, at temporal frequencies ranging from 1.6 to 21.3 Hz. The results revealed that observers perceived the average expression in a temporal sequence of different faces as precisely as they perceived a single face presented repeatedly. The facial averaging was independent of temporal frequency or set size, but depended on the total duration of exposed faces, with a time constant of ~800 ms. These experiments provide evidence that the visual system is sensitive to the ensemble characteristics of complex objects presented over time.
Keywords: vision, perception, face, object recognition, temporal integration, texture, spatial vision
Introduction
As we walk down a crowded street we encounter numerous complex objects over time, many of which are similar at the feature level. How does the visual system represent sets of similar objects or features presented over time? One possibility is to generate discrete, high fidelity representations for every object we encounter. Although such a coding scheme is appealing, studies of change blindness and visual short-term memory (Luck & Vogel, 1997; Potter, 1976; Rensink, O’Regan, & Clark, 1997; Simons & Levin, 1998) suggest that we actually have a sparse representation of our visual environment, with conscious access to only a few objects at a time.
In contrast, the phenomenon of Gestalt grouping (Wertheimer, 1923), in which similar objects presented over space (Beck, 1983; Neisser, 1967) or time (Blake & Lee, 2005) appear to belong or group together, shows that the visual system bypasses some of the bottlenecks of vision and attention. However, the specific computation and neural mechanism that underlies Gestalt grouping remains unclear. Interestingly, the results from several groups suggest that the visual system computes and represents summary statistics in visual images, a process that could drive Gestalt grouping (Alvarez & Oliva, 2008; Ariely, 2001; Burr & Ross, 2008; Chong & Treisman, 2003; Haberman & Whitney, 2007, 2009; Parkes, Lund, Angelucci, Solomon, & Morgan, 2001; Watamaniuk & Duchon, 1992). Textures, for example, are composed of many elements, but what we perceive when faced with a texture (such as brick, granite, or stucco) is unequivocally a singular percept or qualia—a summary statistic; the brick-ness of a surface is easily discriminated from the stucco-ness of another surface (Landy & Graham, 2004). Similar sorts of summary statistics are perceived in a range of domains including orientation, motion, size, number, scene gist, color, and even facial expression (Alvarez & Oliva, 2008; Ariely, 2001; Burr & Ross, 2008; Celebrini & Newsome, 1994; Chong & Treisman, 2003, 2005; Haberman & Whitney, 2007, 2009; Parkes et al., 2001; Watamaniuk & Duchon, 1992; Williams & Sekuler, 1984).
As with most of the other low-level summary statistical representations, facial textures—the perception of average facial expression in a group of faces—has mostly been examined in the context of spatial integration; for example, a simultaneously presented set of faces (de Fockert & Wolfenstein, 2009; Haberman & Whitney, 2007, 2009; Sweeny, Grabowecky, Paller, & Suzuki, 2009). In our daily visual experience, however, we encounter sets of similar features and objects over time; a face in natural conversation could display a range of expressions within a very brief time window. Yet, it remains unclear whether the visual system extracts summary representations over time, at least for high-level objects like faces (Albrecht & Scholl, in press, examined average size perception of dynamically changing low-level stimuli).
The goal of the current study was to test whether sets of faces presented in a temporal sequence are represented by the visual system as a summary statistic. To identify the temporal aspects of ensemble face perception, we independently manipulated the number and duration of the faces in the sets and measured the observer’s ability to perceive average facial expression. We found that observers do extract summary statistical representations of groups of faces in a temporal sequence, and our results characterize the temporal limits of this process.
General methods
Subjects
Twelve individuals (7 women, mean age = 23.17 yrs) affiliated with the University of California, Davis participated in three experiments (not all subjects participated in each experiment). Informed consent was obtained for all volunteers who were compensated for their time and had normal or corrected-to-normal vision. All experiments were approved by the Institutional Review Board at UC Davis.
Equipment/setup
All experiments were conducted in a dark, sound-dampened room. Stimuli were presented on one of two high-resolution CRT monitors (Sony Multiscan G520, 21 in., 1600 × 1200 pixel, 85 Hz refresh; and Sony Multiscan G220, 17in., 1152 × 864 pixel, 85 Hz refresh). Participants were seated 65 and 58 cm from the two monitors, respectively. Distance from the screen was controlled using a chin rest and was adjusted separately for the two monitors to equate the angle subtended by each pixel.
Stimuli
Stimuli consisted of a linear sequence of 50 faces created by ‘morphing’ between two emotionally extreme faces of the same person, taken from the Ekman gallery (Ekman & Friesen, 1976). Faces were morphed using Morph 2.5 (Gryphon Software Corporation). The morphed faces ranged in emotional expression from neutral to disgust with face number one being the most neutral (Figure 1). Morphed faces were separated from one another by emotional units; the larger the numerical separation, the easier they were to discriminate. To create the range of morphs, several features (e.g. the corners of the mouth, the bridge of the nose, the corners and center of the eye, etc.) were marked as starting points on one face and matched to their corresponding end points on the other face. For neutral to disgusted expressions, 75 points of interest were specified. The program then linearly interpolated the two original faces, creating 50 separate morphed images (Figure 1).
Figure 1.
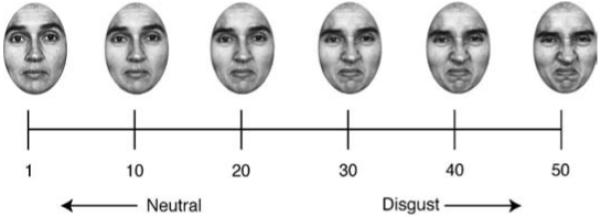
Morph range. We created a stimulus set containing 50 morphed faces ranging from extremely neutral to extremely disgusted. Numbers represent “emotional units.”
The label ‘emotional unit’ is arbitrary, and we do not mean to imply that every emotional unit corresponds to a categorically distinct emotion. Additionally, the morphs, while mathematically linearly related, were not necessarily psychophysically linear. Indeed, the “circumplex” theory of emotion recognition suggests that emotion space unfolds nonlinearly (Russell, 1980; e.g., an angry face may be perceptually further away from a happy face than some other emotion). To test the linearity of our stimulus set, we measured discrimination ability of observers at each point along the morph range in a pilot study. Results of this critical control are discussed below.
All face images were gray scaled (the average face had a 98% max Michelson contrast), subtended 3.21 × 4.34 degrees, and were presented on a gray background (78 cd/m2).
Experiment 1A
The first experiment explored whether observers perceive a summary representation—an ensemble expression—in a set of sequentially presented faces. Observers viewed sets of serially presented faces that varied in expression and judged whether a subsequent test face was more neutral or disgusted than the average expression of the set. We varied set size and the rate at which faces were presented (temporal frequency).
Method
Participants
Three experienced psychophysical observers affiliated with the University of California, Davis, with normal or corrected-to-normal visual acuity participated in the experiment.
Procedure
Observers were presented with a heterogeneous set of faces—displaying varying emotions—at different temporal frequencies. Subjects were asked to judge the mean emotionality of the set (Figure 2). In each trial, 4, 12, or 20 faces were presented sequentially (one face at a time) as a “set,” followed by a single test face. The faces were presented at 1.6, 3.9, 5.3, and 10.6 Hz (312, 128, 94, and 47 ms per face, with a blank screen interstimlus interval [ISI] equal to face duration—50% duty cycle). The temporal frequency and set size were randomized on each trial. Regardless of the number of faces in the set, there were only four unique faces (corresponding to subtle differences in expression) displayed in the set, each of which was separated by at least 6 emotional units (a separation above observers’ discrimination thresholds; see below and Figures 2 and 3 for details). For example, in a set size of twelve there were three instances of each expression, and in a set size of 20 there were five instances of each expression. Therefore, the larger the set size, the more opportunities observers had to view each member face. For each set, the order of presentation was randomized. The faces were presented consecutively in the center of the screen. The mean emotion of each set was randomly selected at the start of every trial. Once the mean was selected, the set was then assembled surrounding the mean: two more neutral (−3 and −9 emotional units below the mean) and two more disgusted (3 and 9 units above the mean; Figure 2). The order in which the faces were presented was randomized. The mean changed on every trial, but was never a constituent of the set.
Figure 2.
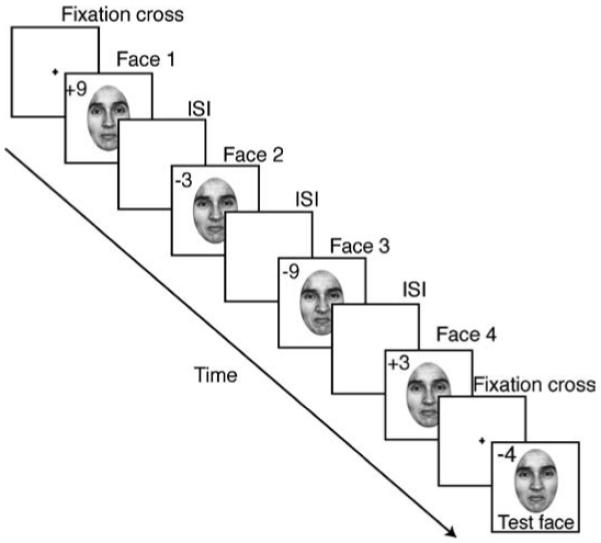
Task sequence for Experiment 1. Observers viewed a series of faces presented at various temporal frequencies (1.6, 3.9, 5.3, 10.6 Hz, 50% duty cycle). The number of faces in the sequence varied from among 4, 12, and 20 items. The sequence was followed by a test face that remained on the screen until response was received. The numbers indicate the distance (in emotional units) of each face relative to the mean expression of the set. The mean and the order of face presentation were randomized on each trial. Numbers were not visible to participants. ISI, interstimulus interval.
Figure 3.

75% discrimination thresholds (in emotional units). In a control study, observers indicated whether a test face was more or less disgusted than the preceding sequence of homogeneous faces. Sensitivity did not differ as a function of morph value. Error bars based on 5000 bootstrapped estimates.
After the presentation of the set of faces, there was a 500 ms ISI, followed by a test face. The test face remained on the screen until observers responded. The test face was more neutral or disgusted than the set by ±2, 4, 8, or 10 emotional units. In a method of constant stimuli, two alternative forced choice (2AFC) task, observers used a key press to report whether the test face was more neutral or disgusted than the average of the preceding sequence of faces. A 1250 ms intertrial interval (ITI) separated each trial. Each run had 96 trials, and observers performed 10 runs for a total of 960 trials.
In a separate control experiment, we measured mean discrimination performance when observers viewed homogeneous sets (i.e., all faces presented were identical) compared to heterogeneous sets (i.e. four unique faces, as above) within a single run. Discrimination of homogeneous sets of faces provides a baseline level of discrimination performance. Ostensibly, reporting whether a test face was more disgusted than the preceding set of identical faces should be an easier task than the mean discrimination task. That is, thresholds for discriminating homogeneous sets should be lower than thresholds for discriminating heterogeneous sets. In this control experiment, there were two conditions (set size of 4 at 1.6 Hz and set size 20 at 10.6 Hz). The separation between the set and test faces ranged from ±2, 4, 6, 8, or 10 emotional units. All other methods were the same. Each run had 200 trials (100 homogeneous trials and 100 heterogeneous trials), and observers performed 3 runs for a total of 600 trials.
A logistic psychometric function was fit to the data using the Psignifit toolbox version 2.5.6 from Matlab (see http://bootstrap-software.org/psignifit/). Thresholds were defined as 75% correct on the psychometric function. Confidence intervals were derived using the bias-corrected accelerated bootstrap method based on 5,000 simulations, also implemented by Psignifit (Wichmann & Hill, 2001a, 2001b).
Results
The goal of the first experiment was to measure whether summary statistics could be extracted from a set of faces presented sequentially over time. Observers performed a mean discrimination task after viewing faces presented sequentially at fixation (Figure 2). In a control experiment observers performed the same task with sets of homogenous faces to determine each observer’s discrimination performance.
Before examining the results of the mean discrimination experiment, however, it was important to verify whether our morphs were psychophysically linear (and not just mathematically linear). We examined data from the control experiment, in which observers viewed sets of heterogeneous and homogeneous faces. Figure 3 displays the 75% discrimination thresholds (in emotion units) for recognizing one homogeneous set as being more disgusted than a reference homogeneous set at all points along the morph range. There was no difference in discrimination ability as a function of where along the morph range observers were tested, as determined by the function pfcmp in Matlab (designed to test for differences between two psychometric curves; see (Wichmann & Hill, 2001a, 2001b); note that only morph values used in experiments below were tested). We tested for significance between morphs 22–24 and morphs 34–36 (see Figure 3), which was where the largest threshold difference occurred, and found none (p = 0.20). Thus, while emotions may unfold nonlinearly in emotion space (Russell, 1980), this did not affect discriminability of our stimulus set. In addition, Figure 3 also verifies that the set members (separated by at least six emotional units from one another) were discriminable.
Figure 4A depicts a psychometric function for one representative observer in the mean discrimination experiment (in which a sequence of different faces was presented). Overall, 75% correct thresholds were comparable to those seen in previous mean discrimination experiments in the spatial domain (see Haberman & Whitney, 2007, 2009). The results suggest that observers perceived a mean expression in a series of sequentially presented faces. A 3 (set size) × 4 (temporal frequency) repeated measures ANOVA revealed no main effect of temporal frequency (F(3, 6) = 0.12, p > 0.5) suggesting that participants were equally sensitive to the set mean regardless of the rate at which faces were presented (Figure 4B). Set size trended toward significance, F(2, 4) = 5.72, p = 0.09, suggesting that the perception of ensemble facial expression may be more precise for larger set sizes.
Figure 4.

Experiment 1A results. (A) Representative psychometric function. For each observer and condition, 75% thresholds were derived. The threshold averaged across observers is depicted in (B), plotted as a function of temporal frequency. (C) 75% thresholds replotted as a function of overall set duration. (D) Results of the control experiment, showing 75% thresholds on homogeneous (identical faces) and heterogeneous sets of faces for each observer. Performance did not differ between the two tasks for either set size 4 or 20. Error bars in (A) are 95% confidence intervals derived from bootstrapping 5000 curve fitting simulations. Error bars in (B-D) represent ± one standard error of the mean (SEM).
Figure 4C depicts thresholds plotted as a function of overall set duration. There appears to be a dependence on overall set duration, whereby thresholds improve with greater exposure time. However, formal analysis of this possibility is reserved until Experiment 2.
In a control experiment, we compared the ability to perceive average facial expression in sets of heterogeneous versus homogeneous (identical) faces. Observers viewed both set types randomly within the same session. For simplicity, we reduced the number of set size/temporal frequency conditions to two. Figure 4D shows the comparative results for the homogeneous and heterogeneous sets. Thresholds for homogeneous sets were not significantly different from thresholds for heterogeneous sets, determined by three t-tests examining set size 4, set size 20, and collapsed across set size (the closest test to significance was set size 4, t(2) = 1.68, p = 0.23). Thus, the mean representation derived from a set of sequentially presented different faces can be as precise as that derived from a set of identical faces. These results also confirm that the unique facial expressions in the sets (Figure 2) were discriminable.
Discussion
In Experiment 1A, we found that subjects were able to extract a mean from a set of sequentially presented faces, even for a set size of 20 faces presented at a temporal frequency of 10.6 Hz. One might have expected a large decline in mean discrimination performance for heterogeneous compared to homogeneous sets of faces. However, our data suggest that they are similarly precise. There was a trend toward set size dependency (Figures 3B and 3C), whereby observers tended to have lower thresholds with larger set sizes, suggesting that either repeated exposures to the faces, or overall duration of the set might benefit ensemble face perception. This will be explored more fully in Experiments 2 and 3. In the current experiment, sets of faces were presented at up to 10.6 Hz, a temporal frequency that exceeds the temporal resolution of attention (Duncan, Ward, & Shapiro, 1994; Verstraten, Cavanagh, & Labianca, 2000). Despite this, observers were able to perceive an average facial expression with ease, suggesting that mechanisms of serial attention may not be necessary to perceive ensemble facial expression.
Although this experiment demonstrates knowledge of the average expression in a sequence of faces, it is yet unclear what kind of information observers have regarding the individual set members. We address this question in the following control experiment.
Experiment 1B
In Experiment 1B, we evaluated observers’ knowledge of the individual set members. Do observers have a high fidelity representation of the set members? If so, it might suggest that constituent information is necessary prior to mean extraction. Our previous work in the spatial domain suggests that observers lose or lack information about the individuals in favor of a summary representation (Haberman & Whitney, 2007, 2009). For this experiment we adapted a similar paradigm for use in the temporal domain.
Method
Participants
Four participants (one from Experiment 1A and three observers naïve as to the purpose of the experiment) participated in this control experiment.
Procedure
Observers viewed sets of 4 faces presented at 14.2 Hz. Following the sequence of faces, observers viewed a single test face and were asked to indicate where in the sequence the test face appeared (first, second, third, or fourth; 4AFC). If observers have a representation of the individual set members, they should be able to identify where in the sequence a face occurs at above chance levels.
Results and discussion
Consistent with previous work (Haberman & Whitney, 2007, 2009), observers had little knowledge of the individual set members. Figure 5 indicates that observers were at chance in identifying where within the sequence a test face had actually appeared (observer closest to significance: AD, χ2 = 1.33 (1), p = 0.25). Despite losing or lacking constituent information, observers were still able to derive an accurate representation of the mean expression (although three observers had not participated in Experiment 1, all of them participated in subsequent experiments and had precise mean representations). This reveals an efficient heuristic at work, one that favors the computationally simplistic extraction of the mean over the more cumbersome (although equally valid) representation of every individual set member.
Figure 5.
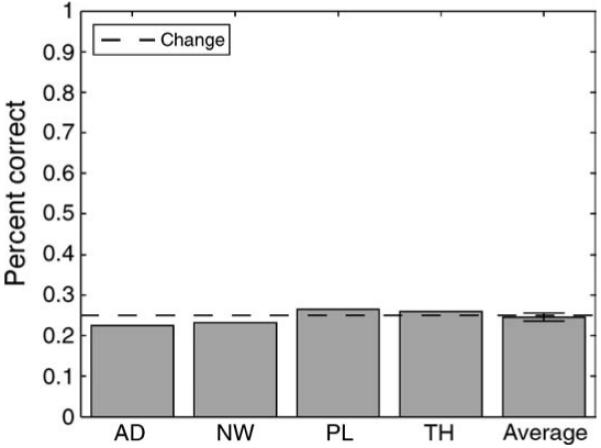
Experiment 1B results. Observers were at chance in identifying where in the sequence of faces a particular test face appeared. This suggests they lacked or lost information about the individual set members and instead favored a mean representation. Error bar denotes SEM.
In an additional control experiment, we examined whether observers were using range information (rather than all the set members) to derive the mean expression. We explicitly tested three observers’ knowledge of the most emotionally extreme face in the set. The results suggested that they had a poor representation of that set member, discounting the possibility that observers used the emotional range of the set to derive the mean representation.
Experiment 2
In Experiment 1, the sequentially presented faces were superimposed at the center of the screen. It is possible that, at high temporal frequencies, masking or apparent motion artifacts might have influenced sensitivity to average facial expression. Additionally, all faces in Experiment 1 were foveally viewed. Does the perception of average facial expression in sequentially presented faces hinge upon superposition and foveal presentation? In Experiment 2 we addressed these concerns by presenting each face in the set (stimuli from Experiment 1) in random spatial positions on an invisible isoeccentric ring around the fixation point at the center of the screen (Figure 6).
Figure 6.
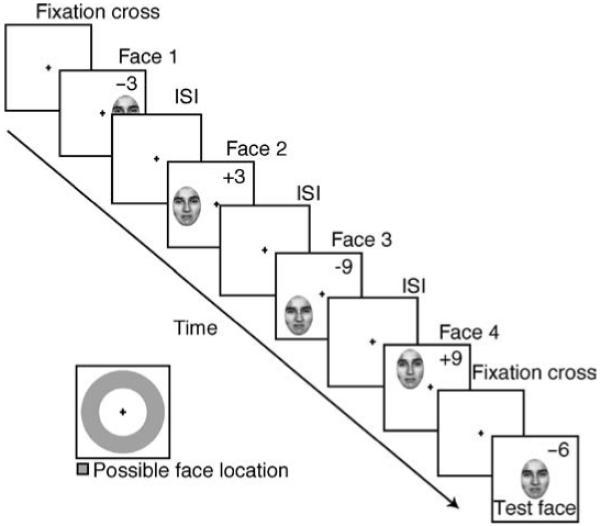
Task sequence for Experiment 2. Observers fixated a central cross while a sequence of faces was presented randomly on an invisible, isoeccentric ring. Faces were randomly presented at 1.6, 3.9, 14.2, or 21.3 Hz, at set sizes of 4, 12, or 20. The set was followed by a test face that remained on the screen until a response was received. Numbers indicate the distance (in emotional units) each face was from the mean expression, although the sequence (mean expression) was randomized on every trial. Numbers were not visible to participants.
Participants
Nine experienced psychophysical observers (five in the primary experiment, three in both the primary and control experiments, and four additional in just the control) with normal or corrected-to-normal vision participated in Experiment 2. Only two of these individuals had participated in Experiment 1.
Procedure
The procedure for Experiment 2 was nearly identical to that of Experiment 1, except for two key manipulations: faces in the set were presented at random positions on an isoeccentric circle (2.65 degrees away from a central fixation cross (Figure 6)). The temporal frequency range was also increased from Experiment 1. Individual faces were presented at a rate of 1.6, 3.9, 14.2, and 21.3 Hz (306, 129, 35, and 23 ms per face with 50% duty cycle; see Figure 6). Subjects fixated on the central cross at all times.
The subsequent test face was presented centrally and remained on the screen until a response was received. The test face was ±2, 4, 6, 8, or 10 emotional units away from the mean emotion of the set. Each run had 120 trials, and observers performed 8 runs for a total of 960 trials.
In a separate control experiment, seven observers performed the same discrimination task on randomly interleaved homogeneous sets (i.e. all faces presented were identical) and heterogeneous sets. The design was similar to the control experiment in Experiment 1A. There were only two set size/temporal frequency conditions (set size 4 at 1.6 Hz and set size 20 at 21.3 Hz). The separation between the set face and test face was ±2, 4, 6, 8, or 10 emotional units. Each run had 200 trials, and observers performed 3 runs for a total of 600 trials.
Results
The purpose of Experiment 2 was to measure observer mean discrimination thresholds when the faces were presented at an isoeccentric distance from fixation. Because faces were not superimposed in the same location (as they were in Experiment 1), apparent motion cues and masking could not explain observer performance in the current paradigm. Figure 7A shows the 75% correct thresholds for each temporal frequency and set size condition, averaged across participants. As was the case in Experiment 1, the 3 (set size) × 4 (temporal frequency) repeated measures ANOVA revealed no significant main effect of temporal frequency or set size, and no significant interaction. This speaks to the flexibility of mean discrimination, as even with the faster temporal frequencies used here (e.g., 21.3 Hz), overall performance was not compromised. Critically, as was the case in Experiment 1, thresholds for homogeneous sets were not significantly different from thresholds for heterogeneous sets (control experiment). This held true for set size 4, set size 20, and data collapsed across set size (the closest test to significance was for set size 4, t(6) = 0.95, p = 0.38). This suggests a precise representation of mean expression (Figure 7B).
Figure 7.
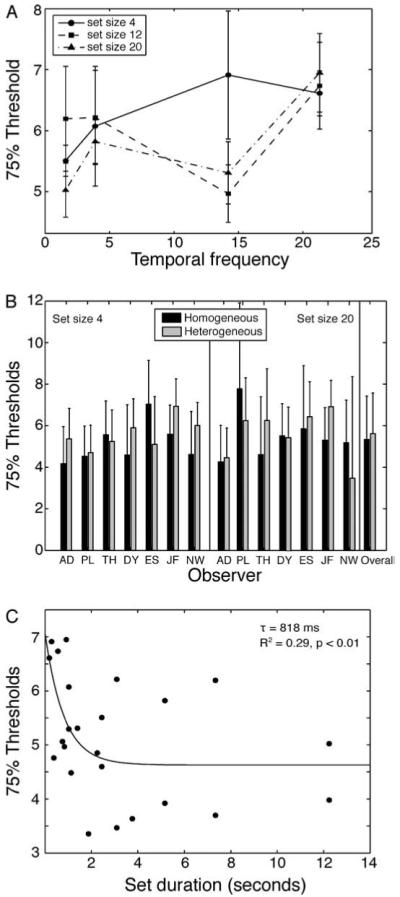
Experiment 2 results. (A) 75% thresholds as a function of temporal frequency, separated by set size. (B) Results of the control experiment, showing 75% thresholds on homogeneous (identical) and heterogeneous sets of faces for each observer on set size 4 and 20, along with overall performance collapsed across set size. Performance did not differ between the two tasks. Note that the large error bar for observer PL occurred for homogeneous discrimination. (C) Decay function fit to 75% thresholds derived from Experiments 1 and 2 reveals an improvement in sensitivity to average expression with increasing exposure to the set of faces. The time constant of the integration was 818 ms, defined as the point on the curve at which performance reached 63% of the asymptotic sensitivity. Error bars in (A) and (B) are ±1 SEM.
To estimate the temporal tuning of ensemble face perception, we fit an exponential decay function, f(x)= a[exp(−bx)] + c, to performance as a function of overall set duration. Because Experiments 1 and 2 both measured mean discrimination performance (albeit on slightly different tasks), and showed comparable levels of performance, we fit the decay function to the combined data set, collapsed across set sizes (Figure 7C). This procedure allowed us to identify the time constant of the temporal integration process (1/b is the time constant, tau, which is the time it takes to reach 63% of the asymptotic threshold). The fit of the decay function was significant (r2 = 0.29, p < 0.01), suggesting that longer exposure to the set generally improved sensitivity to average facial expression. The time constant of ensemble face perception was 818 ms, an integration period comparable to that required for biological motion discrimination (Blake & Shiffrar, 2007; Kourtzi, Krekelberg, & van Wezel, 2008; Neri, Morrone, & Burr, 1998).
Discussion
The results of Experiment 2 closely resemble those of Experiment 1. There was a slight decrement in mean sensitivity in comparison to Experiment 1, but this occurred equally for homogeneous as well as heterogeneous sets of faces (Figure 7B). Therefore, the decrement in performance for eccentrically presented faces (Experiment 2) does not indicate a reduced ensemble face percept, but more likely reflects the fact that faces are somewhat harder to recognize in the periphery (Louie, Bressler, & Whitney, 2007; Martelli, Majaj, & Pelli, 2005; McKone, 2004).
Although face recognition was slightly worse with the peripherally presented faces in Experiment 2, this experiment supports previous research showing that faces can indeed be recognized in the visual periphery (Louie et al., 2007; McKone, 2004). Observers demonstrated above chance face recognition at eccentricities of 11.58 degrees (Louie et al., 2007) and even 21.2 degrees (McKone, 2004); our eccentricity (2.65 degrees) falls well within those extreme conditions.
Critically, the time constant for temporal integration was around 800 ms. This integration time is much longer than that for low-level features such as motion direction or speed (Festa & Welch, 1997; Mckee & Welch, 1985; Snowden & Braddick, 1989; Watamaniuk, Mckee, & Grzywacz, 1994) but is comparable to that required for discrimination of biological motion (Neri et al., 1998). Like biological motion (and other forms of structure from motion; (Blake & Shiffrar, 2007; Kourtzi et al., 2008)), a specialized mechanism may exist to integrate facial expression over time, resulting in a summary statistical representation.
Experiment 3
The first two experiments suggested that perceptually integrating facial expression over time depends on the amount of information presented (a function of set size and set duration). Set duration, however, was roughly correlated with the number of faces in each set. The purpose of Experiment 3 was to disambiguate this confound by fixing set duration while manipulating set size.
A second motivation for Experiment 3 was to address whether the edges of the linear morph range in the first two experiments were influential. To address this concern, we created a new set of morphs arranged on a virtual circle, spanning from happy to sad to angry and back to happy again (Figure 8). The advantage of this circular array of stimuli was that there were no “edges.” We used a method-of-adjustment task and assessed the precision with which observers perceived the average facial expression of a sequentially presented set of faces. A further advantage of this method-of-adjustment technique was that it characterized the entire error distribution around the perceived average expression.
Figure 8.
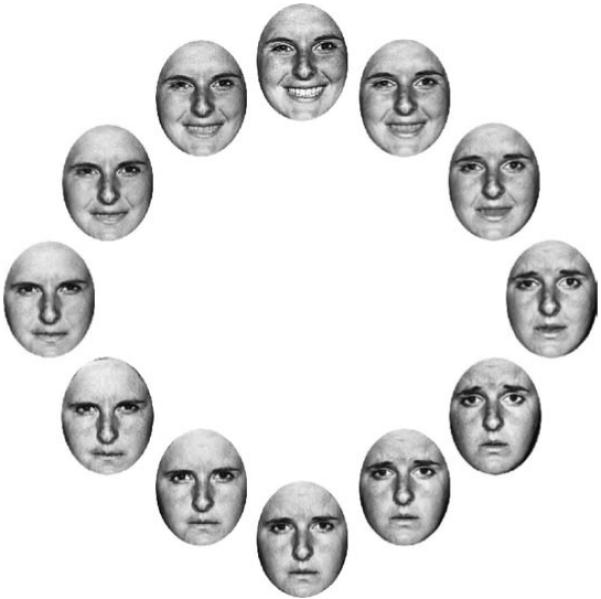
Stimuli in Experiment 3. A set of faces was morphed from happy to sad to angry and back to happy again to create a “circle” of facial expression. After viewing a sequence of faces (similar to Experiment 2, see methods in Experiment 3 for details), observers saw a single test face they adjusted to match the mean expression of the previously displayed set.
Method
Participants
Four individuals (three women, mean age 22.5 yrs) affiliated with the University of California, Davis participated in the experiment.
Stimuli
We created a range of emotional stimuli arranged on a virtual circle, morphing from happy to sad to angry and back to happy again (50 faces in each of the three morph sequences, for a total of 150 morphed faces; Figure 8). Stimuli were generated as described in Experiment 1. Unlike the stimuli from the previous experiments, there were no extreme facial expressions on the circular morph range because the endpoint for one expression became the starting point for another expression. Once again morphed faces were nominally separated from one another by emotional units and each face was one emotional unit away from the face preceding it.
Procedure
The procedure for Experiment 3 was similar to Experiment 2, with the exception that we used a method-of-adjustment task to assess mean precision. Observers viewed the sequentially presented set of faces (around an isoeccentric circle), followed by a randomly selected test face (the test face was any of the 150 faces, selected at random on each trial, presented centrally). Observers were instructed to use the mouse to scroll successively through any or all of the possible morphed faces (150 total morphed faces on the virtual circular range; the morph sequence repeated every 150 faces), and select the test face that appeared to be the average expression of the previously viewed set by depressing the left mouse button.
Multiple set sizes (4, 12 and 20) were tested in randomly ordered blocks. For the first part of Experiment 3, only one temporal frequency (14.2 Hz, 35 ms per face, 50% duty cycle) was tested. Conditions were blocked, such that observers viewed one set size per run. Each run had 240 trials, and observers performed 6 runs for a total of 1440 trials.
For the second part of Experiment 3, we modified the temporal parameters to give each set size condition equivalent overall exposure time. We adjusted the total viewing time of all faces in set sizes 4 and 12 to equal the total viewing time of all faces in set size 20 (i.e. total face viewing time of 700 ms for all set sizes). Therefore, the temporal frequency between any set size condition differed (ISI equal to face duration, constant 50% duty cycle), but the overall set duration was equated. Individual face durations were set to 175 ms and 58 ms for set sizes 4 and 12, respectively. For this experiment, observers performed 4 runs of 240 trials each, for a total of 960 trials. We did not rerun observers on the set size 20 condition because the parameters were identical to the first part of Experiment 3 above.
Although observers were able to perceive the average facial expression of four faces presented at 2.65 degrees eccentricity in the previous experiments, observers might have employed a strategy of attending to a sub region of the display. For example, observers may have attended to the area around the first face in the set rather than the whole display. Such a strategy would lead to denser sampling for larger set sizes. To equate the probability of a face occurring in any given region (or the average distance of one face from another in the set), we restricted the spatial window in which faces could appear. For set size four, faces appeared within a randomly chosen window of 72 degrees. For set size 12, faces appeared within a randomly chosen window of 216 degrees. For set size 20, faces appeared anywhere on the virtual isoeccentric circle. This control ensured that the average distance among all set faces was equated across all set sizes.
Results and discussion
In Experiment 3, observers were asked to adjust the test face to the mean of each set. This method gives a direct assessment of the precision with which observers perceived the average facial expression in a sequence of faces. Figure 9A shows the response (error) distribution for one representative observer. Plotted is the proportion of trials the observer selected a face n units away from the actual set mean. We fit a Von Mises curve to the response distribution to concretely characterize observer performance. The Von Mises is a circular Gaussian; given our circle of emotions, this is the appropriate distribution to use. The Von Mises equation was formalized as , where (a) was the location of the peak (i.e. where along the circle did the points cluster), and (k) was the concentration (i.e. inversely related to standard deviation, so the larger the number, the more concentrated the distribution). We used the standard deviation of the curve (derived from k) as an estimate of the precision with which observers represented the set mean—the smaller the standard deviation, the more precise the representation. Observers could precisely adjust to the mean expression of a set of sequentially presented faces, indicated by the small standard deviations of the Von Mises curves (see Figure 9A for an example curve). Additionally, the a parameter was not significantly different from 0 (i.e. the mean) in 3 out of 4 of the observers (TH had a slight bias, M = −3.61, t(4) = 10.71, p < 0.001), suggesting that they were adjusting the test face to the mean expression of the set and not some other point on the distribution.
Figure 9.

Experiment 3 results. (A) One representative participant’s adjustment curve. Depicted is the proportion of times this observer selected a face n units from the mean (shown here as 0). A Von Mises curve was fit to the data, and the standard deviation of the curve calculated. The smaller the standard deviation is, the narrower the distribution and the more precise the mean representation. (B) Standard deviation of the Von Mises distribution, calculated separately for each observer and then averaged. The solid line indicates Von Mises standard deviation as a function of set size, when temporal frequency was fixed (14.2 Hz for each set size; bigger set sizes mean longer overall set durations; see legend for specific set durations). The dashed line indicates the same, except that overall set duration was fixed (i.e. different temporal frequencies for each set size). The results reveal that sensitivity to average facial expression was fairly constant when overall set duration was equated (triangle symbols).
The results of the previous experiments revealed that observers were better able to perceive average expression when there were more faces in the set. Figure 9B supports this trend, showing that as set size increases, standard deviation tends to decrease. This hints at an increase in precision with larger set sizes. However, the one-way ANOVA revealed that this trend was not significant, F(2, 9) = 1.86, p = 0.21. If there is any improvement in sensitivity to the average facial expression with larger set sizes, this is unlikely to be due to the higher probability of a face occurring in a particular location, because we controlled the probability of a face occurring within a given area (equating average separation among faces in all sets). Therefore, our results cannot be attributed to larger set sizes containing more information in a specific region of the screen than smaller set sizes.
As mentioned above, set size and set duration were confounded in the first experiment. Is the slight improvement in precision a function of the number of items in the set, or the overall set duration? In the second part of Experiment 3, we addressed this by equating the overall exposure time for each set size. Figure 9B shows that when total exposure duration was equated, sensitivity to average facial expression was flat (i.e., a non-significant difference in sensitivity to different set sizes when duration was equated; F(2,9) = 0.16, p = 0.85). This suggests that overall set duration was a more important factor than the number of faces presented. Consistent with Figure 7C, increasing overall set duration seemed to improve mean representation precision. This is not to say that different set sizes are all processed in the same manner. It is conceivable that observers could extract more information from the multiple viewings of the faces in a larger set. However, any such effect appears to be trumped by the effect of overall set duration.
General discussion
The experiments here reveal that when faces varying in expression are presented over time, what is perceived is an average expression. Ensemble information about facial expression is therefore integrated over time. Summary representation over time is robust even at high temporal frequencies, and operates on large set sizes. Overall, there seems to be a benefit of longer exposure to the set, with an integration time constant of approximately 800 ms.
It has been previously established that a mean expression may be derived from a crowd of faces distributed over space (Haberman & Whitney, 2007, 2009). However, a crowd of heterogeneous faces is not the only example in which a summary representation would be useful. An individual’s expression is fluid and dynamic. These changes in expression provide a substantial body of information that an observer must efficiently represent over time. Temporal integration of the average expression provides one plausible mechanism to accomplish this.
Face processing is a slow and serial process (Brown, Huey, & Findlay, 1997; Esteves & Ohman, 1993; Leppanen & Hietanen, 2004; Nothdurft, 1993), but facial expression is dynamic and fluid. How does our visual system cope with this rapid change, particularly given our sparse representation of the visual world (Luck & Vogel, 1997; Potter, 1976; Rensink et al., 1997; Simons & Levin, 1998)? One possibility is that the visual system maintains a running average assessment of expression, rather than discrete moment-to-moment representations. Such a mechanism could cope with the limits of the visual system by providing an ongoing summary. Additionally, averaging over time might assist in deviance detection (e.g., an important and sudden change in facial expression). Computationally speaking, it may be easier to detect ‘pop-out’ in virtue of the fact that the visual system derives a summary statistic (Cavanagh, 2001). Thus, when the average facial expression over time is one of relative neutrality, a sudden expression of surprise is easy to detect.
The efficiency with which observers integrate the mean expression over time (approximately 800 ms) is comparable to the time it takes to discriminate biological motion (Neri et al., 1998). This is surprisingly fast given the complexity of face processing; research suggests that searching for a particular face in a display can take between 70 and 150 ms per face (Nothdurft, 1994; Tong & Nakayama, 1999). In our experiments, observers accurately derived a mean when viewing 20 faces at over 21 Hz, a speed that exceeds attentional dwell time (Duncan et al., 1994; Wolfe, 2003) and is beyond the limits of serial attention (Verstraten et al., 2000). We are not claiming that observers recognized the expression of every face in a sequence; indeed, Experiment 1A confirmed that observers have very little information about the set members. Rather, we argue that observers integrated the individual expressions into a single, summary representation.
Besides being fast integrators, observers were remarkably precise in their representation of the mean expression. We compared performance on homogeneous discrimination (viewing sets of identical faces) and heterogeneous mean discrimination (viewing sets of multiple faces varying in expression), and found observers were equally good on both tasks. This reveals an unexpectedly precise summary representation, and is consistent with literature revealing similar precision in the spatial domain (Ariely, 2001; Chong & Treisman, 2003; Haberman & Whitney, 2007, 2009).
Haberman and Whitney showed a small cost in summary representation precision as a function of decreasing set duration in crowds presented over space (Haberman & Whitney, 2009), and the results of the experiments reported here are consistent. There was an improvement in perception of average facial expression with increasing set duration.
The temporal integration of mean expression is not an artifact of apparent motion cues or masking effects. Even when the faces were presented in the periphery, observers were able to represent the mean expression of the set. However, there was a general decrement in performance on both homogeneous and heterogeneous discrimination tasks. This likely reflects an increase in the overall level of difficulty of the task, and not a breakdown of summary representation.
Finally, summary representation more generally is a fast and flexible perceptual phenomenon. This is not the same as a prototype effect (Posner & Keele, 1968; Solso & Mccarthy, 1981), whereby sensitivities to subtle, statistical properties are built up over an extended period. Observers were able to derive a new mean on every trial (see also the supplemental materials in Haberman & Whitney, 2007), and did not require the extended exposure necessary to develop a prototype effect.
Conclusions
Here, we showed that the visual system averages facial expression over time. The time course of this process is slower than for low-level features and motion, but can still operate when faces are presented at over 20 Hz, and even when the faces are located in unpredictable locations in the visual periphery. The results reveal a powerful mechanism that flexibly integrates facial expression, one that could support our perception of dynamic faces under natural viewing conditions.
Acknowledgments
This work was supported by grants from NIH (018216) and NSF (0748689).
Footnotes
Commercial relationships: none.
Contributor Information
Jason Haberman, The Department of Psychology, and The Center for Mind and Brain, University of California, Davis, California, USA.
Tom Harp, The Department of Psychology, and The Center for Mind and Brain, University of California, Davis, California, USA.
David Whitney, The Department of Psychology, and The Center for Mind and Brain, University of California, Davis, California, USA.
References
- Albrecht A, Scholl B. Perceptually averaging in a continuous world: Extracting statistical summary representations over times. Psychological Science. doi: 10.1177/0956797610363543. in press. [DOI] [PubMed] [Google Scholar]
- Alvarez GA, Oliva A. The representation of simple ensemble visual features outside the focus of attention. Psychological Science. 2008;19:392–398. doi: 10.1111/j.1467-9280.2008.02098.x. [DOI] [PMC free article] [PubMed] [Google Scholar]
- Ariely D. Seeing sets: Representation by statistical properties. Psychological Science. 2001;12:157–162. doi: 10.1111/1467-9280.00327. [DOI] [PubMed] [Google Scholar]
- Beck J. Textural segmentation, 2nd-order statistics, and textural elements. Biological Cybernetics. 1983;48:125–130. doi: 10.1007/BF00344396. [DOI] [PubMed] [Google Scholar]
- Blake R, Lee SH. The role of temporal structure in human vision. Behavioural Cognitive Neuroscience Review. 2005;4:21–42. doi: 10.1177/1534582305276839. [DOI] [PubMed] [Google Scholar]
- Blake R, Shiffrar M. Perception of human motion. Annual Review of Psychology. 2007;58:47–73. doi: 10.1146/annurev.psych.57.102904.190152. [DOI] [PubMed] [Google Scholar]
- Brown V, Huey D, Findlay JM. Face detection in peripheral vision: Do faces pop out? Perception. 1997;26:1555–1570. doi: 10.1068/p261555. [DOI] [PubMed] [Google Scholar]
- Burr D, Ross J. A visual sense of number. Current Biology. 2008;18:425–428. doi: 10.1016/j.cub.2008.02.052. [DOI] [PubMed] [Google Scholar]
- Cavanagh P. Seeing the forest but not the trees. Nature Neuroscience. 2001;4:673–674. doi: 10.1038/89436. [DOI] [PubMed] [Google Scholar]
- Celebrini S, Newsome WT. Neuronal and psychophysical sensitivity to motion signals in extrastriate area Mst of the Macaque Monkey. Journal of Neuroscience. 1994;14:4109–4124. doi: 10.1523/JNEUROSCI.14-07-04109.1994. [DOI] [PMC free article] [PubMed] [Google Scholar]
- Chong SC, Treisman A. Representation of statistical properties. Vision Research. 2003;43:393–404. doi: 10.1016/s0042-6989(02)00596-5. [DOI] [PubMed] [Google Scholar]
- Chong SC, Treisman A. Statistical processing: Computing the average size in perceptual groups. Vision Research. 2005;45:891–900. doi: 10.1016/j.visres.2004.10.004. [DOI] [PubMed] [Google Scholar]
- de Fockert J, Wolfenstein C. Rapid extraction of mean identity from sets of faces. Quarterly Journal of Experimental Psychology. 2009;62:1716–1722. doi: 10.1080/17470210902811249. [DOI] [PubMed] [Google Scholar]
- Duncan J, Ward R, Shapiro K. Direct measurement of attentional dwell time in human vision. Nature. 1994;369:313–315. doi: 10.1038/369313a0. [DOI] [PubMed] [Google Scholar]
- Esteves F, Ohman A. Masking the face: Recognition of emotional facial expressions as a function of the parameters of backward-masking. Scandinavian Journal of Psychology. 1993;34:1–18. doi: 10.1111/j.1467-9450.1993.tb01096.x. [DOI] [PubMed] [Google Scholar]
- Ekman P, Friesen WV. Pictures of facial affect. Consulting Psychologists Press; Palo Alto, CA: 1976. [Google Scholar]
- Festa EK, Welch L. Recruitment mechanisms in speed and fine-direction discrimination tasks. Vision Research. 1997;37:3129–3143. doi: 10.1016/s0042-6989(97)00118-1. [DOI] [PubMed] [Google Scholar]
- Haberman J, Whitney D. Rapid extraction of mean emotion and gender from sets of faces. Current Biology. 2007;17:R751–R753. doi: 10.1016/j.cub.2007.06.039. [DOI] [PMC free article] [PubMed] [Google Scholar]
- Haberman J, Whitney D. Seeing the mean: Ensemble coding for sets of faces. Journal of Experimental Psychology: Human Perception and Performance. 2009;35:718–734. doi: 10.1037/a0013899. [DOI] [PMC free article] [PubMed] [Google Scholar]
- Kourtzi Z, Krekelberg B, van Wezel RJA. Linking form and motion in the primate brain. Trends in Cognitive Sciences. 2008;12:230–236. doi: 10.1016/j.tics.2008.02.013. [DOI] [PubMed] [Google Scholar]
- Landy M, Graham N. Visual perception of texture. In: Chalupa LM, Werner JS, editors. The visual neurosciences. Vol. 2. MIT Press; Cambridge, Mass: 2004. pp. 1106–1118. [Google Scholar]
- Leppanen JM, Hietanen JK. Positive facial expressions are recognized faster than negative facial expressions, but why? Psychological Research-Psychologische Forschung. 2004;69:22–29. doi: 10.1007/s00426-003-0157-2. [DOI] [PubMed] [Google Scholar]
- Louie EG, Bressler DW, Whitney D. Holistic crowding: Selective interference between configural representations of faces in crowded scenes. Journal of Vision. 2007;7(2):24, 1–11. doi: 10.1167/7.2.24. http://journalofvision.org/7/2/24/, doi:10.1167/7.2.24. [DOI] [PMC free article] [PubMed] [Google Scholar]
- Luck SJ, Vogel EK. The capacity of visual working memory for features and conjunctions. Nature. 1997;390:279–281. doi: 10.1038/36846. [DOI] [PubMed] [Google Scholar]
- Martelli M, Majaj NJ, Pelli DG. Are faces processed like words? A diagnostic test for recognition by parts. Journal of Vision. 2005;5(1):6, 58–70. doi: 10.1167/5.1.6. http://journalofvision.org/5/1/6/, doi:10.1167/5.1.6. [DOI] [PubMed] [Google Scholar]
- Mckee SP, Welch L. Sequential recruitment in the discrimination of velocity. Journal of the Optical Society of America A, Optics Image Science and Vision. 1985;2:243–251. doi: 10.1364/josaa.2.000243. [DOI] [PubMed] [Google Scholar]
- McKone E. Isolating the special component of face recognition: Peripheral identification and a Mooney face. Journal of Experimental Psychology, Learning Memory and Cognition. 2004;30:181–197. doi: 10.1037/0278-7393.30.1.181. [DOI] [PubMed] [Google Scholar]
- Neisser U. Cognitive psychology. Appleton-Century-Crofts; New York: 1967. [Google Scholar]
- Neri P, Morrone MC, Burr DC. Seeing biological motion. Nature. 1998;395:894–896. doi: 10.1038/27661. [DOI] [PubMed] [Google Scholar]
- Nothdurft HC. Faces and facial expressions do not pop out. Perception. 1993;22:1287–1298. doi: 10.1068/p221287. [DOI] [PubMed] [Google Scholar]
- Nothdurft HC. Common properties of visual segmentation. Higher-Order Processing in the Visual System. 1994;184:245–259. doi: 10.1002/9780470514610.ch13. [DOI] [PubMed] [Google Scholar]
- Parkes L, Lund J, Angelucci A, Solomon JA, Morgan M. Compulsory averaging of crowded orientation signals in human vision. Nature Neuroscience. 2001;4:739–744. doi: 10.1038/89532. [DOI] [PubMed] [Google Scholar]
- Posner MI, Keele SW. On genesis of abstract ideas. Journal of Experimental Psychology. 1968;77:353–363. doi: 10.1037/h0025953. [DOI] [PubMed] [Google Scholar]
- Potter MC. Short-term conceptual memory for pictures. Journal of Experimental Psychology, Human Learning and Memory. 1976;2:509–522. [PubMed] [Google Scholar]
- Rensink RA, O’Regan JK, Clark JJ. To see or not to see: The need for attention to perceive changes in scenes. Psychological Science. 1997;8:368–373. [Google Scholar]
- Russell JA. A circumplex model of affect. Journal of Personality and Social Psychology. 1980;39:1161–1178. [Google Scholar]
- Simons DJ, Levin DT. Failure to detect changes to people during a real-world interaction. Psychonomic Bulletin & Review. 1998;5:644–649. [Google Scholar]
- Snowden RJ, Braddick OJ. The combination of motion signals over time. Vision Research. 1989;29:1621–1630. doi: 10.1016/0042-6989(89)90143-0. [DOI] [PubMed] [Google Scholar]
- Solso RL, Mccarthy JE. Prototype formation of faces: A case of pseudo-memory. British Journal of Psychology. 1981;72:499–503. [Google Scholar]
- Sweeny TD, Grabowecky M, Paller K, Suzuki S. Within-hemifield perceptual averaging of facial expression s predicted by neural averaging. Journal of Vision. 2009;9(3):2, 1–11. doi: 10.1167/9.3.2. http://journalofvision.org/9/3/2/, doi:10.1167/9.3.2. [DOI] [PMC free article] [PubMed] [Google Scholar]
- Tong F, Nakayama K. Robust representations for faces: Evidence from visual search. Journal of Experimental Psychology, Human Perception and Performance. 1999;25:1016–1035. doi: 10.1037//0096-1523.25.4.1016. [DOI] [PubMed] [Google Scholar]
- Verstraten FAJ, Cavanagh P, Labianca AT. Limits of attentive tracking reveal temporal properties of attention. Vision Research. 2000;40:3651–3664. doi: 10.1016/s0042-6989(00)00213-3. [DOI] [PubMed] [Google Scholar]
- Watamaniuk SNJ, Duchon A. The human visual-system averages speed information. Vision Research. 1992;32:931–941. doi: 10.1016/0042-6989(92)90036-i. [DOI] [PubMed] [Google Scholar]
- Watamaniuk SNJ, Mckee SP, Grzywacz NM. Detecting a trajectory embedded in randomdirection motion noise. Vision Research. 1994;35:65–77. doi: 10.1016/0042-6989(94)e0047-o. [DOI] [PubMed] [Google Scholar]
- Wertheimer M. Untersuchungen zur Lehre von der Gestalt. Psychologische Forschung. 1923;4:301–350. [Google Scholar]
- Wichmann FA, Hill NJ. The psychometric function: I. Fitting, sampling, and goodness of fit. Perception & Psychophysics. 2001a;63:1293–1313. doi: 10.3758/bf03194544. [DOI] [PubMed] [Google Scholar]
- Wichmann FA, Hill NJ. The psychometric function: II. Bootstrap-based confidence intervals and sampling. Perception & Psychophysics. 2001b;63:1314–1329. doi: 10.3758/bf03194545. [DOI] [PubMed] [Google Scholar]
- Williams DW, Sekuler R. Coherent global motion percepts from stochastic local motions. Vision Research. 1984;24:55–62. doi: 10.1016/0042-6989(84)90144-5. [DOI] [PubMed] [Google Scholar]
- Wolfe JM. Moving towards solutions to some enduring controversies in visual search. Trends in Cognitive Sciences. 2003;7:70–76. doi: 10.1016/s1364-6613(02)00024-4. [DOI] [PubMed] [Google Scholar]