

Abstract
Autophagy is a survival mechanism activated in response to metabolic stress. In normal tissues autophagy plays a major role in energy homeostasis through catabolic self-digestion of damaged proteins and organelles. Contrary to its survival function, autophagy defects are implicated in tumorigenesis suggesting that autophagy is a tumor suppression mechanism. Although the exact mechanism of this tumor suppressor function is not known, it likely involves mitigation of cellular damage leading to chromosomal instability. The complex role of functional autophagy in tumors calls for model systems that allow the assessment of autophagy status, stress management and the impact on oncogenesis both in vitro as well as in vivo. We developed model systems that involve generation of genetically defined, isogenic and immortal epithelial cells from different tissue types that are applicable to both wild-type and mutant mice. This permits the study of tissue- as well as gene-specific tumor promoting functions. We successfully employed this strategy to generate isogenic, immortal epithelial cell lines from wild-type and mutant mice deficient in essential autophagy genes such as beclin 1 (beclin 1+/-) and atg5 (atg 5-/-). As these cell lines are amenable to further genetic manipulation, they allowed us to generate cell lines with apoptosis defects and stable expression of the autophagy marker EGFP-LC3 that facilitate in vitro and in vivo assessment of stress-mediated autophagy induction. We applied this model system to directly monitor autophagy in cells and 3D-morphogenesis in vitro as well as in tumor allografts in vivo. Using this model system we demonstrated that autophagy is a survival response in solid tumors that co-localizes with hypoxic regions, allowing tolerance to metabolic stress. Furthermore, our studies have established that autophagy also protects tumor cells from genome damage and limits cell death and inflammation as possible means to tumor suppression. Additionally these cell lines provide an efficient way to perform biochemical analyses, and high throughput screening for modulators of autophagy for potential use in cancer therapy and prevention.
1. Introduction
Hypoxia is a common occurrence in human solid tumors. Hypoxic regions, largely due to inefficient vasculature and rapid tumor growth, may influence tumor progression and negatively affect clinical outcome, as they are implicated in resistance to therapy (Barlogie et al., 1982; Folkman, 2003). Metabolic stress often triggers apoptotic cell death that results in cancer cell elimination, and hence mutations in the apoptotic pathways are common in human cancers (Nelson et al., 2004). For cancer cells to better survive metabolic stress, this apoptotic resistance must also be accompanied by activation of alternative pathways supporting cell survival under stress. One such mechanism is the up-regulation of the transcription factor hypoxia-inducible factor 1-α (Hif1-α) to promote metabolic adaptation and angiogenesis (Dang et al., 2008; Semenza, 2003). Another mechanism involves activation of the catabolic pathway of autophagy to facilitate cell survival (Mathew et al., 2007a). Elucidating the molecular intricacies of the pathways will hopefully lead to the development of targeted therapeutic strategies, and thus may have profound implications for cancer therapy.
Autophagy (i.e., macroautophagy) is a response to stress and starvation whereby cellular organelles and proteins are sequestered and targeted for lysosomal degradation as an alternate energy source (Levine and Kroemer, 2008). The role of autophagy as a survival mechanism under metabolic stress is well documented (Mizushima, 2007). Immortalized baby mouse kidney epithelial (iBMK) cells rendered autophagy-deficient by allelic loss of beclin 1 or atg5 deficiency display increased susceptibility to metabolic stress (Degenhardt et al., 2006; Mathew et al., 2007b). Similarly, autophagy mitigates metabolic stress in immortalized mouse mammary epithelial cells (iMMECs) (Karantza-Wadsworth et al., 2007) and promotes survival of immortalized, nontumorigenic human mammary epithelial cell lines (MCF10A) and primary human mammary cells during extracellular matrix detachment (anoikis) (Debnath, 2008; Fung et al., 2008). In apoptosis-competent cells, autophagy delays apoptotic death under metabolic stress, whereas apoptosis defects unmask autophagy-mediated cell survival (Mathew et al., 2007a). Moreover, atg5−/− mouse embryonic fibroblasts (MEFs) show signs of ATP depletion, and atg5−/− mice do not survive neonatal starvation, suggesting that autophagy promotes survival under metabolic stress during mammalian development (Kuma et al., 2004; Lum et al., 2005). Importantly, in solid tumors autophagy localizes to regions of metabolic stress, suggesting that it may be exploited by cancer cells for survival (Degenhardt et al., 2006; Karantza-Wadsworth et al., 2007; Mathew et al., 2007b). Thus, the functional status of autophagy is an important determinant of tumor cell response to metabolic stress.
Although autophagy induction under metabolic stress is well established as a survival strategy, interactions between metabolic stress and defective autophagy are more complex. Intuitively contradictory to the survival function of autophagy under metabolic stress, defects in autophagy are associated with increased tumorigenicity in mice as well as humans. Allelic loss of beclin 1 is frequently observed in human breast, ovarian, and prostate cancers (Aita et al., 1999; Liang et al., 1999), and beclin 1+/− and atg4C−/− mice are tumor-prone, suggesting that autophagy is a tumor suppression mechanism (Marino et al., 2007). Moreover, growth factor– and nutrient-driven oncogenic pathways, such as the PI3-kinase pathway, inhibit autophagy, whereas inhibitors of this pathway, such as the tumor suppressor protein PTEN, activate autophagy (Arico et al., 2001). Although a clear understanding of autophagy-mediated tumor suppression is only beginning to emerge, one of the likely mechanisms by which autophagy inhibits tumorigenesis is suppression of necrotic cell death (Degenhardt et al., 2006). Impairment of autophagy by monoallelic deletion of beclin 1, RNAi-mediated knockdown of beclin 1 or atg5, or constitutive activation of Akt, induces necrotic cell death when apoptosis is blocked (Degenhardt et al., 2006). In tumors in vivo, this necrosis is associated with inflammation, activation of the cytokine-responsive NF-kB pathway and tumor progression (Degenhardt et al., 2006). Remarkably, autophagy defects in mouse liver cause excessive hepatocyte cell death, steatohepatitis and hepatocellular carcinoma (HCC) suggesting that support of cell survival and suppression of inflammation may be important autophagy functions in normal tissues, as well as tumors (Komatsu et al., 2007).
Another insight into the role of autophagy in tumor suppression came from the discovery that immortalized mouse epithelial cell lines with autophagy defects show signs of genome damage, which is exacerbated under metabolic stress. iBMK and iMMEC cells rendered autophagy-defective by beclin 1 monoallelic loss or atg5 deletion display activation of the DNA damage response, gene amplification, and accelerated progression to aneuploidy (Karantza-Wadsworth et al., 2007; Mathew et al., 2007a,b). These phenotypes are accentuated in an apoptosis-defective background, together suggesting that autophagy functions to limit chromosomal instability, preferentially manifested in cells with checkpoint and apoptosis defects. Thus, autophagy-mediated housekeeping and mitigation of genome damage play important roles in the cellular response to metabolic stress and in tumorigenesis.
However, the exact mechanism by which autophagy suppresses tumorigenesis is not known. To further investigate the role of metabolic stress–induced autophagy in tumorigenesis, we developed an in vitro metabolic stress assay that combines hypoxia (defined gas mixture composed of 1% O2, 5% CO2, and 94% N2) with glucose deprivation, thus mimicking metabolic stress in the tumor microenvironment in vivo (Nelson et al., 2004). Immortalized epithelial cell model systems, such as iBMK cells (Mathew et al., 2008) and iMMECs (Karantza-Wadsworth and White, 2008), have several advantages over conventional MEF or human cancer cell lines widely used to model human cancer (Mathew et al., 2008). Being epithelial in origin, they provide a superior representation of human tumor cell physiology compared to MEFs, can be generated from different tissues from any mouse that survives to birth (for isolation of kidney, prostate, liver, and lung tissue) and to young adulthood (for mammary gland isolation), are immortalized by well-defined genetic events, are amenable to additional genetic manipulation, and can be used for the generation of tumor allografts. Immortalized epithelial cell lines derived from wild-type and mutant mice extend the utility of mouse models by enabling biochemical and cell biological analysis. Stable expression of fluorescent fusion proteins, fluorescent or luminescent reporter- and cell tracking-constructs, or RNAi-mediated knockdown of specific proteins extend the analyses to the study of the role of compound mutations in tumorigenesis. These cell models together with our in vitro metabolic stress assay have been successfully used to characterize epithelial cell response to metabolic stress in vitro and in vivo (Degenhardt et al., 2006; Karantza-Wadsworth et al., 2007; Karp et al., 2008; Mathew et al., 2007b; Nelson et al., 2004; Shimazu et al., 2007).
2. Mouse Epithelial Cell Models for Studying the Role of Autophagy in Cancer
Autophagy is a highly conserved process tightly regulated by a set of essential genes such as atg5, atg7, and beclin 1, which produce a profound autophagy-defective phenotype when allelically lost (atg5−/−, atg7−/−, or beclin 1+/−). With the genetic landscape of autophagy regulation quickly emerging, several transgenic mice specifically targeting autophagy are currently available for tumorigenicity studies in vivo. Primary epithelial cells from wild-type, atg5−/−, atg7−/−, and beclin 1+/− mice can be immortalized through expression of the adenoviral protein E1A and a dominant negative p53 mutant (p53DD) to generate isogenic epithelial cell lines that are suitable for studying the role of autophagy in cancer (Mathew et al., 2008). We have generated iBMK cells and iMMECs that are wild-type or autophagy-deficient (beclin 1+/−, atg5−/−, atg7−/−) with and without a functional apoptotic pathway (Degenhardt et al., 2006; Karantza-Wadsworth et al., 2007; Mathew et al., 2007b, 2008). These cell lines have been successfully employed to demonstrate that their autophagy-defective phenotype is independent of the mode of autophagy impairment and the tissue of origin (Degenhardt et al., 2006; Karantza-Wadsworth et al., 2007; Mathew et al., 2007b).
2.1. Generation of stable iBMK and iMMEC cell lines to monitor autophagy in vitro and in vivo
The process of autophagy is characterized by the formation of isolation membranes (phagophores) that mature into double-membrane vesicles called autophagosomes (Levine and Kroemer, 2008). Under conditions of metabolic stress, the product of the essential autophagy gene LC3/atg8 is proteolytically cleaved, lipidated, and translocated to the forming autophagosomes, as demonstrated by the redistribution of the EGFP-LC3 fusion protein from a diffuse cytoplasmic localization under normal conditions to discrete, perinuclear puncta under metabolic stress (Fig. 4.1) (Klionsky, 2007; Mizushima, 2004). Similar induction of LC3 translocation occurs under growth factor deprivation. This process is impaired by deficiencies in essential autophagy genes, as indicated by the failure to form EGFP-LC3 puncta on monoallellic loss of beclin 1 (Fig. 4.1) or complete atg5 deficiency (Mizushima, 2004).
Figure 4.1.
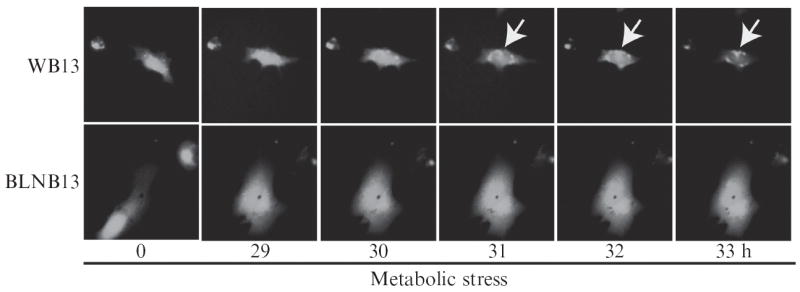
Live cell imaging demonstrates the process of autophagy in living cells. The product of the essential autophagy gene LC3 becomes posttranslationally modified and translocated to autophagosomes during autophagy induction, as indicated by the transition from diffuse cytoplasmic to punctate perinuclear localization. The process is impaired by heterozygosity in the essential autophagy gene beclin 1, as indicated by failure of LC3 translocation. To capture the process of autophagy in living cells, apoptosis-defective beclin 1+/+ or beclin 1+/− iBMK cells stably expressing EGFP-LC3 are subjected to metabolic stress and observed by Computerized Fluorescence Video Time-Lapse Microscopy for 33 h. Autophagy is induced (arrow) in a representative beclin 1+/+ (WB13) cell (top row), but not in a representative beclin 1+/− (BLNB13) cell (bottom row) under metabolic stress.
In cells competent for apoptosis and autophagy, the predominant phenotype under conditions of metabolic stress is apoptosis, the defects in which induce prolonged autophagy-supported cell survival. Thus, the assessment of autophagy under metabolic stress is facilitated in an apoptosis-defective background. To monitor autophagy induction under metabolic stress, we generated apoptosis-defective beclin 1+/+ and beclin 1+/− iBMK and iMMEC cells stably expressing the autophagy marker EGFP-LC3. These cell lines and their tumor allografts in nude mice allow in vitro and in vivo visualization and quantification of autophagy under a wide variety of experimental conditions (Karantza-Wadsworth and White, 2008; Mathew et al., 2008; Nelson et al., 2004).
2.1.1. Equipment and reagents
pEGFP-C1 (Clontech, 6084-1), pEGFP-C1-LC3 (Mizushima, 2004), pCDNA3.1 zeo (Invitrogen, V86020) mammalian expression vectors
Geneticin and zeocin (Invitrogen, 11811 and R-250)
iBMK regular growth medium: DMEM, 10% fetal bovine serum (FBS), 1% Pen/Strep (Invitrogen, 15140)
iMMEC regular growth medium: F12 (Invitrogen, 11765054), 10% FBS, 5 μg/ml insulin (Sigma, I0516), 1 μg/ml hydrocortisone (Sigma, H0888), 5 ng/ml EGF (Sigma, E4127), 1% Pen/Strep
Electroporation system (Bio-Rad Gene Pulser II)
Freezing medium: 92% FBS, 8% tissue culture grade DMSO (Sigma, D2650)
2.1.2. Generation of cell lines stably expressing EGFP-LC3
Primary baby mouse kidney epithelial (BMK) cells are isolated from wild-type, bax−/−/bak−/−, beclin 1+/−, and atg5−/− mice and immortalized by E1A and a dominant negative p53 mutant (p53DD) to generate iBMK cells. Apoptosis-competent iBMK cells are then engineered to express either vector control (pCEP4) or Bcl-2 (pCEP-Bcl-2) as described previously (Degenhardt et al., 2006; Mathew et al., 2007b). Mouse mammary epithelial cells (MMECs) are isolated from 6–8-week-old female beclin 1+/+ and beclin 1+/− mice, immortalized by E1A and p53DD (to generate iMMECs) and rendered apoptosis-defective by stable Bcl-2 expression, as previously described (Karantza-Wadsworth et al., 2007). The detailed protocols for generating iBMK cells and iMMECs are available in an earlier volume of Methods in Enzymology (Karantza-Wadsworth and White, 2008; Mathew et al., 2008).
iBMK cells are further engineered to express EGFP-LC3 as described subsequently:
Two 1.5-ml sterile microcentrifuge tubes are labeled and 10 μg of pEGFP-C1 is transferred into one and 10 μg of pEGFP-C1-LC3 into the other tube.
2 × 10⁶ cells are plated per 10-cm plate in duplicate and allowed to grow in normal tissue culture conditions (38.5 °C and 8.5% CO2). When 80% confluency is reached, cells from each plate are harvested separately by trypsinization using 0.05% trypsin-EDTA (Invitrogen, 25300), resuspended in 10 ml of tissue culture medium, and centrifuged at 1500 rpm (approximately 300×g).
Each cell pellet is resuspended in 500 μl of phosphate buffered saline (PBS). 250 μl are transferred into a 1.5-ml microcentrifuge tube containing 10 μg of pEGFP-C1 and the other 250 μl are transferred into a microcentrifuge tube containing 10 μg of pEGFP-C1-LC3 plasmid.
Each cell suspension is mixed by gentle pipetting, transferred to a 0.4-cm electroporation cuvette (Bio-Rad, 1652088), and pulsed at 0.22 V and 950 μF.
Transfected cells are allowed to sit for 5 min, resuspended in 12 ml of regular growth medium, dispensed into 1-, 2-, and 3-ml aliquots and plated in 10-cm plates in duplicate.
48 h later, the medium is replaced by geneticin (G418)-containing regular growth medium, and G418-resistant colonies arise in 7–10 days. G418 is used at 2 mg/ml for bax−/−/bak−/−-derived cell lines, and at 1 mg/ml for wild-type and Bcl-2-expressing cell lines. Selection medium is changed every 3 days.
Typically, up to 12 independent (well-isolated and from different plates) G418-resistant colonies per genotype are isolated and expanded as described in section 2.1.3.
iMMECs are further engineered to express EGFP-LC3 as described subsequently:
Apoptosis-competent iMMECs are engineered to express EGFP-LC3 as described earlier for iBMK cells. The only protocol changes involve use of the iMMEC-specific medium for cell growth and a much lower geneticin concentration (300 μg/ml) for selection.
Bcl-2 expressing iMMECs, which are already seleand grown in G418-contaning medium (Karantza-Wadsworth and White, 2008), are cotransfected with pEGFP-C1-LC3 and pcDNA3.1zeo plasmids in a 10:1 ratio, followed by zeocin selection in the presence of geneticin (300 μg/ml). Zeocin is used at 100 μg/ml for 10–14 days. Independent G418- and zeo-double-resistant colonies are isolated and expanded to stable cell lines, as described subsequently.
2.1.3. Cloning, expansion, and preservation of cell lines
When colonies reach 0.6 cm to 0.8 cm in diameter, they are examined under an inverted fluorescence microscope, and well-separated green fluorescent colonies are marked on the bottom of the plates for ring cloning.
Cells are washed once with PBS, which is then gently aspirated. Sterile cloning rings (6 × 8 mm or 10 × 10 mm; Belco Biotechnology, 2090-00608 or 2090-01010) are placed over the marked colonies and held in place by autoclaved vacuum grease (VWR, 59344-055).
Cells are trypsinized with a small amount of 0.05% Trypsin-EDTA placed inside the cloning rings and transferred into 96-well plates. Individual clones are sequentially expanded into 24- and 12-well plates, then 6-cm and finally 10-cm plates. EGFP and EGFP-LC3 expression is tested by fluorescence microscopy and western blotting using anti-GFP antibody (BD Living Colors, 632381) at 1:6000 dilution.
For long-term storage, cells are trypsinized at 70% confluency (approximately 6 × 10⁶ cells/10-cm plate), resuspended in 2 ml of freezing medium per 10-cm plate, stored in a −70 °C freezer wrapped in paper towels overnight, and then cryopreserved in vapor phase nitrogen.
3. Protocols for Monitoring Autophagy in iBMK Cells and iMMECs In Vitro
A cell-based system that enables functional autophagy monitoring is important not only to better understand the role of autophagy in metabolic stress management and cancer progression but also to screen for autophagy modulators. Immortalized epithelial cells from wild-type and autophagy-deficient mice stably expressing EGFP-LC3 (Karantza-Wadsworth and White, 2008; Mathew et al., 2008) can be used for real-time observation of autophagy (see subsequently), as well as high-throughput screens for identifying novel autophagy inhibitors and stimulators.
3.1. Autophagy induction under metabolic stress as monitored by in vitro EGFP-LC3 assay
3.1.1. Reagents
Coverslips: Fisherbrand Coverglass (Fisher Scientific, 12-545-82-12CIR-1D)
- Metabolic stress assay medium
- iBMK cells: Glucose-free DMEM (Invitrogen, 11966), 10% FBS, 1% Pen/Strep
- iMMECs: Glucose-free DMEM, 10% FBS, 5 μg/ml insulin, 1 μg/ml hydrocortisone, 5 ng/ml EGF, 1% Pen/Strep
10% buffered formalin solution: (Formaldefresh; Fisher Scientific, SF94)
ProLong Gold antifade reagent (Molecular Probes, P36930)
3.1.2. In vitro metabolic stress assay
Ethanol-sterilized coverslips are aseptically placed in 10-cm plates. One plate per cell line per time point is used.
2 × 10⁶ cells engineered to stably express EGFP-LC3 are plated in each coverslip-containing plate and grown to 80% confluency.
At this point (usually 24 h later), regular growth medium is replaced with glucose-free medium (iBMK- or iMMEC-specific) and plates are placed in modular incubator chambers (Billups-Rothenberg; Model MIC-101), which are flushed with a gas mixture containing 1% O2, 5% CO2 and 94% N2 (GTS-Welco) for 5 min and placed at 37 °C for 1, 2, and 3 days to induce metabolic stress (Nelson et al., 2004). One chamber is used per time point to prevent reoxygenation upon chamber opening for sample collection. For longer than 24-h incubations, chambers are flushed with the same gas mixture for 5 min daily.
Chambers are opened at designated time-points and cover slips are collected.
3.1.3. Autophagy quantification by EGFP-LC3 translocation
Coverslips are fixed in 10% buffered formalin solution for 15 min at room temperature (RT), washed, and stored in PBS at 4 °C for up to 2 weeks.
Coverslips are rinsed with distilled water, mounted on glass slides with the antifade agent Prolong and imaged using a fluorescence microscope at 600X magnification.
EGFP-LC3 shows diffuse cytoplasmic distribution under normal conditions. Induction of autophagy is indicated by translocation of the EGFP-LC3 signal to discrete perinuclear puncta (autophagosomes). Cells expressing just GFP show no punctate staining under metabolic stress and are used as negative controls.
Autophagy is quantified as percent EGFP-LC3 translocation, determined as the fraction of green fluorescent cells that demonstrate punctate staining. Three independent experiments are performed (with at least 100 cells counted each time) and the mean values with standard deviation are presented.
3.2. Autophagy induction under metabolic stress as monitored by EM
3.2.1. Reagents
EM fixative: 4% paraformaldehyde and 2.5% glutaraldehyde in 0.1 M cacodylate buffer (Electron Microscopy Sciences, 11650)
3.2.2. Cell preparation
Cells are plated at 2 × 10⁶ cells per 10-cm plate and 24 h later are exposed to metabolic stress as described previously. At successive time points, cells are harvested by trypsinization, resuspended in 10 ml of culture medium, and centrifuged at 1500 rpm (approximately 300×g) for 5 min.
The cell pellet is washed, resuspended in 2 ml of PBS, transferred into 2 1.5-ml microcentrifuge tubes (1 ml of cell suspension per tube), and centrifuged at 3000 rpm (approximately 800×g) for 5 min.
The cell pellet is fixed by gentle addition of EM fixative (1 ml), taking care to avoid disturbing the pellet, and is stored at 4 °C overnight.
The cell pellet is processed for EM by standard procedures (e.g., see the chapter by Ylä-Anttila et al., in volume 452). Images are acquired at 4000–5000X magnification.
3.3. Protocols for monitoring autophagy and metabolic stress in three-dimensional morphogenesis
3.3.1. Reagents
Growth factor–reduced Matrigel (BD, 356231)
8-well RS glass slides (BD Falcon, 354108)
iMMEC regular growth medium (F12, 10% FBS, 5 μg/ml insulin, 1 μg/ml hydrocortisone, 5 ng/ml EGF, 1% Pen/Strep)
Hypoxyprobe-1 kit (Chemicon International, HP2-1000)
ProLong Gold antifade reagent
3.3.2. Monitoring metabolic stress in 3D-morphogenesis
A 3D-culture of EGFP-LC3-expressing iMMECs is performed according to previously published protocols (Debnath et al., 2003; Karantza-Wadsworth and White, 2008).
Spatial localization of metabolic stress in mammary acini is performed by hypoxyprobe (pimonidazole) immunohistochemistry and immunofluorescence using a hypoxyprobe kit (Fig. 4.2). Mammary acini generated by beclin 1+/+ and beclin 1+/− iMMECs expressing Bcl-2 are grown in Matrigel for 12 days and are then incubated with 200 μM hypoxyprobe in regular growth medium at 37 °C for 2 h. For immunohistochemistry, acini are fixed in 10% formalin, scraped from the glass slide with a razor blade, pelleted, embedded in paraffin, and sectioned. For immunofluorescence, acini are fixed and processed as previously described (Debnath et al., 2003; Karantza-Wadsworth and White, 2008).
Figure 4.2.
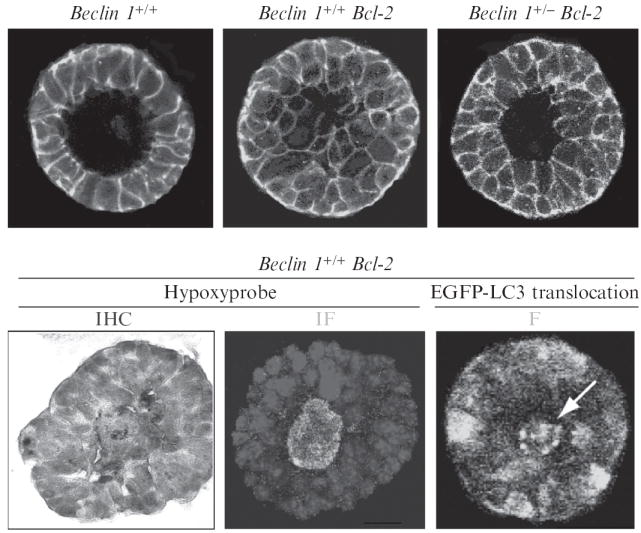
In 3D-morphogenesis, allelic loss of beclin 1 accelerates death of mammary epithelial cells in the acinar center, where metabolic stress and autophagy localize. Top panel: Apoptosis-competent beclin 1+/+ iMMECs form polarized acini that generate lumens via apoptosis (left). Defective apoptosis delays lumen formation (middle), whereas concurrent autophagy defects abrogate the survival advantage that Bcl-2 expression confers to central acinar cells (right). Mammary acini are immunostained with β-catenin (green) and nuclei are counterstained with DAPI (blue). Bottom panel: Hypoxyprobe immunohistochemistry (IHC, left) and immunofluorescence (IF, middle) on acini generated by apoptosis-defective beclin 1+/+ iMMECs. Fluorescence (F) of beclin 1+/+ iMMECs with Bcl-2 and stably expressing EGFP-LC3 (right). (See Color Insert.)
3.3.3. Monitoring autophagy in 3D-morphogenesis
Apoptosis-defective iMMECs stably expressing EGFP-LC3 are grown in Matrigel for 12 days and fixed as previously.
Acinar structures are washed with PBS (3 times) and mounted with the antifade agent Prolong.
EGFP-LC3 fluorescence is imaged by confocal microscopy.
4. Protocols for Monitoring Autophagy in Tumors In Vivo
Rapid tumor growth is often associated with metabolic stress, as cellular proliferation outstrips vascular supply and results in hypoxic regions within tumors. Induction of autophagy in tumors in vivo can be visualized in the first few days following subcutaneous or orthotopic implantation of apoptosis-defective iBMK cells (Fig. 4.3) and iMMECs stably expressing EGFP-LC3 in nude mice (Degenhardt et al., 2006; Karantza-Wadsworth et al., 2007; Mathew et al., 2007b). Tumor allografts of EGFP-LC3-expressing cells in the abdominal flank (iBMK) or the mammary fat pad (iMMECs) of nude mice provide an excellent system to monitor metabolic stress and autophagy induction during tumorigenesis (Karantza-Wadsworth et al., 2007; Mathew et al., 2007b).
Figure 4.3.
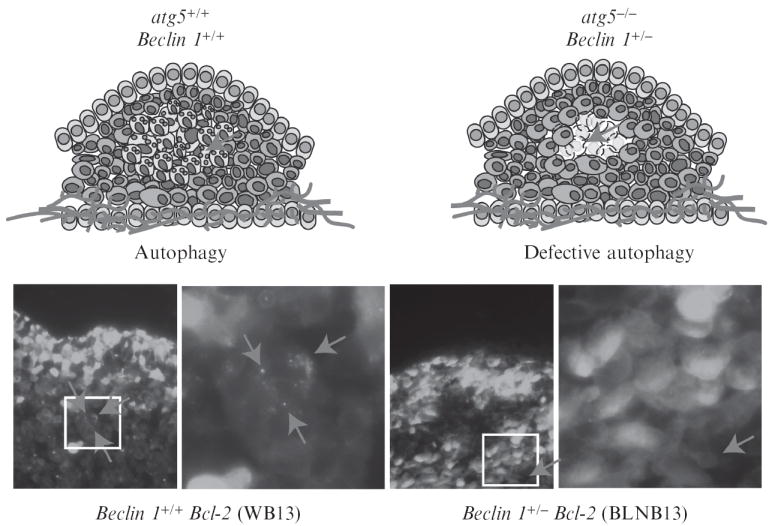
Autophagy is a response to metabolic stress in solid tumors. Tumor cells suffer metabolic stress that can either trigger apoptosis to promote tumor suppression or survival by autophagy in tumor cells with apoptosis defects. Autophagy can be visualized in tumors by stable expression of the autophagy marker EGFP-LC3 and generation of subcutaneous tumor allografts. Autophagy-competent (WB3; left panel) or autophagy-defective (BLNB13; right panel) iBMK cells stably expressing EGFP-LC3 shown in figure 1, are implanted subcutaneously to generate allografts for spatial and temporal mapping of autophagy. Tumors are excised at various times post-implantation, fixed and GFP-LC3 fluorescence is imaged by confocal microscopy to indicate autophagy status. Top left panel is a schematic representation of the autophagy-competent (beclin 1+/+) tumor section (on day 3 post-implantation) shown in the bottom left panel: autophagy induction in the center promotes tumor cell survival (red arrows). Top right panel is a schematic representation of the autophagy-deficient (beclin 1+/−) tumor section (on day 3 post-implantation) shown in the bottom right: autophagy defects impair tumor cell survival leading to metabolic catastrophe and necrosis. (See Color Insert.)
Tumors generated by cells stably expressing EGFP-LC3 are excised at various times post-implantation (days 1, 3, 8 and 15) allowing spatial and temporal correlation of functional autophagy status with histological markers (e.g., hypoxia, vascularization, inflammation).
4.1. Monitoring autophagy induction in subcutaneous tumor allografts in vivo
4.1.1. Reagents
10% buffered formalin solution
15% sucrose solution
30% sucrose solution
Tissue-Tek O.C.T. (VWR, 25608-930)
ProLong Gold antifade reagent
4.1.2. Tumor allograft growth
Tumor allografts are generated by subcutaneous implantation of iBMK cell lines expressing EGFP or EGFP-LC3 in nude mice (2 animals per time point per genotype) (Mathew et al., 2008).
Apoptosis-defective iBMK cells are grown in 15-cm plates (roughly 1 plate per animal injection) to 90% confluency, harvested by trypsinization, centrifuged at 1500 rpm (approximately 300×g), and washed twice with PBS. Cells are counted by trypan blue exclusion.
Cells are resuspended at a final concentration of 1 × 10⁸ cells/ml in sterile PBS, and 100 μl (107 cells) are implanted under the skin in the abdominal flank of nude mice (5 weeks old, male, NCR Nu/Nu; Taconic) per an IACUC-approved protocol.
Tumors appear as small subcutaneous bumps as early as 1 day post-implantation. Animals are euthanized on day 1, 3, 8, and 15 after tumor cell implantation and tumors are carefully excised and fixed for frozen sections.
4.1.3. Tumor fixation and processing for frozen sections
Tumors are fixed in 10% buffered formalin solution overnight at -20 °C and are then subjected to sequential sucrose dehydration. The dehydration step is critical for preventing ice formation and resultant tissue artifacts upon cryosectioning.
Tumors are dehydrated in 15% sucrose at 4 °C for 6 h, and then in 30% sucrose at 4 °C overnight.
Tumors are subsequently embedded in Tissue-Tek O.C.T. in a dark chamber at 4 °C for 24 h.
Frozen sections (5-μm in thickness) are obtained with a cryomicrotome (Leica Reichert-Jung CryoCut 1800, Leica Microsystems) and collected on poly-L-lysine (1%)-coated glass slides (Lab Scientific, 7799).
Frozen sections are mounted with the antifade agent Prolong, stored at 4 °C, and imaged by confocal microscopy using a FITC filter.
4.2. Monitoring autophagy induction in orthotopically implanted mammary tumors in vivo
4.2.1. Reagents
Ketamine (Ketaset; Fort Dodge, 4402A)
Xylazine (Xyla-ject, Phoenix Pharmaceutical, 600077)
See reagents in section 4.1.1
4.2.2. Orthotopic tumor growth
beclin 1+/+ and beclin 1+/− iMMECs with Bcl-2 and stably expressing EGFP-LC3 are grown in 15-cm plates to 90% confluency, harvested by trypsinization, washed, and resuspended in PBS (108 cells/ml).
Orthotopic iMMEC implantation is performed using a previously described IACUC-approved protocol (Karantza 2008 MIE). In summary, 5- to 8-week-old nude female mice are anesthetized with keta-mine (100 mg/kg intraperitoneally, IP) and xylazine (10 mg/kg IP). A small incision is made to reveal the right third mammary gland, and 107 cells (100 μl) are implanted into the mammary fat pad. The incision is closed with surgical clips.
4.2.3. Tumor fixation and processing for frozen sections
Mammary tumors are excised at different time points post-implantation, fixed and processed for frozen sections as described in section 4.1.3.
5. Monitoring Chromosomal Instability Due to Autophagy Defects
Centrosomes are cellular organelles that ensure uniform distribution of DNA during mitosis through bipolar division of chromosomes. Centrosomes themselves divide once per cell cycle during S phase, maintaining a tightly regulated centrosome number of 1 (in G1 phase) or 2 (in G2 phase) per cell. However, when this regulation is impaired, numerical abnormalities such as supernumerary centrosomes (more than 2 per cell) can result in multipolar spindles and abnormal segregation of chromosomes, leading to aneuploidy. Centrosome abnormalities are common among solid tumors and are indicative of genomic instability (Fukasawa, 2007).
5.1. Protocols for studying centrosome abnormalities
5.1.1. Reagents
Coverslips: Fisherbrand Coverglass
Methanol:acetone (1:1 v/v), chilled
Mouse anti-γ-tubulin antibody (Axell, BYA96861)
TRITC-conjugated goat antimouse secondary antibody (Jackson Immuno Research, 115-025-146)
Blocking buffer (3% BSA and 0.05% Triton X-100 in PBS)
ProLong Gold antifade reagent
5.1.2. γ-tubulin staining and quantification
Ethanol-sterilized coverslips are aseptically placed in 10-cm plates.
2 × 10⁶ cells are plated per coverslip-containing plate and grown (for at least 24 h) to 80% confluency.
Coverslips are fixed in chilled methanol:acetone for 10 min, rinsed twice with PBS, and incubated with anti-γ-tubulin antibody at 1:100 dilution in blocking buffer in a humidified chamber at 37 °C for 1 h.
Coverslips are washed with PBS (3 times) and incubated with TRITC-conjugated goat antimouse secondary antibody at 1:50 dilution in blocking buffer in a humidified chamber at 37 °C for 30 min. Nuclei are counterstained with DAPI (0.5 ng) for 15 min at RT.
Coverslips are rinsed in PBS and then distilled water, mounted with the antifade agent Prolong, and imaged at 600X using fluorescence microscopy.
The number of centrosomes per cell is recorded for at least 100 cells. Any cell with centrosome number greater than 2 is considered abnormal.
5.2. Protocols for ploidy determination by flow cytometry
Flow cytometry is a simple, but powerful, tool to study ploidy abnormalities by measuring cell DNA content. Cells are fixed and stained with propidium iodide (PI), which stains DNA by intercalating between the bases. PI also binds to RNA, necessitating treatment with ribonuclease (RNase) to minimize interference with DNA staining. Once PI is bound to nucleic acids, the fluorescence excitation and emission maxima are shifted and fluorescence emission is enhanced 20- to 30-fold and is proportional to the total amount of the DNA. Flow cytometry allows the measurement of this fluorescence per cell, thus permitting the quantification of the total amount of DNA per cell. A DNA-PI fluorescence histogram for a normal cell population is typically comprised of a 2-peak profile with fluorescence intensity on an arbitrary scale on the X-axis and frequency on the Y-axis. The first peak represents the diploid population of cells in G1 phase of the cell cycle (2N DNA content) and the second peak corresponds to cells in G2 and M phases of the cell cycle (4N DNA content). The valley connecting the two peaks represents cells with intermediate amounts of DNA (2N-4N) corresponding to cells in S phase that are undergoing DNA synthesis at the time of fixation. It may be noted that 2N and 4N notations are merely relative amounts of DNA. In samples where cell death has occurred, there can be a sub-G1 peak (less than 2N DNA content) and this is often used as a measure of apoptosis.
A major problem in the determination of ploidy abnormalities by flow cytometry is that only a relative, but not the absolute, DNA content is obtained. This is further complicated by variations in DNA staining intensity, due to cell concentration and instrument parameter variability, which can affect peak positioning and may lead to misinterpretation of the histogram. Extreme consistency in sample preparation is thus critical. These problems are circumvented by using an internal biological DNA standard with a known genome size (C-value), such as Chicken Erythrocyte Nuclei (CEN) Singlets. CEN have a C-value of 1.25 pg (2N chromosome number 18) compared to that of mouse (Mus musculus) cells (C-value = 3.25; 2N chromosome number 40) and human (Homo sapiens) cells (C-value = 3.5; 2N chromosome number 46). Therefore, when stained and analyzed together with the mouse or human cell lines under investigation, CEN provides a single reference peak to the left of the diploid (2N) peak of these cell lines and the relative position of the other peaks in reference to the CEN singlet provides a satisfactory ploidy measure. Spontaneous ploidy abnormalities due to allelic loss of beclin 1 in iBMK cells and iMMECs are analyzed as described subsequently.
5.2.1. Reagents
Propidium iodide (PI) (Sigma; P4170), 1 mg/ml in dH2O.
RNase A (Sigma, R4875), 1 mg/ml in PBS: 50 mg RNase A are dissolved in 50 ml of PBS containing 0.1% Tween 20 (Sigma, P1379). The solution is placed in a 95 °C water bath for 30 min allowed to cool on ice for 1 h, then filtered through a 0.2-μm filter. The final reagent can be stored for up to 6 months at 4 °C.
70% (v/v) ethanol in dH2O.
Chicken Erythrocyte Nuclei (CEN) Singlets (2 × 10⁴ nuclei/μL) (BioSure, 1013), 1:10 fresh working dilution in PBS.
5.2.2. PI staining and DNA quantification
Cells are harvested by trypsinization, centrifuged at 1500 rpm (approximately 300×g), resuspended in PBS (1 × 10⁶ cells/ml) and mixed by gentle pipetting to remove cell clumps and prepare a uniform single cell suspension.
1 × 10⁶ cells are transferred to a 15-ml snap-cap polypropylene tube (Falcon, 352059) (polystyrene/carbonate tubes are not suitable as cells may stick to the tube following fixation).
Chilled 70% ethanol (5 mL) is added drop wise with simultaneous gentle vortexing (level 3–4) to prevent cell clumping. Cells are fixed on ice for 30 min.
Cells are washed with 10 ml of PBS and centrifuged at 2000 rpm (approximately 600×g) for 10 min. The supernatant fraction is carefully aspirated, leaving approximately 200 μl in the tube. It is important that this volume is consistent between samples. Fixed cells are lighter; therefore, care must be taken during supernatant aspiration.
PBS (300 μl) is added to the above fixed cell suspension, followed by gentle vortexing (levels 3–4).
CEN (1:10 dilution in PBS, 10 μl) is added as an internal standard and the suspension is gently mixed by pipetting.
RNase A solution (100 μl) and PI (50 μl) are added to the cell suspension, followed by gentle vortexing and incubation at RT for 30 min.
After PI staining, samples are analyzed by flow cytometry (FC500; Beckman Coulter). Cell staining and analysis are repeated at least twice with 10,000 cells per genotype in each experiment. Voltage is adjusted for each sample using CEN as the internal standard peak.
Alternatively, PI-stained cells can be sealed airtight in capped tubes (to prevent evaporation) and kept at 4 °C until analysis by flow cytometry.
5.3. Protocols for studying chromosomal abnormalities by metaphase spreads
Ploidy abnormalities are often caused by numerical aberrations in chromosome numbers that are telltale signs of an underlying genomic instability (Rajagopalan and Lengauer, 2004). Giemsa staining allows visualization of gross numerical and structural chromosome abnormalities (Brown and Baltimore, 2000). Prior to Giemsa staining, cells are treated with a microtubule poison, such as nocodazole, for arrest in mitosis (metaphase), where chromatin material is condensed into individual chromosomes. Cells in mitosis are spherical, and therefore loosely attached to the tissue culture plate, so they can be easily removed by shake-off. Isolated mitotic cells are then allowed to swell up by hypotonic treatment followed by methanol: acetic acid fixation before being dropped on a glass slide. A detailed protocol follows.
5.3.1. Reagents
Nocodazole (Sigma, M1404) is dissolved in tissue culture grade DMSO, 10 mg/mL stock solution. This is further diluted in regular growth medium to a final concentration of 0.5 mg/ml. The stock solution can be aliquoted and stored at −20 °C.
Hypotonic potassium chloride solution (KCl 0.075M).
3:1 (v/v) mix of chilled methanol and glacial acetic acid (methanol:acetic acid fixative), which can be stored at −20 °C for extended periods of time.
KaryoMax Giemsa Stain (Gibco, 10092-013): 1X Giemsa staining buffer is prepared by mixing 5 ml of KaryoMax Geimsa stain with 45 ml of Gurr’s buffer.
Gurr’s buffer tablets (Gibco, 10582-013): Gurr’s buffer (pH = 6.8) is prepared by dissolving 1 tablet in 1 L of distilled water.
CytoSeal mounting medium (Richard-Allan Scientific, 8310-4).
5.3.2. Protocol for Giemsa staining and analysis
2 × 10⁶ cells are plated in a 10-cm plate in regular growth medium and allowed to reach 80% confluency at 38.5 °C and 8.5% CO2 (usually 24 h).
Cells are washed with PBS and treated with nocodazole (0.5 μg/mL) for 2 h. Longer periods of incubation with nocodazole result in over-condensed chromosomes that may make interpretation difficult. Cells are examined by light microscopy at 400–1000X magnification to verify accumulation of mitotic cells.
Plates are shaken to remove mitotic cells that are loosely attached compared with cells in interphase. Mitotic cells are collected and transferred to a 50-ml conical tube. Plates are washed 1 more time with PBS to collect the remaining mitotic cells and samples are pooled together.
Remaining attached cells are carefully harvested by trypsinization and collected in 10 ml of regular growth medium. Cells are gently mixed by pipetting, and 2 ml of this cell suspension is added into the mitotic cell pool from step 3 (these cells act as carrier cells in subsequent steps to reduce mitotic cell loss).
Mitotic cells are pelleted at 1000 rpm (approximately 300×g) at 4 °C for 5 min, gently resuspended in 0.075M KCl (5 mL), and incubated at RT for 20 min.
Cells are pelleted again at 1000 rpm (approximately 300×g) at 4 °C for 5 min. The supernatant fraction is carefully aspirated and discarded. Cells are resuspended in methanol:acetic acid fixative (1 ml), transferred to a 1.5-ml microcentrifuge tube, and incubated at 4 °C for 20 min (cells may be stored at 4 °C in the fixative).
Glass slides (1 glass slide per mitotic spread) are labeled and chilled at −20 °C.
Fixed cells from step 6 are pelleted by centrifugation at 2000 rpm (approximately 600×g) at 4 °C for 2 min and resuspended in 300 μl chilled fixative.
When ready to prepare mitotic spreads, slides are taken out of the freezer and moisture is removed by quickly wiping with a clean and dry tissue paper.
Fixed cells are gently mixed and dropped from 30–45 cm height onto the prechilled glass slides held in a slanted position. Maintaining cells and slides at low temperatures prevents quick evaporation of the fixative and provides better quality spreads. Slides are allowed to air-dry at RT for 4 min and then cured overnight at 37 °C in an oven (Hybaid).
Mitotic spreads are stained with Giemsa staining buffer at RT for 20 min in coplin jars (Fisher, 08-817).
Slides are rinsed with Gurr’s buffer (2–3 times), air-dried at RT for 30 min, and mounted with Cytoseal-60 mounting medium.
Giemsa-stained chromosomes appear purple in color and can be visualized and photographed at 200X magnification using a standard upright microscope. Approximately 150 individual mitotic figures per cell line are photographed and carefully analyzed for numerical and structural chromosome abnormalities. The total number of chromosomes is carefully counted in each spread and depicted as a scatter and X–Y scatter plot. Mean and median chromosome numbers are calculated for each cell line and are used to compute the average of the mean chromosome number in each genotype (Mathew et al., 2007b). The normal mouse chromosome number is 40 and therefore any metaphase spread that contains a chromosome number higher or lower than 40 is considered abnormal.
5.4. Protocols for studying chromosomal gains and losses by array-based comparative genome hybridization (aCGH)
One of the major genomic instability phenotypes associated with autophagy defects is the random gain and losses of chromosomes (Albertson et al., 2003). Such aberrations lead to variations in DNA copy numbers and constitute a major genomic instability phenotype in cancer (Albertson, 2006). As chromosomal gains often also accompany chromosomal losses in the genome, these variations may not necessarily be reflected in the total amount of DNA per cell and therefore cannot be identified by DNA quantification by flow cytometry. Microarray-based aCGH is a powerful technique to identify DNA copy number variations by comparing the hybridization intensities between a normal (reference genome) and a test genome to detect the relative copy number variations signifying chromosomal losses and gains (Kallioniemi et al., 1992).
5.4.1. Reagents
Tris-EDTA (TE): 10 mM Tris base, pH 7.6, 0.5 mM EDTA, pH 8.0
Proteinase K (Promega, V3021): 20 mg/mL in water (stock solution); this should be made fresh or kept frozen to prevent self-digestion
Sodium dodecyl sulfate (SDS) (Bio-Rad, 161-0302) (20% in water)
Saturated sodium chloride (NaCl) solution: 36 g NaCl are dissolved in 100 ml water (solubility of NaCl in water at 20 °C is 36 g/100 mL)
5.4.2. Isolation of genomic DNA from cultured cells
Cells are plated in a 10-cm plate, allowed to grow to 80% confluency, harvested by trypsinization and pelleted by centrifugation at 1500 rpm (approximately 300×g).
The supernatant fraction is carefully aspirated and discarded, and the cells are resuspended in 3 ml of TE and 100 μl 20% SDS.
Proteinase K (20 mg/ml, 20 μl) is added to the preceding cell suspension, which is gently mixed by inversion and incubated in a water bath at 55 °C overnight.
Saturated NaCl solution (1 ml) is added to the cell digest, and the suspension is mixed gently and uniformly by inversion.
100% ethanol (10 ml) is added, and the tube is gently inverted 3–4 times. A long strand of genomic DNA is visible at this time. Tubes are incubated at RT overnight on a slow rocker.
The DNA precipitate is gently transferred to a 15-ml tube containing 10 ml of 70% ethanol and incubated at RT for 6–8 h on a slow rocker.
The DNA precipitate is spooled using a slightly bent 22G needle and transferred to the bottom of a 1.5-ml microcentrifuge tube. As much of the ethanol as possible is aspirated. The location of the precipitate is marked outside the tube and the precipitate is allowed to air-dry (once dry, DNA will not be readily visible).
Sterile water (100–300 μl) is added toward the tube side, and the DNA pellet is resuspended gently by flicking the tube and allowing it to sit at RT for 1–2 h. Genomic DNA should not be pipetted, as this may cause DNA shearing.
Dissolved DNA is further diluted 1:500 in distilled water, and the absorbance is measured at 260 mM and 280 mM using a UV spectrophotometer (Beckman Coulter). DNA concentration is calculated using the following formula: DNA concentration (μg/μl) = A260 × CF × DF/path length, where the concentration factor (CF) for double-stranded DNA is 0.05 (1 A260 unit = 50 μg/ml) and the dilution factor (DF) is 500.
An absorbance ratio (A260/280) of 1.8–1.9 indicates that the DNA is pure. A260/280 less than 1.8 indicates protein contamination, whereas a ratio higher than 2.0 indicates RNA contamination. In either case, DNA purity can be further improved by an additional phenol/chloroform/isoamyl alcohol extraction as described below.
Equal volume of phenol/chloroform/isoamyl alcohol (25:24:1) is added to DNA in a polypropylene tube, and the mixture is vigorously shaken until an emulsion is formed and then centrifuged at 1600×g for 3 min. The aqueous phase (containing DNA) is transferred to a fresh 1.5-ml polypropylene microcentrifuge tube. The process is repeated with chloroform/isoamyl alcohol without phenol, the aqueous phase is transferred into a fresh polypropelene tube and DNA is precipitated by addition of 100% ethanol (2.5 volumes) and 3 M sodium acetate (0.1 volume). The solution is mixed by inversion (3-4 times) and centrifuged at 1600×g for 15 min to pellet the DNA, which is finally resuspended in water or TE (resuspension in TE requires 2–3 h of incubation at RT).
5.4.3. Determination of DNA copy number variations
Genomic DNA isolated from iBMK cell lines and DNA from a normal mouse kidney are fluorescently labeled (Cy3 and Cy5), hybridized to a BAC array in triplicates and analyzed for chromosome gains and losses using aCGH at the DNA Array Core Facility at the University of California, San Francisco, as described elsewhere (Snijders et al., 2005).
Mean log2 ratios of the total integrated Cy3 and Cy5 intensities of each sample from triplicate spots as estimated by UCSF SPOT software (Jain et al., 2002) and SPROC software (Snijders et al., 2005) are plotted in genome order. An average log2 ratio of more than ±0.5 is considered as a loss or gain (Mathew et al., 2007b).
5.5. Protocols for studying gene amplification by PALA assay
Gene amplification results from DNA double-strand breaks (DSBs) due to increased oxidative stress or defects in DNA repair. It is facilitated by inactivation of the p53 DNA damage checkpoint (Lin et al., 2001; Little and Chartrand, 2004; Livingstone et al., 1992; Mondello et al., 2002) and is a major mechanism of oncogene activation (Albertson, 2006; Hennessy et al., 2005; Shen et al., 1986). Therefore, iBMK and iMMEC cell lines with inactivated p53 and pRb pathways are expected to be prone to gene amplification at similar frequencies. Gene amplification is the only known mechanism of resistance to N-phosphonacetyl-l-aspartate (PALA) that prevents de novo pyrimidine biosynthesis by inhibiting the aspartate transcarbamylase activity of the carbamoyl-P synthetase/aspartate transcarbamylase/di-hydroorotase (CAD) enzyme complex (Livingstone et al., 1992). Indeed, PALA-resistant cells demonstrate amplification of the CAD gene. Thus, the frequency of clonogenic resistance to PALA is a direct measure of gene amplification, and therefore of the underlying DNA damage and genomic instability. Autophagy suppresses DNA damage and gene amplification, as monoallelic loss of beclin 1 promotes PALA resistance mediated by gene amplification (Karantza-Wadsworth et al., 2007; Mathew et al., 2007b). This function of autophagy is one of the mechanisms by which autophagy may function as a tumor suppressor pathway (Mathew et al., 2007a).
5.5.1. Reagents
N-(phophonoacetyl)-L-aspartate (PALA) (Drug Synthesis and Chemistry Branch, National Cancer Institute): PALA solution (1 mM) is prepared fresh by dissolving 175.525 mg of PALA in 500 ml of regular growth medium supplemented with 10% dialyzed, rather than regular, FBS. PALA is light sensitive and therefore exposure to light should be minimized.
Dialyzed FBS (Invitrogen, 26400-044): Use of dialyzed FBS eliminates the presence of metabolic precursors that could interfere with PALA toxicity.
Trypan blue stain (0.4% solution) (Invitrogen, 15250-061).
Methanol (100%).
Giemsa Stain (15X) (Sigma; GS1L).
5.5.2. Determination of PALA LD50
1 × 10⁵ cells are plated in 10-cm plates and allowed to adhere for 24 h. Each cell line is plated in triplicate. Medium is then replaced with regular growth medium containing increasing concentrations (0, 10, 20, 30, 40, 50, 60, 70, 80, 90, and 100 μM) of PALA, and cells are incubated for 3 days at 38.5 °C and 8.5% CO2. Untreated cells are harvested 24 h after plating and counted by trypan blue exclusion to determine the cell number at time 0.
PALA-treated cells are rinsed with PBS and the adherent viable cells are harvested by trypsinization and collected in culture medium (5 ml).
Viable cells are counted by trypan blue exclusion and the mean viability at each PALA concentration is normalized to cell number at time 0. The data are plotted as a smooth line curve with standard deviations and the concentration of PALA that kills 50% of the cells (LD50) is calculated from the graph. PALA LD50 is 20 and 17 μM for Bcl-2-expressing iBMK cells and iMMECs, respectively.
5.5.3. Determination of plating efficiency (PE)
1 × 10³ cells are plated per 10-cm plates (in triplicate per cell line) and incubated at 38.5 °C and 8.5% CO2 until well-separated colonies emerge (7–10 days).
Colonies, once visible to the naked eye, are washed with PBS and are fixed in 100% methanol at RT for 15 min.
Colonies are stained with Giemsa (15X stock) diluted 1:15 with distilled water for 15–20 min or until colonies become purple in color.
Stained plates are rinsed with water several times, inverted, and allowed to dry.
Plating efficiency (PE) is calculated as: (number of colonies per plate/number of cells plated) × 100.
5.5.4. Quantification of PALA-resistance frequency
5 × 10⁵ cells are plated per 10-cm plate (in triplicate per cell line) and allowed to adhere overnight by incubation at 38.5 °C and 8.5% CO2.
The medium is then replaced with regular growth medium containing PALA at 3X LD50 and 5X LD50 for 10–14 days or until well-separated PALA-resistant colonies emerge. PALA-containing medium is replaced every 3–4 days.
PALA-resistant colonies are fixed in methanol, stained with Giemsa (as described in section 5.5.3) and counted.
The frequency of PALA-resistance is calculated as the number of PALA-resistant colonies per plate/(PE × number of cells plated).
5.5.5. Polymerase chain reaction (PCR) for CAD gene amplification
Genomic DNA is isolated from multiple PALA-resistant colonies as described in section 5.4.2.
A 756-base-pair fragment flanking two exons of the Mus musculus CAD gene (accession no. NM 023525) on chromosome 5 (accession no. AC_109608) is amplified by PCR using the following set of primers: Fwd: (5′-GGAGCTGGAGACTCCGACG-3′) Rev: (5′-CTAATGAACAGGAAGATCCGGTATC-3′)
- The PCR is performed for 19, 21, 23, 25, and 27 (N) cycles in the presence of 2.5 units Taq DNA polymerase (Invitrogen, 18038-042) and 1.5 mM MgCl2 using the program shown below:
Step Description 1 Initial denaturation at 94 °C for 5 min 2 Denaturation at 94 °C for 30 s 3 Annealing at 50 °C for 30 s 4 Extension at 72 °C for 30 s 5 Repeat steps 2–4 for N times 6 Additional extension at 72 °C for 5 min PCR products are separated on a 1% agarose gel and stained with ethidium bromide.
5.6. Computerized video time-lapse (CVTL) microscopy
Genomic instability due to defective autophagy likely plays a major role in tumorigenesis. Conventional tissue culture techniques cannot provide the spatial and temporal information that is crucial for understanding the dynamic cellular processes leading to genomic instability. Long-term observations are also restricted by the demands for physiological growth conditions and by limitations of microscopy instrumentation. CVTL, especially in combination with fluorescence protein tagging, is a powerful tool to monitor cellular processes that occur over extended periods of time. We have developed a model system comprising of a wide array of genetically defined epithelial cells that closely recapitulate in vivo tumor cell phenotypes under physiological conditions in vitro (Mathew et al., 2008). Combining the CVTL system and a panel of fluorescent probes stably expressed in these cells, we have captured and characterized cellular processes such as apoptosis, autophagy, necrosis, mitosis and cell division, wound healing response, and 3D morphogenesis that play key roles in tumorigenesis (Degenhardt et al., 2006; Karantza-Wadsworth et al., 2007; Karp et al., 2008; Shimazu et al., 2007). The fully automated and environmentally controlled system enables us to culture and film isogenic cell lines of varying genotype under multiple growth conditions within the same experiment. Time-lapse observations typically span up to 12 days or more and can be performed under regular and metabolic stress conditions, including drug treatments (Degenhardt et al., 2006; Karantza-Wadsworth et al., 2007; Karp et al., 2008; Shimazu et al., 2007).
5.6.1. Equipment and reagents
Inverted microscope with 10X, 20X, and 40X objectives
Temperature, humidity and CO2-controlled environmental chamber
Cooled CCD camera
Image analysis software
5.6.2. Protocol for CVTL microscopy
Wild-type and autophagy-defective cells are plated as described in steps 2 or 3 subsequently. Alternatively, cells stably expressing fluorescent markers can also be used to track fluorescent markers for monitoring cellular processes such as mitosis (for special settings, see step 6 here).
For time-lapse observations under normal growth conditions, cells are plated at a density of 2 × 10⁵ cells per well in a 6-well plate in 2 ml of medium so that all the cell lines and culture conditions are represented on the same 6-well plate. Cells are allowed to attach and grow overnight.
For time-lapse observations under metabolic stress conditions that require examination of one cell line at a time, cells are plated in a T25 tissue culture flask (Corning cell culture flask with canted neck, plug seal cap, 430168) at a density of 2 × 10⁵ per flask in 8 ml of regular culture medium and allowed to grow for 16–18 h. Normal growth medium is then replaced with 8 ml of glucose-free medium (glucose-free DMEM supplemented with 10% FBS and 1% Pen/Strep) and the flasks are then sealed air-tight using a rubber stopper (VWR, 59582-585) modified to accommodate tubing that allows flushing of the flasks with a defined ischemic gas mixture containing 1% oxygen, 5% CO2 and 94% N2 (GTS-Welco) (Nelson et al., 2004) for 5 min. After flushing, the flask and the tubes are sealed and the procedure continues with step 4.
Approximately 16–18 h after the plating, cells normally growing in 6-well plates (from step 2) or subjected to metabolic stress in T25 flasks (from step 3) are transferred into the time-lapse chamber, equipped with controlled environmental conditions.
The time-lapse microscopy system consists of an Olympus IX-71 inverted microscope fitted with temperature, humidity and CO2-controlled environmental chamber (37 °C and 8.5% CO2) (Solent Scientific) and a CoolSNAP ES-cooled CCD camera.
-
Phase contrast images (100X) at multiple fields are obtained at 10-min intervals for 3–5 days using ImagePro Plus software (Media Cybernetics).
An example of the settings used for bright field images are given here:
Binning: 1 × 1
Exposure: 16 ms.
Interval: 600 s.
For fluorescence time-lapse experiments images are captured using GFP filters. An example of the settings used for GFP images are given here:
Binning: 4 × 4
Expose: 10 ms.
Interval: 1800 s.
Captured images are assembled into time-lapse sequences and movies (.avi). Analysis of still images and sequences are performed using ImagePro Plus software.
For examining differences in cell survival, time-lapse sequence files (.seq files) are played using ImagePro software, in parallel. Still images are used to assemble a panel for direct comparison of cell survival.
6. Concluding Remarks and Future Perspectives
Metabolic stress and genomic instability have been implicated in human cancer pathogenesis for a long time; however, the exact functional interaction between these factors has been largely elusive. By developing an in vitro assay that faithfully recapitulates metabolic stress in the tumors in vivo, we discovered that autophagy plays a major role in linking the two by mitigating the deleterious consequences of metabolic stress and the resultant DNA damage and instability (Karantza-Wadsworth et al., 2007; Mathew et al., 2007b). Therefore, activation of autophagy not only supports survival under stress but also protects the genome, and therefore promoting autophagy may be beneficial as a cancer prevention strategy.
Even more important, cancer cells overtly depend on an uninterrupted nutritional supply for meeting their proliferative needs, and this high demand in conjunction with inadequate supply is exactly what causes hypoxic regions in tumors. On one hand, metabolic stress compromises treatment efficacy, as tumor hypoxia is associated with resistance to radiation and chemotherapy. On the other hand, the greater susceptibility of cancer cells to metabolic stress can be exploited for therapeutic benefit. As a major cellular stress response, autophagy may facilitate tumor cell survival creating dormant tumor cells that cause disease recurrence. A clearer understanding of how tumor cells use autophagy to survive metabolic stress is essential for the successful use of autophagy modulation in cancer therapy. Therefore, screening for small-molecule autophagy inducers and inhibitors may prove extremely important in the development of novel preventative and therapeutic strategies. In the past few years, major strides have been made in understanding the role of autophagy in cancer progression and treatment, and there is great enthusiasm in targeting this important pathway for clinical outcome improvement. The wild-type and autophagy-defective immortalized epithelial cell lines that we have developed—in particular the cells with fluorescent readouts for autophagy monitoring—are powerful tools available to the cancer research community for this new and exciting endeavor.
References
- Aita VM, et al. Cloning and genomic organization of beclin 1, a candidate tumor suppressor gene on chromosome 17q21. Genomics. 1999;59:59–65. doi: 10.1006/geno.1999.5851. [DOI] [PubMed] [Google Scholar]
- Albertson DG. Gene amplification in cancer. Trends Genet. 2006;22:447–455. doi: 10.1016/j.tig.2006.06.007. [DOI] [PubMed] [Google Scholar]
- Albertson DG, et al. Chromosome aberrations in solid tumors. Nat Genet. 2003;34:369–376. doi: 10.1038/ng1215. [DOI] [PubMed] [Google Scholar]
- Arico S, et al. The tumor suppressor PTEN positively regulates macroautophagy by inhibiting the phosphatidylinositol 3-kinase/protein kinase B pathway. J Biol Chem. 2001;276:35243–35246. doi: 10.1074/jbc.C100319200. [DOI] [PubMed] [Google Scholar]
- Barlogie B, et al. Prognostic implications of ploidy and proliferative activity in human solid tumors. Cancer Genet Cytogenet. 1982;6:17–28. doi: 10.1016/0165-4608(82)90017-6. [DOI] [PubMed] [Google Scholar]
- Brown EJ, Baltimore D. ATR disruption leads to chromosomal fragmentation and early embryonic lethality. Genes Dev. 2000;14:397–402. [PMC free article] [PubMed] [Google Scholar]
- Dang DT, et al. Hypoxia-inducible factor-1 target genes as indicators of tumor vessel response to vascular endothelial growth factor inhibition. Cancer Res. 2008;68:1872–1880. doi: 10.1158/0008-5472.CAN-07-1589. [DOI] [PubMed] [Google Scholar]
- Debnath J. Detachment-induced autophagy during anoikis and lumen formation in epithelial acini. Autophagy. 2008;4:351–353. doi: 10.4161/auto.5523. [DOI] [PubMed] [Google Scholar]
- Debnath J, et al. Morphogenesis and oncogenesis of MCF-10A mammary epithelial acini grown in three-dimensional basement membrane cultures. Methods. 2003;30:256–268. doi: 10.1016/s1046-2023(03)00032-x. [DOI] [PubMed] [Google Scholar]
- Degenhardt K, et al. Autophagy promotes tumor cell survival and restricts necrosis, inflammation, and tumorigenesis. Cancer Cell. 2006;10:51–64. doi: 10.1016/j.ccr.2006.06.001. [DOI] [PMC free article] [PubMed] [Google Scholar]
- Folkman J. Angiogenesis and apoptosis. Semin Cancer Biol. 2003;13:159–167. doi: 10.1016/s1044-579x(02)00133-5. [DOI] [PubMed] [Google Scholar]
- Fukasawa K. Oncogenes and tumour suppressors take on centrosomes. Nat Rev Cancer. 2007;7:911–924. doi: 10.1038/nrc2249. [DOI] [PubMed] [Google Scholar]
- Fung C, et al. Induction of autophagy during extracellular matrix detachment promotes cell survival. Mol Biol Cell. 2008;19:797–806. doi: 10.1091/mbc.E07-10-1092. [DOI] [PMC free article] [PubMed] [Google Scholar]
- Hennessy BT, et al. Exploiting the PI3K/AKT pathway for cancer drug discovery. Nat Rev Drug Discov. 2005;4:988–1004. doi: 10.1038/nrd1902. [DOI] [PubMed] [Google Scholar]
- Jain AN, et al. Fully automatic quantification of microarray image data. Genome Res. 2002;12:325–332. doi: 10.1101/gr.210902. [DOI] [PMC free article] [PubMed] [Google Scholar]
- Kallioniemi A, et al. Comparative genomic hybridization for molecular cytogenetic analysis of solid tumors. Science. 1992;258:818–821. doi: 10.1126/science.1359641. [DOI] [PubMed] [Google Scholar]
- Karantza-Wadsworth V, et al. Autophagy mitigates metabolic stress and genome damage in mammary tumorigenesis. Genes Dev. 2007;21:1621–1635. doi: 10.1101/gad.1565707. [DOI] [PMC free article] [PubMed] [Google Scholar]
- Karantza-Wadsworth V, White E. A mouse mammary epithelial cell model to identify molecular mechanisms regulating breast cancer progression. Methods Enzymol. 2008;446:61–76. doi: 10.1016/S0076-6879(08)01604-2. [DOI] [PMC free article] [PubMed] [Google Scholar]
- Karp CM, et al. Role of the polarity determinant crumbs in suppressing mammalian epithelial tumor progression. Cancer Res. 2008;68:4105–4115. doi: 10.1158/0008-5472.CAN-07-6814. [DOI] [PMC free article] [PubMed] [Google Scholar]
- Klionsky DJ. Autophagy: From phenomenology to molecular understanding in less than a decade. Nat Rev Mol Cell Biol. 2007;8:931–937. doi: 10.1038/nrm2245. [DOI] [PubMed] [Google Scholar]
- Komatsu M, et al. Homeostatic levels of p62 control cytoplasmic inclusion body formation in autophagy-deficient mice. Cell. 2007;131:1149–1163. doi: 10.1016/j.cell.2007.10.035. [DOI] [PubMed] [Google Scholar]
- Kuma A, et al. The role of autophagy during the early neonatal starvation period. Nature. 2004;432:1032–1036. doi: 10.1038/nature03029. [DOI] [PubMed] [Google Scholar]
- Levine B, Kroemer G. Autophagy in the pathogenesis of disease. Cell. 2008;132:27–42. doi: 10.1016/j.cell.2007.12.018. [DOI] [PMC free article] [PubMed] [Google Scholar]
- Liang XH, et al. Induction of autophagy and inhibition of tumorigenesis by beclin 1. Nature. 1999;402:672–676. doi: 10.1038/45257. [DOI] [PubMed] [Google Scholar]
- Lin CT, et al. Suppression of gene amplification and chromosomal DNA integration by the DNA mismatch repair system. Nucleic Acids Res. 2001;29:3304–3310. doi: 10.1093/nar/29.16.3304. [DOI] [PMC free article] [PubMed] [Google Scholar]
- Little KC, Chartrand P. Genomic DNA is captured and amplified during double-strand break (DSB) repair in human cells. Oncogene. 2004;23:4166–4172. doi: 10.1038/sj.onc.1207570. [DOI] [PubMed] [Google Scholar]
- Livingstone LR, et al. Altered cell cycle arrest and gene amplification potential accompany loss of wild-type p53. Cell. 1992;70:923–935. doi: 10.1016/0092-8674(92)90243-6. [DOI] [PubMed] [Google Scholar]
- Lum JJ, et al. Growth factor regulation of autophagy and cell survival in the absence of apoptosis. Cell. 2005;120:237–248. doi: 10.1016/j.cell.2004.11.046. [DOI] [PubMed] [Google Scholar]
- Marino G, et al. Tissue-specific autophagy alterations and increased tumorigenesis in mice deficient in Atg4C/autophagin-3. J Biol Chem. 2007;282:18573–18583. doi: 10.1074/jbc.M701194200. [DOI] [PubMed] [Google Scholar]
- Mathew R, et al. Immortalized mouse epithelial cell models to study the role of apoptosis in cancer. Methods Enzymol. 2008;446:77–106. doi: 10.1016/S0076-6879(08)01605-4. [DOI] [PubMed] [Google Scholar]
- Mathew R, et al. Role of autophagy in cancer. Nat Rev Cancer. 2007a;7:961–967. doi: 10.1038/nrc2254. [DOI] [PMC free article] [PubMed] [Google Scholar]
- Mathew R, et al. Autophagy suppresses tumor progression by limiting chromosomal instability. Genes Dev. 2007b;21:1367–1381. doi: 10.1101/gad.1545107. [DOI] [PMC free article] [PubMed] [Google Scholar]
- Mizushima N. Methods for monitoring autophagy. Int J Biochem Cell Biol. 2004;36:2491–2502. doi: 10.1016/j.biocel.2004.02.005. [DOI] [PubMed] [Google Scholar]
- Mizushima N. Autophagy: Process and function. Genes Dev. 2007;21:2861–2873. doi: 10.1101/gad.1599207. [DOI] [PubMed] [Google Scholar]
- Mondello C, et al. Gamma-ray and hydrogen peroxide induction of gene amplification in hamster cells deficient in DNA double strand break repair. DNA Repair (Amst) 2002;1:483–493. doi: 10.1016/s1568-7864(02)00035-6. [DOI] [PubMed] [Google Scholar]
- Nelson DA, et al. Hypoxia and defective apoptosis drive genomic instability and tumorigenesis. Genes Dev. 2004;18:2095–2107. doi: 10.1101/gad.1204904. [DOI] [PMC free article] [PubMed] [Google Scholar]
- Rajagopalan H, Lengauer C. Aneuploidy and cancer. Nature. 2004;432:338–341. doi: 10.1038/nature03099. [DOI] [PubMed] [Google Scholar]
- Semenza GL. Targeting HIF-1 for cancer therapy. Nat Rev Cancer. 2003;3:721–732. doi: 10.1038/nrc1187. [DOI] [PubMed] [Google Scholar]
- Shen DW, et al. Human multidrug-resistant cell lines: Increased mdr1 expression can precede gene amplification. Science. 1986;232:643–645. doi: 10.1126/science.3457471. [DOI] [PubMed] [Google Scholar]
- Shimazu T, et al. NBK/BIK antagonizes MCL-1 and BCL-XL and activates BAK-mediated apoptosis in response to protein synthesis inhibition. Genes Dev. 2007;21:929–941. doi: 10.1101/gad.1522007. [DOI] [PMC free article] [PubMed] [Google Scholar]
- Snijders AM, et al. Mapping segmental and sequence variations among laboratory mice using BAC array CGH. Genome Res. 2005;15:302–311. doi: 10.1101/gr.2902505. [DOI] [PMC free article] [PubMed] [Google Scholar]