Abstract
In the event of abdominal aortic aneurysm (AAA) rupture, the outcome is often death. This paper aims to experimentally identify the rupture locations of in vitro AAA models and validate these rupture sites using finite element analysis (FEA). Silicone rubber AAA models were manufactured using two different materials (Sylgard 160 and Sylgard 170, Dow Corning) and imaged using computed tomography (CT). Experimental models were inflated until rupture with high speed photography used to capture the site of rupture. 3D reconstructions from CT scans and subsequent FEA of these models enabled the wall stress and wall thickness to be determined for each of the geometries. Experimental models ruptured at regions of inflection, not at regions of maximum diameter. Rupture pressures (mean ± SD) for the Sylgard 160 and Sylgard 170 models were 650.6 ± 195.1 mmHg and 410.7 ± 159.9 mmHg, respectively. Computational models accurately predicted the locations of rupture. Peak wall stress for the Sylgard 160 and Sylgard 170 models was 2.15 ± 0.26 MPa at an internal pressure of 650 mmHg and 1.69 ± 0.38 MPa at an internal pressure of 410 mmHg, respectively. Mean wall thickness of all models was 2.19 ± 0.40 mm, with a mean wall thickness at the location of rupture of 1.85 ± 0.33 mm and 1.71 ± 0.29 mm for the Sylgard 160 and Sylgard 170 materials, respectively. Rupture occurred at the location of peak stress in 80% (16/20) of cases and at a high stress regions but not peak stress in 10% (2/20) of cases. 10% (2/20) of models had defects in the AAA which moved the rupture location away from regions of elevated stress. The results presented may further contribute to the understanding of AAA biomechanics and ultimately AAA rupture prediction.
INTRODUCTION
The incidence of abdominal aortic aneurysm (AAA) is on the increase with approximately 150,000 new cases diagnosed in the US each year (Bengtsson et al., 1996). Although the mortality rates associated with AAA are high, there still remains uncertainty about the correct time to surgically repair these aneurysms. Currently, the trend is to use the maximum diameter criterion (Cronenwett et al., 1985; Glimaker et al., 1991), where AAAs that reach or exceed 5 – 5.5 cm in maximum diameter are deemed a rupture risk, and subsequently repaired. However, recent research has questioned the effectiveness of this method (Raghavan et al., 2000; Sayers, 2002; Fillinger et al., 2002, 2003; Vande Geest et al., 2006; Kleinstreuer and Li, 2006; Leung et al., 2006; Vorp, 2007; Doyle et al., 2009a, 2009b) as it has been reported that smaller AAAs can rupture (Darling et al., 1977; Nicholls et al., 1998) and also larger AAAs may remain stable for the rest of the patients life.
The majority of previous reports have focused on computational approaches, in particular finite element analysis (FEA), to predict regions of elevated wall stress (Mower et al., 1997; Vorp et al., 1998; Raghavan et al., 2000; Di Martino et al., 2001; Thubrikar et al., 2001; Hua et al., 2001; Wang et al., 2002, Fillinger et al., 2002, 2003; Ventkatasubramaniam et al., 2004; Giannoglu et al., 2006; Leung et al., 2006; Papaharilaou et al., 2007; Speelman et al., 2007; Scotti et al., 2005, 2007; Truijers et al., 2007; Doyle et al., 2007, 2009a, 2009b, 2009c; Rissland et al., 2009), but have neglected experimental approaches to AAA rupture. Quantitatively assessing the stress within an AAA wall has many merits and has been shown to be superior to maximum diameter alone in predicting rupture (Fillinger et al., 2003). However, these high stress regions need to be assessed using experimental techniques to determine if FEA actually predicts the correct region of rupture. Reports by Doyle et al. (2008a, 2009d) presented comparative studies suggesting that FEA may accurately predict the high stress regions in idealised AAA models. This paper aims to examine this hypothesis experimentally in anatomically-correct AAAs. Experimental AAA models of silicone rubber were created using a reported technique (Doyle et al., 2008b), and then imaged using computed tomography (CT). 3D reconstructions of these CT data sets allow exact numerical models to be used in computational studies in order to validate the rupture sites observed experimentally.
METHODS
Study Subjects
Four computed tomography (CT) datasets for patients with AAA were included in this study. The CT data set information involved no extra participation by the patients and complied with the guidance of the local research ethics committee. All four patients had reached or exceeded the current 5 cm threshold for surgical repair, with the geometrical characteristics shown in Table 1. Work was also performed using an idealised AAA model that has been used extensively in previous studies by our group (Callanan et al., 2004; Morris et al., 2005; Doyle et al., 2008a, 2009d). This ideal AAA was developed using realistic dimensions obtained from the EUROSTAR data registry (Laheij et al., 2001).
Table 1.
Case details of AAA geometries used in study.
| Patient | Sex | Age | Maximum Diameter (cm) |
Total Length (cm) |
Volume (cm3) |
Surface Area (cm2) |
|---|---|---|---|---|---|---|
| Ideal | NA | NA | 5.0 | 26* | 188.9* | 275.3* |
| 1 | M | 78 | 6.1 | 15.2 | 192.4 | 185.4 |
| 2 | M | 70 | 5.7 | 14.8 | 221.9 | 222.6 |
| 3 | F | 65 | 5.6 | 13.7 | 152.3 | 166.1 |
| 4 | F | 67 | 5.3 | 13.6 | 137.9 | 155.2 |
Length, volume and surface area of idealised AAA includes 90mm section of aorta and iliac arteries.
3D Reconstruction Procedure
The technique of 3D reconstruction using Mimics v12 (Materialise, Belgium) in this work has been previously reported (Doyle et al., 2008b, 2009c). The intraluminal thrombus (ILT) was neglected in this study as with previous approaches (Vorp et al., 1998; Raghavan et al., 2000; Thubrikar et al., 2001; Fillinger et al., 2002, 2003; Scotti et al., 2005; Doyle et al., 2009a). The thickness of the aorta wall is not easily identifiable from CT scans, therefore the wall was assumed to be uniform throughout the model and for the purpose of mould design was set as 2 mm. The same degree of smoothing was applied to each reconstruction as previously reported (Doyle et al., 2007, 2008b). The iliac bifurcation was omitted from this study as it is believed its inclusion would not significantly alter the results (Fillinger et al., 2002).
AAA Model Creation
An effective method of manufacturing realistic AAA silicone rubber models was utilised (Doyle et al., 2008b). For each of the 5 geometries used in this study, 4 silicone rubber models were created with 2 being made from Sylgard 160 and 2 from Sylgard 170. In total, 20 silicone rubber AAA models (Sylgard 160, n=10; Sylgard 170, n=10) were created and tested. Figure 1 illustrates the visual difference along with the difference in mechanical behaviour between the two silicone materials. Also shown is the comparison in behaviour between these materials and that of AAA tissue reported by Raghavan and Vorp (2000).
Figure 1.
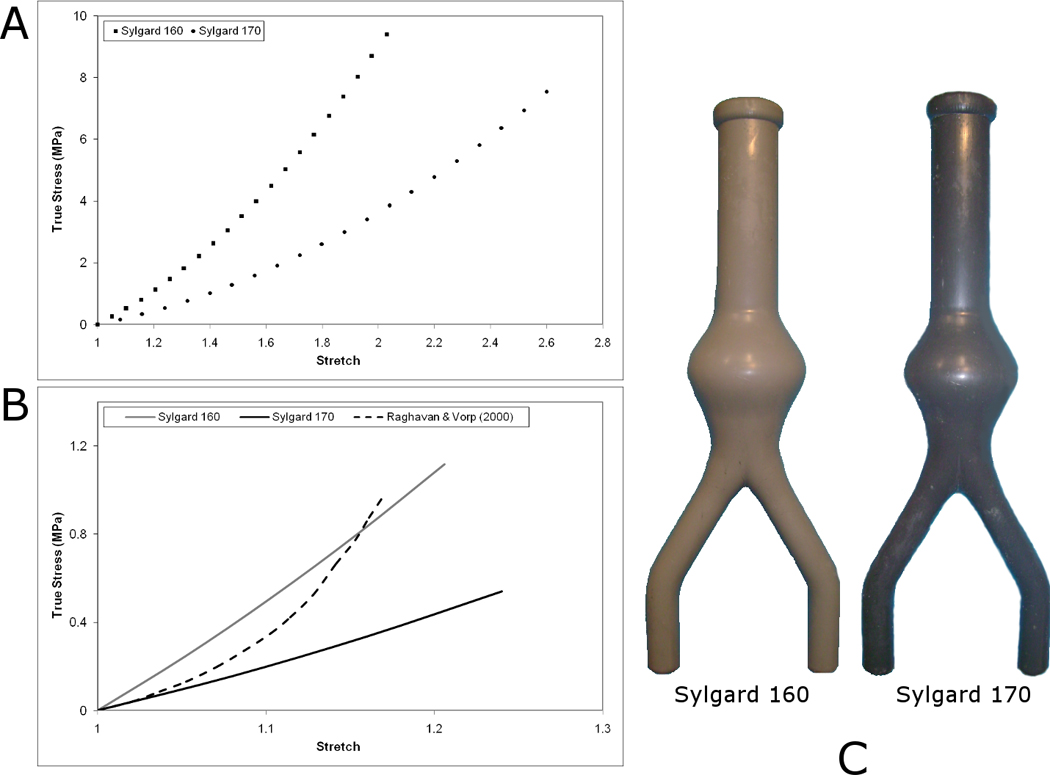
(A) Stress-strain response of Sylgard 160 and Sylgard 170 as determined in Doyle et al. (2009e). (B) Comparison of stress-strain responses between Sylgard materials and in vivo AAA tissue (Raghavan and Vorp, 2000) over the AAA tissue strain range. (C) Idealised AAA models created with Sylgard 160 and Sylgard 170. These commercially available silicone rubbers have different ultimate tensile strengths (UTS) according to the Dow Corning specification sheets (Sylgard 160 = 4 MPa; Sylgard 170 = 2 MPa) and are also different in appearance (Sylgard 160 = Grey; Sylgard 170 = Black). Uniaxial tensile testing together with numerical analyses deemed that a 1st order Ogden strain energy function (SEF) (Ogden, 1984) accurately describes both materials, with material coefficients for Sylgard 160: µ= 1.6525, α = 3.2395; and for Sylgard 170: µ= 0.6988, α = 2.9741 (Doyle et al. (2009e).
CT Scanning and 3D Reconstruction of Silicone AAA Models
Although the silicone rubber models are designed to have a uniform wall thickness, minor deviations may still exist (O’Brien et al., 2005; Doyle et al., 2008b). Each model was imaged using CT on a Siemens Somotom Sensation 64 (Siemens, Malvern, PA, USA) prior to testing. In order to obtain the most accurate image of each model, the slice increment was reduced to 0.5 mm with a pixel size of 0.287 mm. The 5 AAA geometries can be seen in Figure 2. The 3D reconstructions take into account any variations in wall thickness in the experimental models, thus enabling more accurate numerical models to be analysed.
Figure 2.
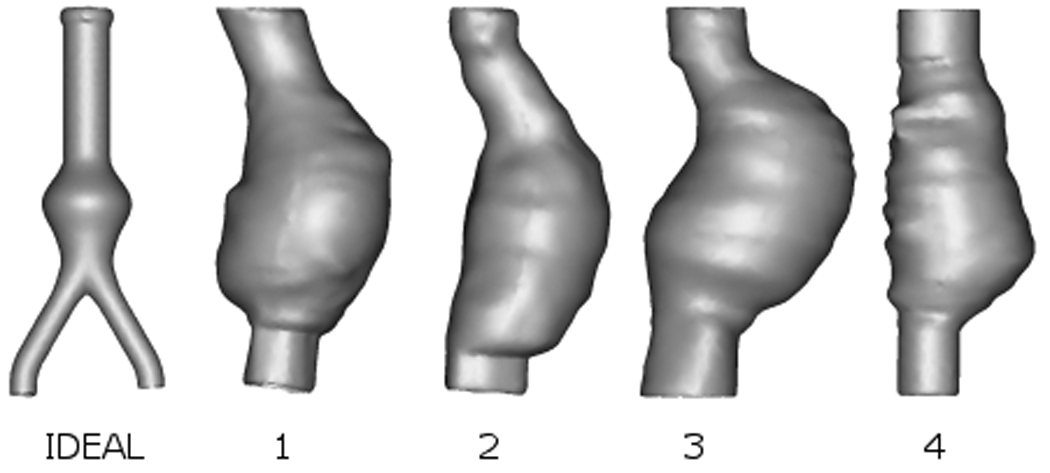
3D reconstructions showing various AAA geometries used. The ideal AAA is shown from the anterior and Patients 1–4 are shown from the right. Models are not shown to scale.
Experimental Modelling
An experimental test rig was designed allowing each model to be connected to a pneumatic air source and inflated to the point of rupture. A high-speed camera (Photron Fastcam SA1-1, Photron USA Inc.) was used at a frame rate of 2000 frames per second (fps). The positioning of a series of mirrors surrounding the experimental model enabled a full 360° view, ensuring that the position of rupture was captured by the high-speed camera. The internal pressure was increased so that the rupture of the model occurred within 240s of testing, in accordance with the standards BS ISO 1402 for burst pressure tests. Significance of rupture pressures and geometrical parameters were analysed using a Spearman’s Rho correlation test in SPSS 15 (SPSS Inc., Chicago, Ill, USA).
Computational Modelling
To correlate experimental and numerical results, the experiments were reproduced in the finite element solver ABAQUS v6.7 (Dassault Systemes, SIMULIA, Rhode Island, USA). 3D reconstructions from CT data sets of the silicone models were used in these analyses. These reconstructions allow identical numerical replications of the experimental models to be analysed, incorporating any variations in wall thickness in the model. Mesh independence was performed as previously published (Wang et al., 2002; Truijers et al., 2007; Doyle et al., 2007, 2009a, 2009b). Each model was rigidly constrained at the proximal and distal regions, and a uniform static air pressure applied to the internal surface of each model. The material properties used for these analyses were determined in a previous publication (Doyle et al., 2009e). Both Sylgard 160 and 170 were modelled using a 1st order Ogden strain energy function. For a full description of these materials, including material coefficients, the reader can refer to Doyle et al. (2009e). To examine if the location of elevated stresses altered with increasing internal pressure the idealised model was initially subjected to an internal pressure of 120 mmHg (16 kPa), and the location of elevated stresses recorded. The pressure was then increased in 60 mmHg (8 kPa) increments to 360 mmHg (48 kPa), and the locations of elevated stresses again recorded. For each numerical rupture test the mean rupture pressure for that set of models (Sylgard 160 = 650 mmHg and Sylgard 170 = 410 mmHg) was applied internally and the resulting von Mises wall stress examined.
Measurement of Wall Thickness
The variation in wall thickness in each of the five AAA geometries was examined using the CT images of the silicone models in Mimics v12. The process of measurement is shown in Figure 3. This methodology is based on previously published wall thickness reports of experimental rubber models (O’Brien et al., 2005; Doyle et al., 2008b, 2009d).
Figure 3.
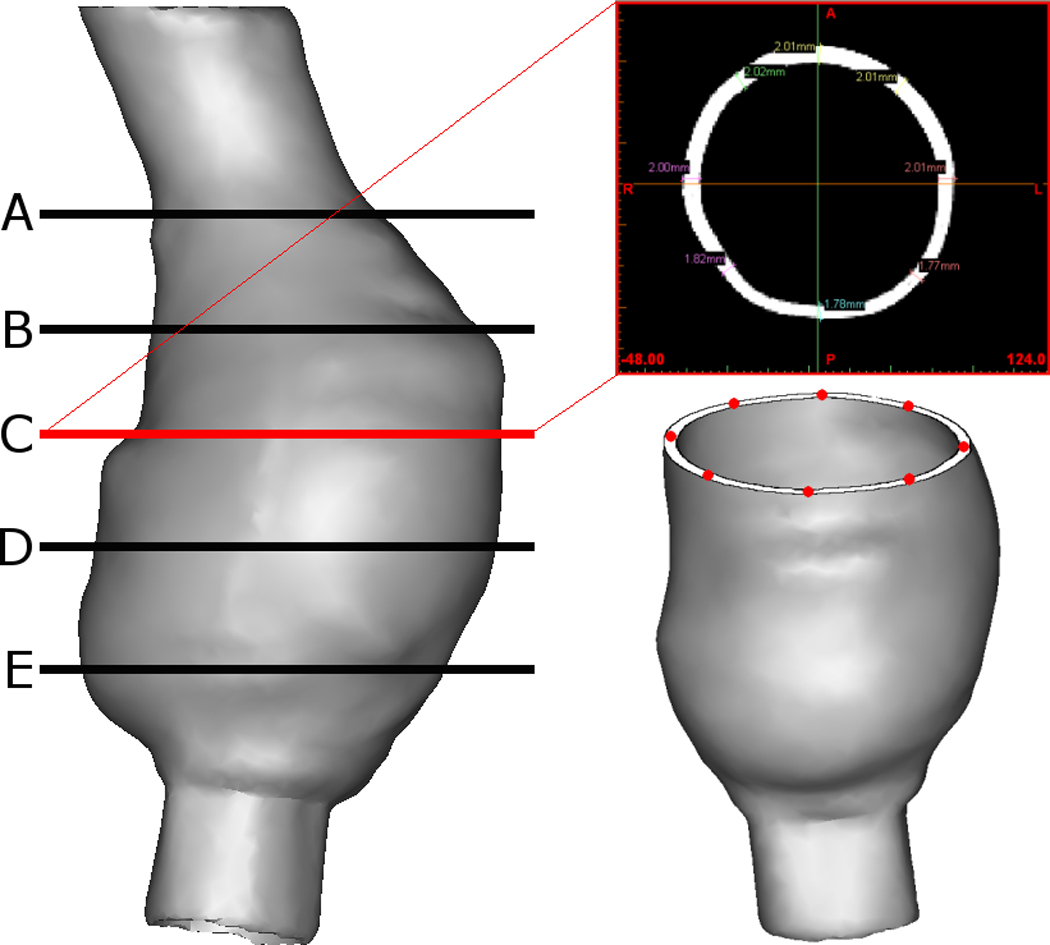
Method of measuring wall thickness. Example shown is Patient 1. Specific cross-sections are analysed using Mimics v12. The wall thickness was measured at eight equidistant points at five cross-sections along the length of the AAA. This resulted in 40 wall thickness measurements per model.
Qualitative Assessment of Rupture Locations
In order to qualitatively assess the rupture sites observed experimentally and computationally, a virtual grid was constructed around each model. The grid reference of each rupture site, and subsequent high stress regions could then be compared. Figure 4 shows this grid system with Patient 1 used as an example. In most cases only one view was necessary for each model to compare results.
Figure 4.
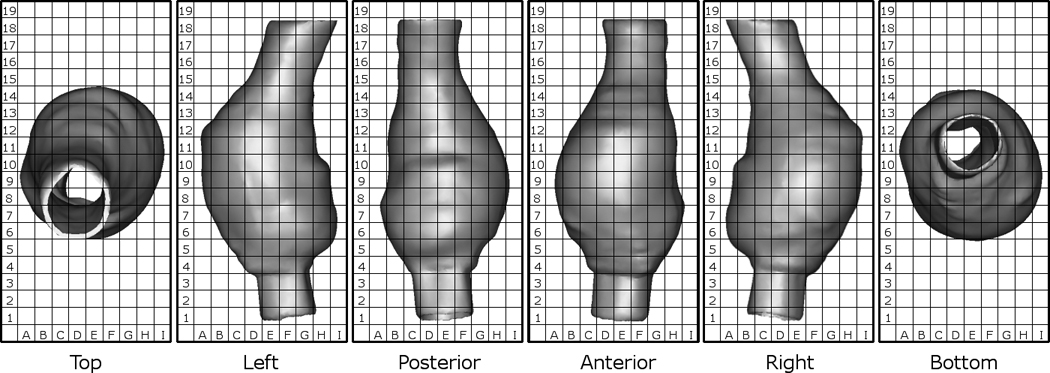
Grid system used to compare results between experimental and computational results. Example shown is Patient 1.
RESULTS
Experimental Modelling
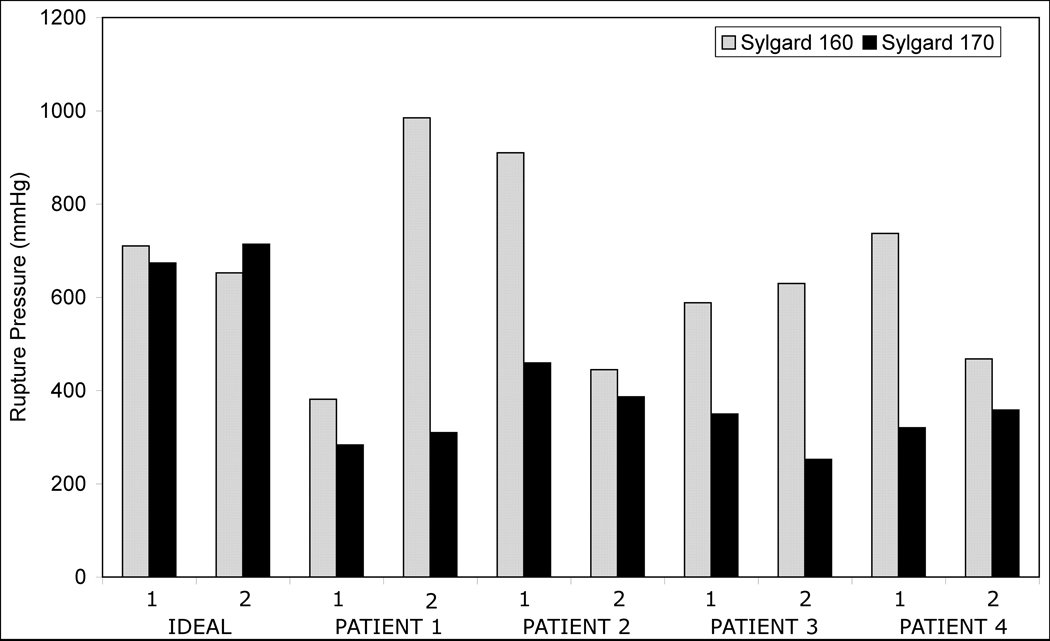
The results of the experimental rupture tests revealed a large range of burst pressures for the various AAA models as shown in Figure 5. Burst pressures were significantly lower (p=0.008) for the Sylgard 170 models compared to the Sylgard 160 models. Sylgard 160 models ruptured at a mean ± SD pressure of 650.6 ± 195.1 mmHg (range = 381.4 – 985 mmHg), whereas the weaker Sylgard 170 models ruptured at a mean ± SD pressure of 410.7 ± 159.9 mmHg (range = 252.2 – 714 mmHg). There was no statistical significance (p>0.05) between the burst pressure of the Sylgard 160 models and the geometrical parameters of Table 1 (Diameter, p=0.787; Length, p=0.684; Volume, p=0.893; Surface Area, p=0.684). Correlating the burst pressures of the Sylgard 170 models showed that there was a significant relationship (p<0.05) between burst pressure and surface area (p=0.036) but not between burst pressure and diameter, length or volume (Diameter, p=0.088; Length, p=0.229; Volume, p=0.538).
Figure 5.
Burst pressures for the various AAA models examined. On average, the AAA models created using the weaker silicone rubber (Sylgard 170) ruptured at lower pressures than those made using the stronger silicone (Sylgard 160).
Computational Modelling
Stress distributions do not significantly change with increasing internal pressures rather the magnitude of the wall stresses increase, as shown in Figure 6 for the Ideal AAA case. Figure 7 shows the stress contours observed in the AAA case of Patient 1. Again, with realistic geometries the overall stress distributions, in particular the high stress regions, remain the same independent of internal pressure. Table 2 presents the peak wall stresses and the peak wall stress as a percentage of the UTS (Sylgard 160 = 4 MPa; Sylgard 170 = 2 MPa) for each case. The Sylgard 160 numerical models were subjected to an internal pressure of 650 mmHg and the Sylgard 170 models to 410 mmHg, as these were the mean experimental rupture pressures. There was no correlation between the peak wall stress as a percentage of the UTS and the rupture pressure for that model. Mean peak wall stress ± standard deviation (SD) for the Sylgard 160 and Sylgard 170 models was 2.15 ± 0.26 MPa (range = 1.89 – 2.59 MPa) and 1.69 ± 0.38 MPa (range = 1.17 – 2.26 MPa), respectively.
Figure 6.
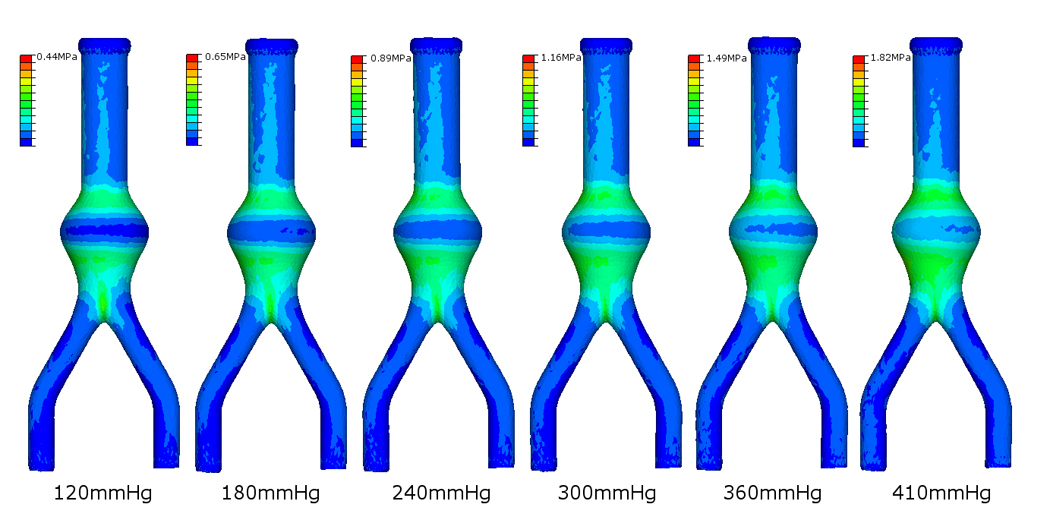
Stress distributions on the outer surface of the undeformed ideal AAA with increasing pressure loading.
Figure 7.
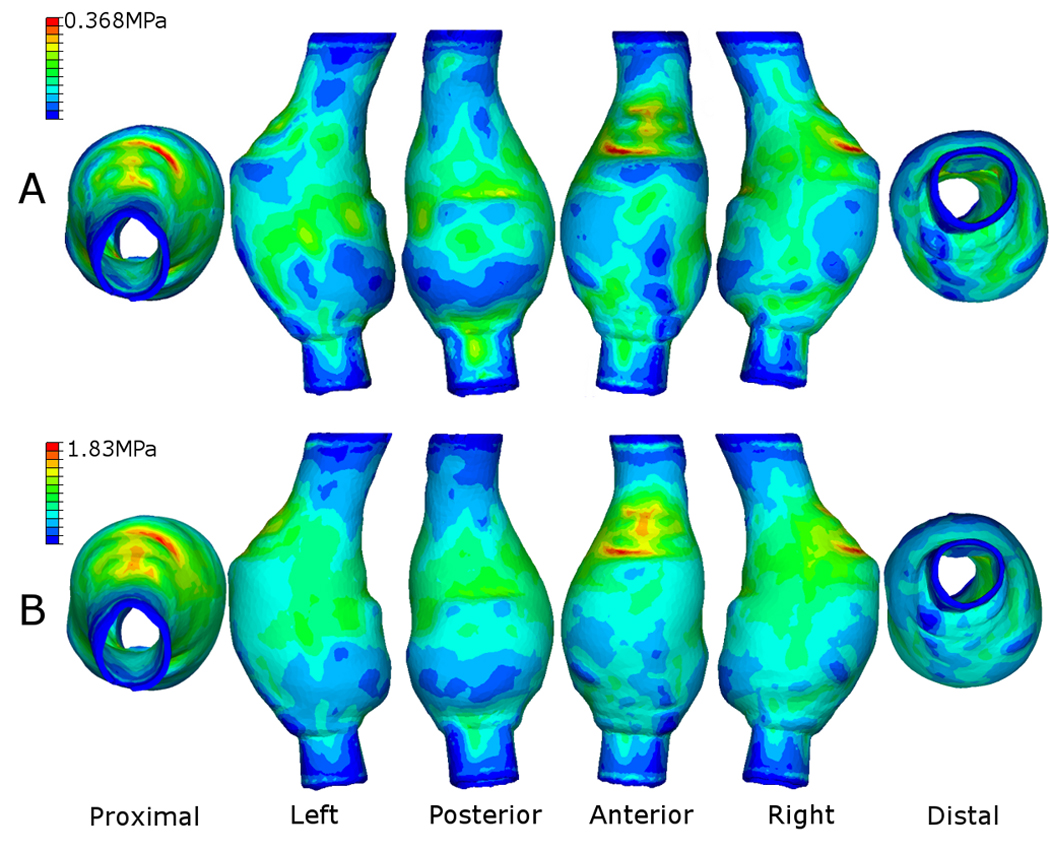
Resulting stress contours on the outer surface of the Sylgard 170 AAA of Patient 1. Internal pressure for this case was (A) 120 mmHg and (B) the average rupture pressure for the Sylgard 170 silicone rubber (410 mmHg). Similar stress distributions were observed for both high and low pressures. In this particular case, the proximal anterior region of the AAA experiences the peak wall stress, with elevated stresses (shown as green areas) also along the midsection of the left, right and posterior walls. Model shown in the undeformed state.
Table 2.
Peak wall stress results for each AAA case. Shown also is the rupture pressure and peak stress as a percentage of the UTS.
| Sylgard 160* | Sylgard 170** | |||||||
|---|---|---|---|---|---|---|---|---|
| Model | Peak Stress (MPa) |
Rupture Pressure (mmHg) |
% of UTS | Model | Peak Stress (MPa) |
Rupture Pressure (mmHg) |
% of UTS | |
| Ideal | 1 | 1.902 | 710 | 48 | 1 | 1.821 | 674 | 91 |
| 2 | 2.142 | 652 | 54 | 2 | 1.289 | 714 | 65 | |
| Patient 1 | 1 | 2.275 | 381 | 57 | 1 | 1.830 | 284 | 92 |
| 2 | 2.199 | 985 | 55 | 2 | 2.079 | 310 | 104 | |
| Patient 2 | 1 | 2.100 | 910 | 53 | 1 | 1.489 | 459 | 75 |
| 2 | 2.470 | 445 | 62 | 2 | 2.259 | 386 | 113 | |
| Patient 3 | 1 | 1.764 | 588 | 44 | 1 | 2.156 | 350 | 108 |
| 2 | 1.890 | 630 | 47 | 2 | 1.502 | 252 | 75 | |
| Patient 4 | 1 | 2.196 | 737 | 55 | 1 | 1.174 | 320 | 59 |
| 2 | 2.598 | 468 | 65 | 2 | 1.390 | 358 | 70 | |
Sylgard 160 models: Internal pressure = 650 mmHg; UTS = 4 MPa.
Sylgard 170 models: Internal pressure = 410 mmHg; UTS = 2 MPa.
Wall Thickness
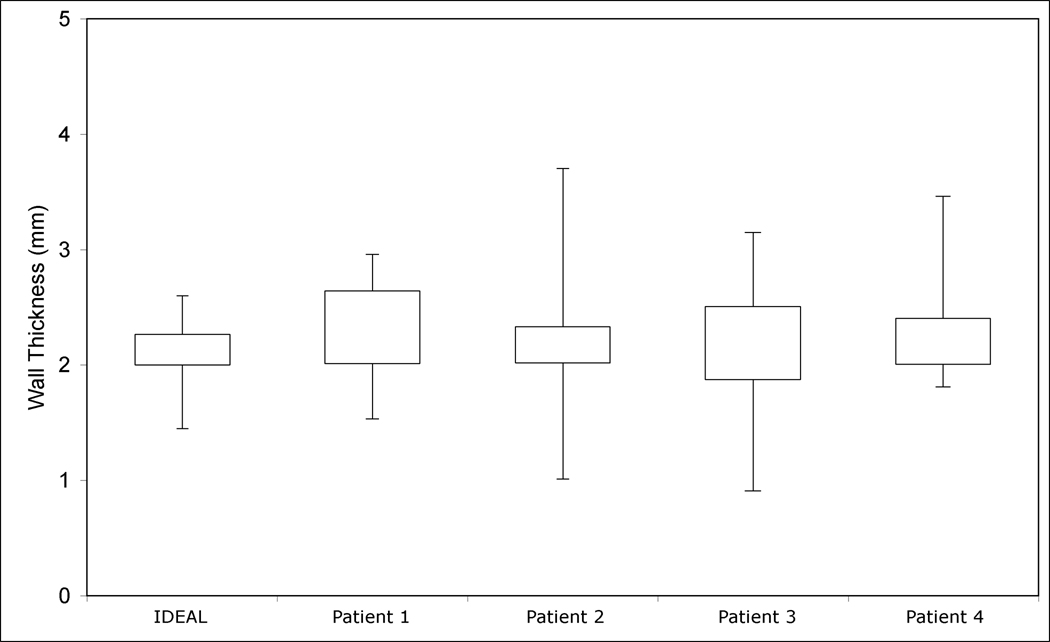
The results of the wall thickness study can be seen in Figure 8. The wall thickness was also measured at the exact site of rupture in each experimental model. These results are presented in Table 3 with the average rupture thicknesses compared to the average wall thickness. The wall thickness at the site of rupture was significantly lower (p=0.006) than the mean wall thickness of that model. The mean ± SD wall thickness at the rupture sites were 1.85 ± 0.33 mm and 1.71 ± 0.29 mm for the Sylgard 160 and Sylgard 170 materials, respectively. There was no relationship between rupture pressures and wall thickness at rupture site (Sylgard 160 models: p=0.688, Sylgard 170 models: p=0.881).
Figure 8.
Box and whisker plot showing wall thickness categorised by AAA case. The boxes indicate the 25th and 75th percentiles of the group, and the whiskers show maximum and minimum measurements. The mean ± SD wall thickness of all the five models (n=200) examined was 2.19 ± 0.40 mm. The maximum wall thickness was 3.7 mm and the minimum was 0.91 mm.
Table 3.
Wall thickness measurements at the site of experimental rupture, average wall thickness at the rupture site, mean wall thickness and the percentage difference for each model in the study.
| Sylgard 160 | Sylgard 170 | ||||||
|---|---|---|---|---|---|---|---|
| Model | Rupture Thickness (mm) |
Model | Rupture Thickness (mm) |
Mean Rupture Thickness (mm) |
Mean Wall Thickness (mm) |
% Difference |
|
| Ideal | 1 | 1.96 | 1 | 1.82 | 1.81 | 2.07 | 12.6 |
| 2 | 1.75 | 2 | 1.72 | ||||
| Patient 1 | 1 | 1.84 | 1 | 1.51 | 1.77 | 2.26 | 21.8 |
| 2 | 2.03 | 2 | 1.7 | ||||
| Patient 2 | 1 | 1.41 | 1 | 1.41 | 1.51 | 2.22 | 32.0 |
| 2 | 1.24 | 2 | 1.97 | ||||
| Patient 3 | 1 | 2.09 | 1 | 1.21 | 1.66 | 2.19 | 24.1 |
| 2 | 1.78 | 2 | 1.57 | ||||
| Patient 4 | 1 | 2.34 | 1 | 2.1 | 2.16 | 2.22 | 2.7 |
| 2 | 2.09 | 2 | 2.11 | ||||
Comparison of Rupture Locations
The experimental rupture locations agreed with regions of both peak and high numerical wall stress. Figure 9 shows a typical comparison of experimental rupture and computational results, in this case for Patient 1 (Sylgard 160, Model 2). The complete experimental and computational comparisons are shown in the Appendix. In two AAA models, the experimental rupture site did not correlate with numerical results, and were thus further analysed. Causes for the discrepancies are shown in Figure 10 and were a result of localised flaws in the experimental models. These flaws are discussed later.
Figure 9.
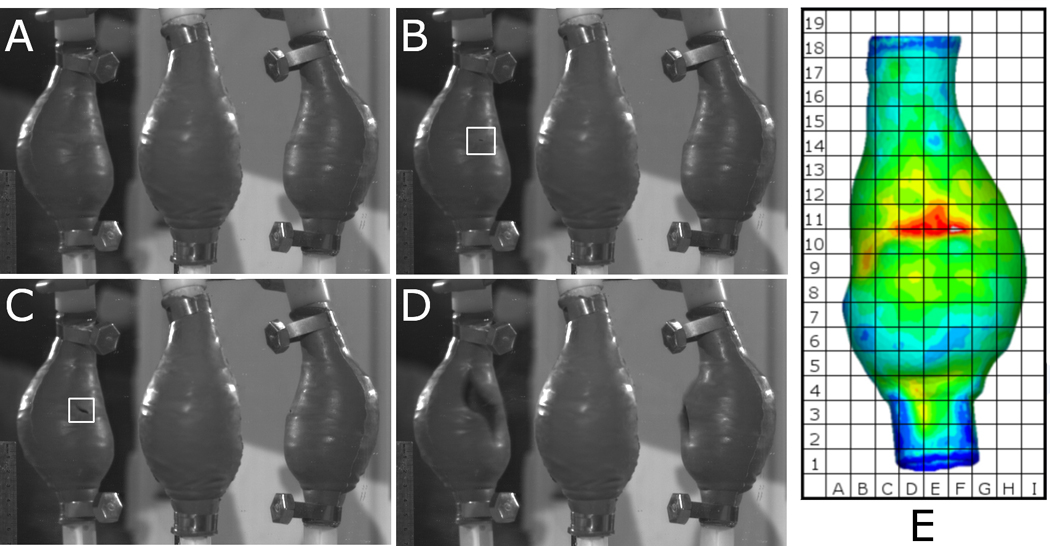
Typical sequence of events of rupture test compared to FEA predicted wall stress for Patient 1 Sylgard 160 Model 2. (A) Model is inflected with air, (B) silicone rubber fails (highlighted in figure), (C) tear develops (highlighted in figure) until (D) AAA model completely fails. The model in the centre of each image A–D is the original model, with the reflected views to either side. (E) Shows the numerically predicted wall stress of the same case.
Figure 10.

Causes for discrepancies in experimental and numerical rupture locations. (A) Analysis of CT scan at rupture location revealed a small tear in the wall of the silicone AAA model. (B) Typical cross-section of silicone AAA wall. (C) Entrapment of microscopic air bubbles at rupture site. Local wall defects can alter the location of rupture, shifting it from regions of elevated and peak wall stress to the sites of surface anomalies.
DISCUSSION
This study has explored experimental and computational techniques of determining rupture locations in abdominal aortic aneurysms. Five AAA geometries were examined, which had a mean diameter of 5.5 cm (range = 5.0 – 6.1 cm). The materials used in this study, although not identical in behaviour to in vivo AAA tissue, are adequate analogues that have been developed for experimental aneurysmal modelling (Doyle et al., 2009e) and may be the most suitable until more realistic materials are developed.
Experimental Modelling
Burst pressures were higher for the Sylgard 160 models (650.6 ± 195.1 mmHg) than the Sylgard 170 models (410 ± 159.9 mmHg) possibly due to the differences in material UTS. The ideal AAA models ruptured at the distal regions of inflection and not at regions of maximum diameter. These rupture locations are consistent with those previously reported (Doyle et al., 2008a, 2009d). All realistic AAA geometries also ruptured at regions of inflection. Only the Sylgard 160 models of Patient 1 ruptured at regions near the maximum diameter, although at these rupture locations there was a sharp localised change in curvature over a very short length. The location of rupture in other models varied. All rupture locations can be found in the Appendix.
Computational Modelling
It was noted that the locations of peak and elevated stress do not noticeably change with increasing pressure, but rather increase in magnitude (Figure 6 and Figure 7). Each model was subjected to the corresponding mean experimental rupture pressure (Sylgard 160 models = 650.6 ± 195.1 mmHg and Sylgard 170 models = 410 ± 159.9 mmHg). Stress distributions on the realistic AAA geometries of Patients 1 – 4 revealed that an AAA may have several regions of elevated stress. These high stress regions are due to the morphology of the particular AAA and also minor variations in wall thickness from the manufacturing process. Figure 7 illustrates how a particular AAA geometry may have several regions of elevated wall stress, indicating possible rupture sites. The minor changes in stress distributions between the physiological pressure (120 mmHg) and the high pressure (410 mmHg) shown in Figure 7 are due to t he significant changes in geometry at high internal pressures. There was no relationship between models rupturing at lower pressures and the numerical results showing higher percentages of the UTS. As shown in Table 2 the peak wall stress did not exceed the UTS of the material for the Sylgard 160 models and exceeded the UTS for only 30% of the Sylgard 170 models. This may be due to the numerical models neglecting any microscopic flaws. Although the numerical models exactly replicate the experimental models in terms of geometry obtained from the CT scans, microscopic air bubbles may be present in the experimental models, thus resulting in the FEA results under-estimating the peak stress at a specific internal pressure. As a result of this, numerical models may have lower UTS values than their experimental counterparts and this reflected in the computational results.
Wall Thickness
The mean ± SD wall thickness observed (2.19 ± 0.4 mm) may be higher than the original 2 mm design due to the contraction of the wax model upon solidification, whereas, the large range in wall thickness (0.91 – 3.7 mm) may be attributed to the positioning of the wax model inside the outer mould. The wall thickness at specific rupture sites, along with the average wall thickness and average rupture thickness for each model are presented in Table 3. There was no relationship shown between wall thickness and burst pressure (Sylgard 160 models, p=0.688, Sylgard 170 models, p=0.881). The mean wall thickness at the rupture sites were 1.85 ± 0.33 mm and 1.71 ± 0.29 mm for the Sylgard 160 and Sylgard 170 materials, respectively. These values represent a difference in rupture site wall thickness to the measured mean wall thickness (2.19 mm) of 16% and 22% for the Sylgard 160 and Sylgard 170 models, respectively. On a more model-specific basis, the average rupture thickness differed from the average wall thickness by 12.6%, 21.8%, 32%, 24% and 2.7% for the Ideal AAA model, Patient 1, Patient 2, Patient 3 and Patient 4, respectively.
Comparison of Rupture Locations
Figure 9 compares the experimental rupture site with the numerically predicted wall stress for one case. In 90% (18/20) of models the rupture locations agreed with the high stress regions predicted using FEA. Of the models that did correlate with regions of elevated stress, 16/18 (89%) ruptured at regions of FEA predicted peak wall stress, resulting in peak wall stress accurately predicting the rupture location in 80% (16/20) of all cases examined. The full comparison of rupture sites and wall stress are shown in the Appendix. Local wall defects (Figure 10) observed in 10% (2/20) of the models can alter the location of rupture, shifting it from regions of elevated and peak wall stress to the sites of surface anomalies.
Significance of Results
It is understood that an AAA will fail when the wall stress exceeds the wall strength, with wall thickness and heterogeneity of the wall contributing to rupture. Peak stress is still regarded as the primary outcome of FEA when analysing AAAs, but posterior wall stress (Doyle et al., 2009a) or the 99th percentile of peak stress (Speelman et al., 2008) may also provide guidance on AAA burst behaviour. The strength of the AAA wall is believed to be patient-specific with recent reports of methods to statistically predict strength based on relevant risk factors (Vande Geest et al., 2006). Rupture of AAAs may also be dependent on wall heterogeneity. As witnessed in this study, AAAs will fail at regions where the wall is locally damaged or defected. The situation presented here, where two models failed due to defects in the wall can be compared to the in vivo setting of AAAs. Calcifications (Speelman et al., 2007; Li et al., 2008), blebs (Hunter et al., 1989) and localised hypoxia (Vorp et al., 2001) all affect the AAA wall. Calcifications have been shown to act as stress raisers in the diseased wall (Speelman et al., 2007) by creating regions of material mismatch. Tears could propagate at these boundaries resulting in failure of the either the in vivo AAA, or the experimental model if calcifications are incorporated into the analogue. The flaws observed in the models examined here are more akin to blebs or hypoxic regions, as the wall itself is weakened rather than a calcification analogue.
Although wall thickness does influence wall stress, it may not influence rupture to the same extent. Even though there were significant differences (p=0.006) in the wall thickness at rupture sites compared to the average wall thickness of that model, the minimum wall thickness observed in this study was 0.91 mm, yet this region did not experience rupture. Models did not necessarily rupture at the thinnest region. Therefore, in vivo, thin walled regions may be strong enough to withstand the pulsatile forces of the cardiac cycle, whereas thicker regions may be weaker due to conditions such as those previously mentioned, and vice versa. Therefore, not only is wall strength a key factor of rupture, but surface anomalies may influence the location of AAA rupture.
This work is not without limitations. The number of cases examined is low and therefore statistical significance was not achieved. Increasing the numbers of models per AAA geometry may enhance the results and highlight any significant relationships in rupture potential. Static air pressure was used to pressurise the inner surface of the experimental models. In vivo the AAA is subjected to a cyclic pulse of pressure and fluid force, factors which were neglected in this study. The arterial wall analogue could be improved to create more realistic material properties and non-uniform wall strength (Raghavan et al., 2006). Also, the method of wall thickness measurement could be improved as it may be currently overestimating values using the reported methodology. This current technique is limited to the parallel nature of CT scans, whereas, if measurements were obtained perpendicular to the centreline of the AAA, determination of wall thickness may be more accurate. The reconstructions used in this study are based on CT scans that were not cardiac-gated which can sometimes result in poor reconstructions. It is possible to correct for this using smoothing methods like those employed here (Doyle et al., 2007) but surface irregularities can still remain and a slight “wrinkling” of the surface can be seen. Future work should only use cardiac-gated CT scans to eliminate this issue. The results and conclusions presented here are based on silicone models of AAAs which are arguably not comparable to real AAAs due to the diseased nature of the in vivo AAA wall. Ultimately it is hoped to apply the methodologies reported here to excised whole AAAs from cadavers and examine if numerical tools still accurately predict locations of rupture.
CONCLUSIONS
Experimental modelling determined that AAAs rupture at regions of elevated wall stress and not at regions of maximum diameter. These rupture locations were confirmed using the finite element method. Computational results indicate several regions of elevated wall stress in AAA geometries, with rupture occurring at the location of peak stress in 80% (16/20) of models. Surface defects affect rupture location, moving the site of rupture away from the regions of high wall stress to the defected region. The results presented here, along with the future work using actual AAAs, may further contribute to the understanding of AAA biomechanics and ultimately AAA rupture prediction.
Supplementary Material
ACKNOWLEDGEMENTS
The authors would like to acknowledge our funding sources (i) the Irish Research Council for Science, Engineering and Technology (IRCSET) Grant RS/2005/340 and (ii) Grant #R01-HL-060670 from the US National Heart Lung and Blood Institute. The authors would also like to thank the contribution of (iii) Joseph Muthu, Departments of Surgery and Bioengineering, Centre for Vascular Remodelling and Regeneration, University of Pittsburgh, USA, and (iv) Dr. Fintan Wallis and Gena Nicholas from the Department of Radiology, HSE Midwestern Regional Hospital, Limerick, Ireland.
Footnotes
Publisher's Disclaimer: This is a PDF file of an unedited manuscript that has been accepted for publication. As a service to our customers we are providing this early version of the manuscript. The manuscript will undergo copyediting, typesetting, and review of the resulting proof before it is published in its final citable form. Please note that during the production process errors may be discovered which could affect the content, and all legal disclaimers that apply to the journal pertain.
REFERENCES
- Bengtsson H, Sonesson B, Bergqvist D. Proceedings, Volume 800 of the Annals of the New York Academy of Sciences, United States. 1996. Incidence and prevalence of abdominal aortic aneurysms, estimated by necroscopy studies and population screening by ultrasound. [DOI] [PubMed] [Google Scholar]
- Callanan A, Morris LG, McGloughlin TM. European Society of Biomechanics. Netherlands: S-Hertogenbosch; 2004. Numerical and experimental analysis of an idealised abdominal aortic aneurysm. [Google Scholar]
- Cronenwett JL, Murphy TF, Zelenock GB, Whitehouse WM, Jr, Lindenauer SM, Graham LM, Quint LE, Silver TM, Stanley JC. Actuarial analysis of variables associated with rupture of small abdominal aortic aneurysms. Surgery. 1985;98:472–483. [PubMed] [Google Scholar]
- Darling RC, Messina CR, Brewster DC, Ottinger LW. Autopsy study of unoperated abdominal aortic aneurysms. The case for early resection. Circulation. 1977;56(2):161–164. [PubMed] [Google Scholar]
- DiMartino ES, Guadagni G, Fumero A, Ballerini G, Spirito R, Biglioli P, Redaelli A. Fluid-structure interaction within realistic 3D models of aneurysmatic aorta as a guidance to assess the risk of rupture of the aneurysm. Medical Engineering and Physics. 2001;23:647–655. doi: 10.1016/s1350-4533(01)00093-5. [DOI] [PubMed] [Google Scholar]
- Doyle BJ, Callanan A, McGloughlin TM. A comparison of modelling techniques for computing wall stress in abdominal aortic aneurysms. Biomedical Engineering Online. 2007;6:38. doi: 10.1186/1475-925X-6-38. [DOI] [PMC free article] [PubMed] [Google Scholar]
- Doyle BJ, Callanan A, Corbett TJ, Cloonan AJ, O’Donnell MR, Vorp DA, McGloughlin TM. The use of silicone to model abdominal aortic aneurysm behaviour; Society of Plastics Engineers, SPE European Conference on Medical Polymers; 2008a. pp. 115–120. [Google Scholar]
- Doyle BJ, Morris LG, Callanan A, Kelly P, Vorp DA, McGloughlin TM. 3D reconstruction and manufacture of real abdominal aortic aneurysms: From CT scan to silicone model. Journal of Biomechanical Engineering. 2008b;130 doi: 10.1115/1.2907765. 034501. [DOI] [PubMed] [Google Scholar]
- Doyle BJ, Callanan A, Burke PE, Grace PA, Walsh MT, Vorp DA, McGloughlin TM. Vessel asymmetry as an additional tool in the assessment of abdominal aortic aneurysms. Journal of Vascular Surgery. 2009a;49:443–454. doi: 10.1016/j.jvs.2008.08.064. [DOI] [PMC free article] [PubMed] [Google Scholar]
- Doyle BJ, Callanan A, Walsh MT, Grace PA, McGloughlin TM. A finite element analysis rupture index (FEARI) as an additional tool for abdominal aortic aneurysm rupture prediction. Vascular Disease Prevention. 2009b;6:114–121. [Google Scholar]
- Doyle BJ, Grace PA, Kavanagh EG, Burke PE, Wallis F, Walsh MT, McGloughlin TM. Improved assessment and treatment of abdominal aortic aneurysms: The use of 3D reconstructions as a surgical guidance tool in endovascular repair. Irish Journal of Medical Science. 2009c;178(3):321–328. doi: 10.1007/s11845-009-0318-4. [DOI] [PubMed] [Google Scholar]
- Doyle BJ, Corbett TJ, Callanan A, Walsh MT, Vorp DA, McGloughlin TM. An experimental and numerical comparison of the rupture locations of an abdominal aortic aneurysm. Journal of Endovascular Therapy. 2009d;16:322–335. doi: 10.1583/09-2697.1. [DOI] [PMC free article] [PubMed] [Google Scholar]
- Doyle BJ, Corbett TJ, Cloonan AJ, O’Donnell MR, Walsh MT, Vorp DA, McGloughlin TM. Experimental Modelling of Abdominal Aortic Aneurysms: Novel Applications of Silicone Rubbers. Medical Engineering & Physics. 2009e doi: 10.1016/j.medengphy.2009.06.002. in press. DOI: 10.1016/j.medengphy.2009.06.002. [DOI] [PMC free article] [PubMed] [Google Scholar]
- Fillinger MF, Marra SP, Raghavan ML, Kennedy FE. Prediction of rupture risk in abdominal aortic aneurysm during observation: wall stress versus diameter. Journal of Vascular Surgery. 2003;37:724–732. doi: 10.1067/mva.2003.213. [DOI] [PubMed] [Google Scholar]
- Fillinger MF, Raghavan ML, Marra SP, Cronenwett JL, Kennedy FE. In vivo analysis of mechanical wall stress and abdominal aortic aneurysm rupture risk. Journal of Vascular Surgery. 2002;36:589–597. doi: 10.1067/mva.2002.125478. [DOI] [PubMed] [Google Scholar]
- Giannoglu G, Giannakoulas G, Soulis J, Chatzizisis Y, Perdikides T, Melas N, Parcharidis G, Louridas G. Predicting the risk of rupture of abdominal aortic aneurysms by utilizing various geometrical parameters: Revisiting the diameter criterion. Angiology. 2006;57(4):487–494. doi: 10.1177/0003319706290741. [DOI] [PubMed] [Google Scholar]
- Glimaker H, Holmberg L, Elvin A, Nybacka O, Almgren B, Bjorck CG, Eriksson I. Natural history of patients with abdominal aortic aneurysm. European Journal of Vascular Surgery. 1991;5:125–130. doi: 10.1016/s0950-821x(05)80675-9. [DOI] [PubMed] [Google Scholar]
- Hua J, Mower WR. Simple geometric characteristics fail to reliably predict abdominal aortic aneurysm wall stress. Journal of Vascular Surgery. 2001;34:308–315. doi: 10.1067/mva.2001.114815. [DOI] [PubMed] [Google Scholar]
- Hunter GC, Leong SC, Yu GS, McIntyre KE, Bernhard VM. Aortic blebs: Possible site of aneurysm rupture. Journal of Vascular Surgery. 1989;10(1):93–99. [PubMed] [Google Scholar]
- Kleinstreuer C, Li Z. Analysis and computer program for rupture-risk prediction of abdominal aortic aneurysms. Biomedical Engineering Online. 2006;5:19. doi: 10.1186/1475-925X-5-19. [DOI] [PMC free article] [PubMed] [Google Scholar]
- Laheij R, van Marrewijk C, Buth J. Progress report on the procedural and follow up results of 3413 patients who received stent graft treatment for infrarenal aortic aneurysms for a period of 6 years. EUROSTAR Data Registry Centre. 2001 [Google Scholar]
- Leung JH, Wright AR, Cheshire N, Crane J, Thom SA, Hughes AD, Xu Y. Fluid structure interaction of patient specific abdominal aortic aneurysms: a comparison with solid stress models. Biomedical Engineering Online. 2006;5:33. doi: 10.1186/1475-925X-5-33. [DOI] [PMC free article] [PubMed] [Google Scholar]
- Li ZY, U-King-Im J, Tang TY, Soh E, See TC, Gillard JH. Impact of calcification and intraluminal thrombus on the computed wall stresses of abdominal aortic aneurysm. Journal of Vascular Surgery. 2008;47:928–935. doi: 10.1016/j.jvs.2008.01.006. [DOI] [PubMed] [Google Scholar]
- Morris L, O’Donnell P, Delassus P, McGloughlin T. Experimental assessment of stress patterns in abdominal aortic aneurysms using the photoelastic method. Strain. 2004;40:165–172. [Google Scholar]
- Mower WR, Quinones WJ, Gambhir SS. Effect of intraluminal thrombus on abdominal aortic aneurysm wall stress. Journal of Vascular Surgery. 1997;26:602–608. doi: 10.1016/s0741-5214(97)70058-2. [DOI] [PubMed] [Google Scholar]
- Nicholls SC, Gardner JB, Meissner MH, Johansen HK. Rupture in small abdominal aortic aneurysms. Journal of Vascular Surgery. 1998;28:884–888. doi: 10.1016/s0741-5214(98)70065-5. [DOI] [PubMed] [Google Scholar]
- O’Brien T, Morris L, O’Donnell M, Walsh M, McGloughlin T. Injection-moulded models of major and minor arteries: The variability of model wall thickness owing to casting technique. Proceedings of the International Mechanical Engineers 219, Part H: Journal of Engineering in Medicine. 2005 doi: 10.1243/095441105X34347. [DOI] [PubMed] [Google Scholar]
- Ogden RW. Nonlinear elastic deformations. Mineola, NY, USA: Dover Publication Inc; 1984. [Google Scholar]
- Papaharilaou Y, Ekaterinaris JA, Manoussaki E, Katsamouris AN. A decoupled fluid structure approach for estimating wall stress in abdominal aortic aneurysms. Journal of Biomechanics. 2007;40:367–377. doi: 10.1016/j.jbiomech.2005.12.013. [DOI] [PubMed] [Google Scholar]
- Raghavan ML, Vorp DA, Federle MP, Makaroun MS, Webster MW. Wall stress distribution on three-dimensionally reconstructed models of human abdominal aortic aneurysm. Journal of Vascular Surgery. 2000;31:760–769. doi: 10.1067/mva.2000.103971. [DOI] [PubMed] [Google Scholar]
- Raghavan ML, Kratzberg J, de Tolosa EMC, Hanaoka MM, Walter P, da Silva ES. Regional distribution of wall thickness and failure properties of human abdominal aortic aneurysm. Journal of Biomechanics. 2006;39(16):3010–3016. doi: 10.1016/j.jbiomech.2005.10.021. [DOI] [PubMed] [Google Scholar]
- Rissland P, Alemu Y, Einav S, Ricotta J, Bluestein D. Abdominal aortic aneurysm risk of rupture: Patient-specific FSI simulations using anisotropic model. Journal of Biomechanical Engineering. 2009;131:031001–0310010. doi: 10.1115/1.3005200. [DOI] [PubMed] [Google Scholar]
- Sacks MS, Vorp DA, Raghavan ML, Federle MP, Webster MW. In vivo three-dimensional surface geometry of abdominal aortic aneurysms. Annals of Biomedical Engineering. 1999;27:469–479. doi: 10.1114/1.202. [DOI] [PubMed] [Google Scholar]
- Sayers RD. Aortic aneurysms, inflammatory pathways and nitric oxide. Annals of the Royal College of Surgeons England. 2002;84(4):239–246. doi: 10.1308/003588402320439667. [DOI] [PMC free article] [PubMed] [Google Scholar]
- Scotti CM, Shkolnik AD, Muluk SC, Finol E. Fluid-structure interaction in abdominal aortic aneurysms: effect of asymmetry and wall thickness. Biomedical Engineering Online. 2005;4:64. doi: 10.1186/1475-925X-4-64. [DOI] [PMC free article] [PubMed] [Google Scholar]
- Scotti CM, Finol EA. Compliant biomechanics of abdominal aortic aneurysms: a fluid-structure interaction study. Computers and Structures. 2007;85:1097–1113. [Google Scholar]
- Speelman L, Bohra A, Bosboom EMH, Schurink GWH, van de Vosse FN, Makaroun MS, Vorp DA. Effects of wall calcifications in patient-specific wall stress analyses of abdominal aortic aneurysms. Journal of Biomechanical Engineering. 2007;129:1–5. doi: 10.1115/1.2401189. [DOI] [PubMed] [Google Scholar]
- Speelman L, Bosboom EMH, Schurink GWH, Hellenthal FAMVI, Buth J, Breeuwer M, Jacobs MJ, van de Vosse FN. Patient-specific AAA wall stress analysis: 99-percentile versus peak stress. European Journal of Vascular and Endovascular Surgery. 2008;36(6):668–676. doi: 10.1016/j.ejvs.2008.09.007. [DOI] [PubMed] [Google Scholar]
- Thubrikar MJ, Al-Soudi J, Robicsek F. Wall stress studies of abdominal aortic aneurysm in a clinical model. Annals of Vascular Surgery. 2001;15:355–366. doi: 10.1007/s100160010080. [DOI] [PubMed] [Google Scholar]
- Truijers M, Pol JA, SchultzeKool LJ, van Sterkenburg SM, Fillinger MF, Blankensteijn JD. Wall stress analysis in small asymptomatic, symptomatic and ruptured abdominal aortic aneurysms. European Journal of Vascular and Endovascular Surgery. 2007;33:401–407. doi: 10.1016/j.ejvs.2006.10.009. [DOI] [PubMed] [Google Scholar]
- Vande Geest JP, Di Martino ES, Bohra A, Makaroun MS, Vorp DA. A biomechanics-based rupture potential index for abdominal aortic aneurysm risk assessment. Annals of the New York Academy of Science. 2006;1085:11–21. doi: 10.1196/annals.1383.046. [DOI] [PubMed] [Google Scholar]
- Vande Geest JP, Wang DHJ, Wisniewski SR, Makaroun MS, Vorp DA. Towards a non-invasive method for determination of patient-specific wall strength distribution in abdominal aortic aneurysms. Annals of Biomedical Engineering. 2006;34(7):1098–1106. doi: 10.1007/s10439-006-9132-6. [DOI] [PubMed] [Google Scholar]
- Venkatasubramaniam AK, Fagan MJ, Mehta T, Mylankal KJ, Ray B, Kuhan G, Chetter IC, McCollum PT. A comparative study of aortic wall stress using finite element analysis for ruptured and non-ruptured abdominal aortic aneurysms. European Journal of Vascular and Endovascular Surgery. 2004;28:168–176. doi: 10.1016/j.ejvs.2004.03.029. [DOI] [PubMed] [Google Scholar]
- Vorp DA, Raghavan ML, Webster MW. Mechanical wall stress in abdominal aortic aneurysm: influence of diameter and asymmetry. Journal of Vascular Surgery. 1998;27(4):632–639. doi: 10.1016/s0741-5214(98)70227-7. [DOI] [PubMed] [Google Scholar]
- Vorp DA, Lee PC, Wang DHJ, Makaroun MS, Nemoto EM, Ogawa S, Webster MW. Association of intraluminal thrombus in abdominal aortic aneurysm with local hypoxia and wall weakening. Journal of Vascular Surgery. 2001;34:291–299. doi: 10.1067/mva.2001.114813. [DOI] [PubMed] [Google Scholar]
- Vorp DA. Biomechanics of abdominal aortic aneurysm. Journal of Biomechanics. 2007;40:1887–1902. doi: 10.1016/j.jbiomech.2006.09.003. [DOI] [PMC free article] [PubMed] [Google Scholar]
- Wang DHJ, Makaroun MS, Webster MW, Vorp DA. Effect of intraluminal thrombus on wall stress in patient-specific models of abdominal aortic aneurysm. Journal of Vascular Surgery. 2002;36:598–604. doi: 10.1067/mva.2002.126087. [DOI] [PubMed] [Google Scholar]
Associated Data
This section collects any data citations, data availability statements, or supplementary materials included in this article.


