Abstract
The authors have developed a new lithographically based patterning process which significantly increases the throughput of experiments which probe how repair proteins scan DNA molecules for errors. In this process, nanoscale barriers are formed to interrupt the flow of a lipid bilayer in which DNA is tethered to proteins in the bilayer. The barriers trap the DNA, which is then stretched out by hydrodynamic flow, resulting in the formation of “DNA curtains.” Nanoimprint lithography is used to facilitate massively parallel data collection for protein diffusion experiments on DNA.
I. INTRODUCTION
Living cells employ several mechanisms to repair defects which occur in DNA. For example, the proteins Rad51 and Rdh54 help repair DNA double-strand breaks leading to breast cancer. Mismatch repair proteins such as the heterodimers Msh2-Msh6, Msh2-Msh3, and Mlh1-Pms2 identify and excise DNA base-pair mismatches that lead to colorectal cancer and tumors.1–3 Understanding the processes by which these proteins interact with DNA should lead to improved treatment of these diseases.
To directly visualize protein-DNA interactions, DNA molecules are stretched out in buffer flow in a flowcell, in a recently developed arrangement called “DNA curtains.”4–6 This method effectively isolates individual DNA molecules for observation via total internal reflection fluorescence microscopy (TIRFM). To illuminate DNA and proteins tagged with fluorescent dyes and quantum dots, TIRF microscopy utilizes the evanescent field that is generated beyond a reflective surface present at the interface between two transparent materials with different refractive indices (e.g., a silica slide and the aqueous buffer solution). The DNA curtains are formed by flowing the DNA in a lipid bilayer across nanoscale barriers. The flow chamber is constructed from a fused silica slide patterned with nanoscale linear barriers oriented perpendicular to the flow. The barriers are tall, i.e., tall enough to interrupt the lipid bilayer, which is a few nanometers thick. DNA strands are linked by one end to proteins in the floating lipid bilayer. When buffer flow is applied, the DNA strands are elongated by the flow, and are mechanically tethered to the linear barriers. They can also be observed in the absence of buffer flow using double-tethered DNA curtains. In this case, antibody fragments are nonspecifically bound to part of the nanopattern. The DNA strands’ free ends are tagged with complementary antigens, which bind to the antibodies when buffer flow is on. When flow is subsequently turned off, the DNA array remains; strands are mechanically tethered by the leading edge of the nanopattern and chemically attached at their far ends via antibody-antigen linkages. Quantum dot-tagged repair proteins can be observed as they move along the DNA strands. In this way, we can examine the mechanisms by which proteins scan DNA strands in order to find base-pair mismatches and double-strand breaks.
We have previously demonstrated that nanopatterned DNA curtains, formed by electron beam lithography, allow two orders of magnitude improvement over previous methods.2 However, making them via electron beam lithography proves time consuming and low throughput. Electron beam lithography is practical for prototyping designs, but not for production of large volumes of substrates. The purpose in using DNA arrays is to increase the throughput of DNA protein repair data by several orders of magnitude relative to past experiments. This can be further facilitated by nanoimprint lithography, which can streamline and scale up the fabrication process. Because TIRFM experiments require hundreds to thousands of slides per year, nanoimprint lithography is an important process for established DNA array designs.6 In this work, we describe our nanoimprint lithography process.
II. EXPERIMENT
Nanoimprint masters were fabricated using electron beam lithography, liftoff, and inductively coupled plasma etching. The electron beam resist was a double layer of polymethyl methacrylate (PMMA) ( and 495 000, Microchem) spun onto an oxidized silicon wafer. Patterns were written by an FEI Sirion scanning electron microscope outfitted with a Nabity pattern generation system. Single-tether patterns typically consisted of wide, long lines bracketed by linear guides, while double-tether patterns were typically long lines spaced apart from pentagons. The resist was developed in a mixture of isopropanol and methyl isobutyl ketone (3:1) at under ultrasonic agitation. Samples were then rinsed with isopropanol and dried with . A Semicore e-beam evaporator was used to evaporate Cr onto the masters. Lift-off was performed in acetone at . The patterned masters were then reactive ion etched to a depth of in a mixture of (45:5) for at a power of using an Oxford ICP etch tool. The nanoimprint masters were cleaned in a mixture of (5:1:1) at for . Finally, the masters were dip coated with a fluorinated self-assembled monolayer (Nanonex, Princeton, NJ) to prevent adhesion between the master and resist.
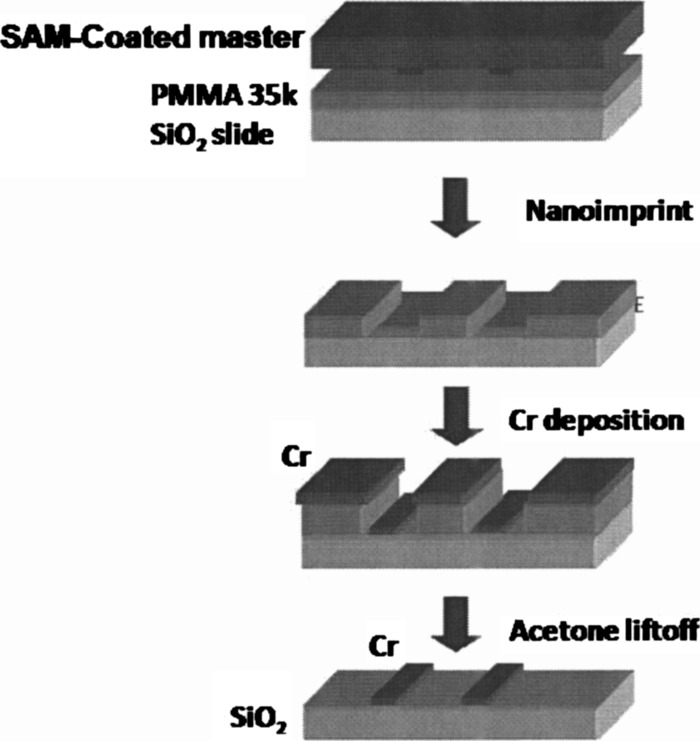
The nanoimprint lithography process flow is pictured in Fig. 1. PMMA (Microresist Technologies, Germany) was spin coated on a fused silica microscope slide and baked on a hotplate for at . Nanoimprinting was performed in two stages: a preimprint phase with a pressure of and temperature of , followed by a imprint phase at a pressure of and temperature of . This heats the PMMA well above its glass transition temperature and allows it to conform to the mold. After the imprinting, a descum process was done to remove of residual PMMA. The descum was performed in an Oxford ICP etch tool using (1:1) and a power of for (in two iterations of ). After the descum, of Cr was evaporated on the samples and lift-off was done in methylene chloride:acetone (9:1) at for several hours, followed by bath sonication to remove stray metal flakes. Finally, the patterned slides were rinsed in acetone and dried with .
FIG. 1.
Schematic of nanoimprint lithography process flow.
The flowcell assembly and TIRFM setup are described in Refs. 2 and 4–6. Prior to nanoimprinting, inlet and outlet holes were drilled into the slide using a drill press equipped with a diamond-tipped bit ( outer diameter, Kassoy). After barrier fabrication by nanoimprint lithography, the slides were cleaned by successive washing in 2%(v/v) Hellmanex, NaOH, and 100% MeOH, with sterilized water rinses between washes. The slides were then dried under a stream of nitrogen and baked in a vacuum oven for at least . A flowcell was assembled on the slide using a glass cover slip and thick double-sided tape , clamped together for in a vacuum oven.7 Inlet and outlet ports (Upchurch Scientific) were attached with hot-melt adhesive (Sure-Bonder glue sticks, FPC Corporation). A syringe pump (Kd Scientific) and actuated injection valves (Upchurch Scientific) controlled buffer delivery, selection, and flow rate. Sample temperature was regulated between 25 and using a custom-built heater with computer-controlled feedback regulation.
Single-tethered and double-tethered DNA curtains were constructed as described in Refs. 4 and 6, respectively. All lipids were purchased from Avanti Polar Lipids and liposomes were prepared as previously described.4 Briefly, a mixture of 1,2-dioleoylsn-glycero-phosphocholine, 0.5% biotinylated-DPPE (1,2-dipalmitoyl-sn-glycero-3-phosphoethanolamine--(cap biotinyl)), and 8% mPEG550-1,2-dioleoyl-sn-glycero-3-phosphoethanolamine--[methoxy(polyethylene glycol)-550] is used to form the bilayer, with the liposomes kept in the sample chamber for . Excess liposomes were flushed away in a buffer of tris-HCl ( 7.8) and NaCl. For double-tethered curtains, a solution of anti-DIG Fab (Roche) was injected into the flowcell and incubated for . The flowcell was then rinsed with buffer A ( tris-HCl ( 7.8), DTT, MgCl2, and BSA) and incubated for . Neutravidin in buffer A was then injected into the sample chamber and incubated for . After rinsing thoroughly with additional buffer A, biotinylated DNA prestained with YOYO1 was injected into the sample chamber and incubated for . Application of buffer flow caused the lipid-tethered DNA molecules to align along the leading edges of the nanoimprinted barriers.
The basic design of the TIRFM microscope is described in Ref. 8. The system was built around a Nikon TE2000U inverted microscope with a custom illumination system. The excitation source was a , diode-pumped solid-state laser (Coherent, Sapphire-CDHR), attenuated as necessary with a neutral density filter and centered over the DNA curtain using a mirror (New Focus). At the face of the prism, the typical beam intensity was . Images were detected with a back-illuminated EMCCD detector (Photometrics, Cascade 512B). Unless otherwise indicated, TIRFM images were obtained using a water immersion objective lens (Nikon, 1.2NAPlan Apo).
III. RESULTS
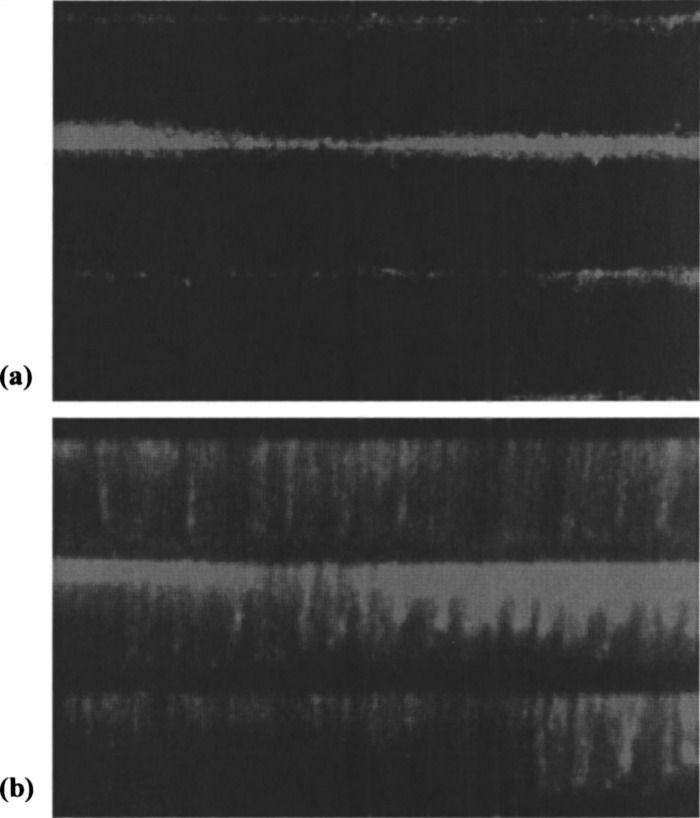
Nanoimprinted barriers single- and double-tether DNA with the same facility as e-beam-fabricated barriers. Figure 2 shows an optical micrograph of nanoimprinted barriers. The Cr barriers are wide and thick. Figure 3 shows fluorescent images of DNA tethered to nanoimprinted barriers with the buffer flow off (a) and flow on (b). DNA can be clearly seen stretching out in the buffer flow. Figure 4 shows fluorescent images of DNA tethered by both ends to nanoimprinted barriers, with buffer flow off. Using the patterned DNA curtain setup enables hundreds to thousands of well-aligned DNA molecules to be visualized simultaneously, whereas previous methods could measure no more than several dozen DNA molecules in a single experiment.4,6 Protein-DNA interactions can be characterized by tracking quantum dot-tagged proteins as they diffuse along individual DNA molecules.2,9 Accurate lateral alignment of DNA molecules also facilitates dynamic optical restriction mapping, where the location of specific base pairs on the genome can be identified.5 Since nanoimprint lithography offers much higher sample fabrication throughput of e-beam lithography, a significant further increase in experimental throughput is obtained.
FIG. 2.
Optical micrograph of nanoimprinted barriers.
FIG. 3.
DNA bound to nanoimprinted linear barriers with (a) flow off and (b) flow on. Flow direction is top to bottom.
FIG. 4.
DNA double-tethered to nanoimprinted barrier “racks” with buffer flow off.
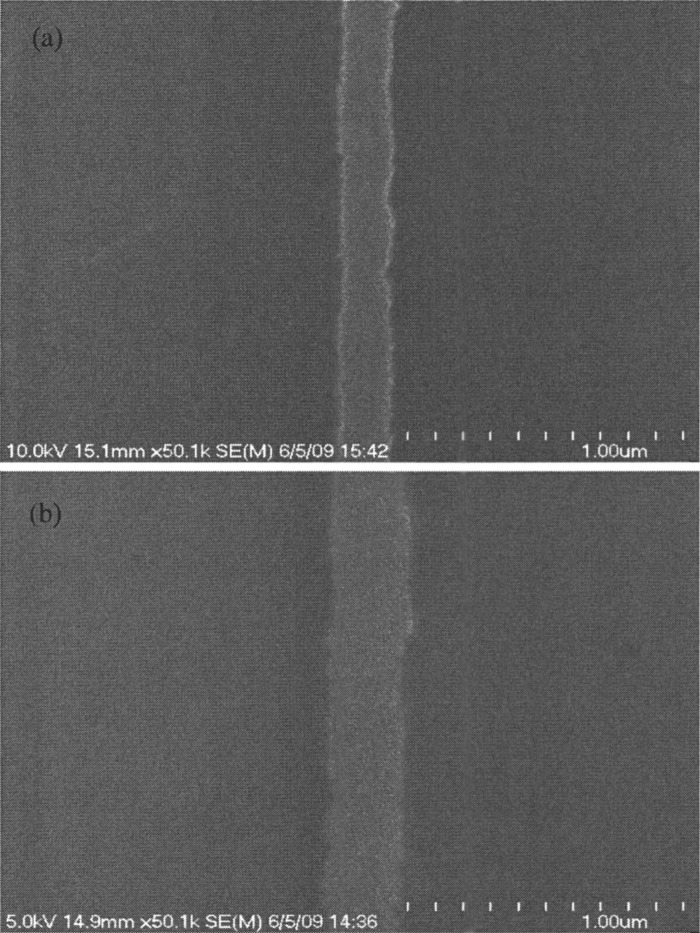
The linewidth of barriers on the master is approximately , while the linewidth of barriers on nanoimprinted samples is , as shown in Fig. 5. The difference in linewidth is due to etch bias from the plasma etch step to descum residual PMMA. While this is not optimal from a process point of view, it is not a significant problem for the DNA-protein imaging because overlapping fluorescence signals makes it difficult to resolve positions less than about apart in our microscope.5 Therefore, even if the linewidths of the nanoimprinted barriers degrade due to etch bias, data quality remains the same. Taken together, these results indicate that nanoimprinted barriers work as well as barriers fabricated using electron beam lithography.
FIG. 5.
SEM images: (a) barriers on a nanoimprint master. (b) Cr barriers made using nanoimprint and liftoff. Etch bias is evident.
IV. CONCLUSIONS
DNA arrays optimize the layout of DNA in the flowcell, enabling massively parallel observations of repair protein motion.2,3 Nanoimprint lithography triples the throughput of substrate fabrication for both single- and double-tethered DNA curtains, enabling a corresponding increase in experimental throughput. Because of the inherent resolution limits of the objective used in our TIRF experiments, traditional fabrication challenges such as etch bias are not obstacles to accurate observation of protein-DNA interactions on nanoimprinted substrates. For these reasons, nanoimprint lithography is worth pursuing in order to vastly increase the amount of data available for analysis. This is critical to studying how proteins such as Rad51, Rdh54, Msh2-Msh6, and Mlh1-Pms1 repair mutations causing breast and colorectal cancers.
ACKNOWLEDGMENTS
The authors would like to thank Jason Gorman and Feng Wang for useful discussions and the microscope image of double-tethered DNA. This research was funded in part by the Initiatives in Science and Engineering (ISE; awarded to E.C.G. and S.W.) program through Columbia University, and by an NIH grant (GM074739) and an NSF PECASE Award to E.C.G. T.A.F. is supported by an NSF Graduate Research fellowship. This work was partially supported by the Nanoscale Science and Engineering Initiative of the National Science Foundation under NSF Award No. CHE-0641523 and by the New York State Office of Science, Technology, and Academic Research (NYSTAR).
REFERENCES
- 1.Modrich P., J. Biol. Chem. 281, 30305 (2006). 10.1074/jbc.R600022200 [DOI] [PMC free article] [PubMed] [Google Scholar]
- 2.Gorman J., Chowdhury A., Surtees J. A., Shimada J., Reichman D. R., Alani E., and Greene E. C., J. Trauma Nurs. 28, 359 (2007). [DOI] [PMC free article] [PubMed] [Google Scholar]
- 3.Peltomaki P., J. Clin. Oncol. 21, 1174 (2003). 10.1200/JCO.2003.04.060 [DOI] [PubMed] [Google Scholar]
- 4.Fazio T. A., Visnapuu M. L., Wind S. J., and Greene E. C., Langmuir 24, 10524 (2008). 10.1021/la801762h [DOI] [PMC free article] [PubMed] [Google Scholar]
- 5.Visnapuu M. L., Fazio T. A., Wind S. J., and Greene E. C., Langmuir 24, 11293 (2008). 10.1021/la8017634 [DOI] [PMC free article] [PubMed] [Google Scholar]
- 6.Gorman J., Fazio T. A., Wang F., Wind S. J., and Greene E. C., Langmuir (in press). [DOI] [PMC free article] [PubMed]
- 7.Chou S. Y., Krauss P. R., and Renstrom P. J., Science 272, 85 (1996). 10.1126/science.272.5258.85 [DOI] [Google Scholar]
- 8.Prasad T. K., Yeykal C. C., and Greene E. C., J. Mol. Biol. 363, 713 (2006). 10.1016/j.jmb.2006.08.046 [DOI] [PubMed] [Google Scholar]
- 9.Graneli A., Yeykal C., Robertson R. B., and Greene E. C., Proc. Natl. Acad. Sci. U.S.A. 103, 1221 (2006). 10.1073/pnas.0508366103 [DOI] [PMC free article] [PubMed] [Google Scholar]


