

Abstract
Computational models may have the ability to quantify the relationship between hip morphology, cartilage mechanics and osteoarthritis. Most models have assumed the hip joint to be a perfect ball and socket joint and have neglected deformation at the interface between bone/cartilage. The objective of this study was to analyze finite element (FE) models of hip cartilage mechanics with varying degrees of simplified geometry and a model with a rigid bone material assumption to elucidate the effects on predictions of cartilage stress. A previously validated subject-specific FE model of a cadaveric hip joint was used as the basis for the models. Geometry for the bone/cartilage interface was either: 1) subject-specific (i.e. irregular), 2) spherical, or 3) a rotational conchoid. Cartilage was assigned either a varying (irregular) or constant thickness (smoothed). Loading conditions simulated walking, stair climbing and descending stairs. FE predictions of contact stress for the simplified models were compared with predictions from the subject-specific model. Both spheres and conchoids provided a good approximation of native hip joint geometry (average fitting error ~0.5 mm). However, models with spherical/conchoid bone geometry and smoothed articulating cartilage surfaces grossly underestimated peak and average contact pressures (50% and 25% lower, respectively) and overestimated contact area when compared to the subject-specific FE model. Models incorporating subject-specific bone geometry with smoothed articulating cartilage also underestimated pressures and predicted evenly distributed patterns of contact. The model with rigid bones predicted much higher pressures than the subject-specific model with deformable bones. The results demonstrate that simplifications to the geometry of the bone/cartilage interface, cartilage surface and bone material properties can have a dramatic effect on the predicted magnitude and distribution of cartilage contact pressures in the hip joint.
Keywords: Hip, Finite Element, Biomechanics, Sphere, Conchoid, Boundary Conditions, Cartilage Pressures
INTRODUCTION
Evidence suggests that mechanical factors play a major role in the development and progression of osteoarthritis (OA) (Mankin, 1974; Mankin, 1974; Mow, Setton et al., 1995; Poole, 1995). In the context of the hip joint, it has been hypothesized that morphological abnormalities (i.e., dysplasia and femoroacetabular impingement) are the underlying cause of hip OA (Cooperman, Wallensten et al., 1983; Harris, 1986; Michaeli, Murphy et al., 1997; Reynolds, Lucas et al., 1999; Mavcic, Pompe et al., 2002; Murphy, Tannast et al., 2004; Beck, Kalhor et al., 2005; Kim, Hutchinson et al., 2006). Therefore, accurate quantification of the relationship between hip morphology and cartilage mechanics may be important for understanding the cause and progression of hip OA. The current understanding of hip OA is based on clinical observations, experimental studies, and computational/analytical models. Computational models are attractive since it is technically feasible to develop hip joint models for live patients (i.e. patient-specific models (Russell, Shivanna et al., 2006)), which could substantially improve the diagnosis and treatment of osetoarthritic hips.
Clearly, patient-specific models must produce accurate predictions of cartilage mechanics to provide clinically meaningful data. To ensure accuracy, an analyst must carefully consider assumptions regarding the tissue material properties, loading and boundary conditions, and morphology. Substantial research efforts have been directed at developing constitutive equations for both bone (e.g. orthotropic behavior (Pistoia, van Rietbergen et al., 2001)) and cartilage (e.g. poroelasticity (Ferguson, Bryant et al., 2000; Li, Shirazi-Adl et al., 2003)). In addition, several studies have documented the importance of boundary and loading conditions for predicting contact mechanics in the hip (Bitsakos, Kerner et al., 2005; Phillips, Pankaj et al., 2007; Speirs, Heller et al., 2007). However, the level of geometric accuracy required to represent the articular cartilage and bone-cartilage interface geometry is unknown.
Most hip contact models have treated the hip as a concentric ball and socket joint, assume rigid bones, and represented cartilage as a series of discrete springs with constant length and stiffness (rigid body spring analysis (Genda, Konishi et al., 1995; Genda, Iwasaki et al., 2001; Yoshida, Faust et al., 2006)). In addition, analytical models, based on geometry digitized from plain film radiographs, have been developed to estimate cartilage pressures on a per subject basis, but these models also used idealize hip morphology (Ipavec, Iglic et al., 1996; Michaeli, Murphy et al., 1997; Ipavec, Brand et al., 1999; Iglic, Kralj-Iglic et al., 2002; Mavcic, Pompe et al., 2002). It has been demonstrated that finite element (FE) models of the hip joint that accurately reproduce subject-specific bone and cartilage geometry and allow bones to deform can predict cartilage pressures in good agreement with experimental data (Anderson, Ellis et al., 2008). However, it is unknown whether this degree of model fidelity is necessary.
Investigators that have modeled the hip as a perfect ball and socket joint have argued that a spherical representation of the hip joint is appropriate (Genda, Konishi et al., 1995; Genda, Iwasaki et al., 2001; Yoshida, Faust et al., 2006) since anthropometric studies have demonstrated that the femoral head and acetabulum closely resemble a sphere (Rushfeldt, Mann et al., 1981; Macirowski, Tepic et al., 1994; Menschik, 1997; Shepherd and Seedhom, 1999). However, geometrical similarity does not necessarily imply that models with idealized geometry will predict cartilage contact mechanics accurately. The first objective of this study was to elucidate the effects of hip joint morphology on predictions of cartilage contact mechanics from a validated, subject-specific FE model of the human hip. The second objective was to determine the influence of a rigid bone material assumption on the predictions produced by the FE model.
METHODS
FE Model Generation
A previously validated subject-specific FE model (SSM) provided baseline geometry used to create five simplified models (Anderson, Ellis et al., 2008). The SSM accurately represented the varying thickness of the articular cartilage layers and the geometry of the bone/cartilage interface for the acetabulum and femur (Anderson, Ellis et al., 2008), based on separate segmentations of cartilage and bone from high resolution CT image data (Table 1, Fig. 1).
Table 1.
Best fit geometric parameters and fitting errors for sphere and conchoid simplified models.
| Sphere (x − x0)2 + (y − y0)2 + (z − z0)2 = r2 | Rotational Conchoid r = a + b cosΘ | |||
|---|---|---|---|---|
| r (mm) | Fitting Error (mm) | a, b | Fitting Error (mm) | |
| Femur | 25.055 | 0.182 | 24.039, 7.544 | 0.172 |
| Acetabulum | 27.623 | 0.531 | 27.639, 0.001 | 0.530 |
Figure 1.
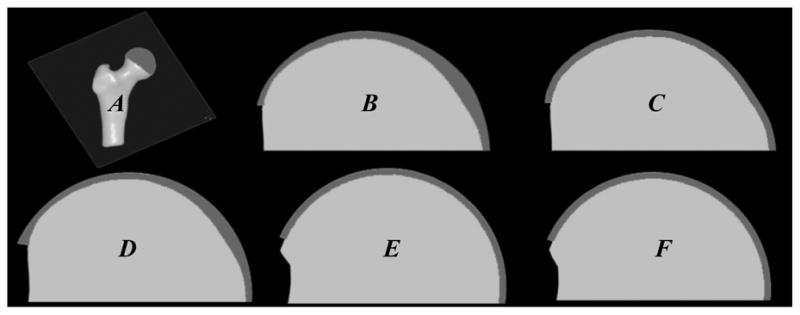
Cross-sections through femur with bone (light gray) and cartilage (dark gray). A- orientation of plane used to define section through FE model of femur, B- subject-specific model, C- subject-specific bone model with constant cartilage thickness (Model 1), D- subject-specific bone model with varying cartilage thickness based on the best-fit radius of joint space midline (Model 3), E- best-fit sphere model with constant cartilage thickness (Model 4), and F- best-fit conchoid model with constant cartilage thickness (Model 5). Rigid bone model not shown (Model 2).
Five simplified FE models were analyzed to distinguish the effects of hip joint geometry and a rigid material assumption for bone (Table 2). Model 1 used the bone/cartilage interface geometry from the subject-specific model, but represented cartilage thickness t as constant, given by:
| (1) |
where, Ra and Rf are the best-fit spherical radii of the acetabular and femur bone/cartilage interfaces, respectively. From Eq. 1 cartilage was assigned a constant thickness of 1.28 mm. Model 2 used subject-specific geometry for cartilage and bones but represented the bones as rigid bodies. Model 3 included subject-specific bone geometry but used a smoothed cartilage contact interface with a common radius R for the femur and acetabular cartilage articulating surfaces given by:
| (2) |
Table 2.
Description of subject-specific FE model and simplified FE models.
| Bone Topology | Cartilage Topology/Thickness | Bone Deformation | |
|---|---|---|---|
| Subject-Specific | Irregular | Irregular/Varying | Deformable |
| Const. Thick Cartilage (Model 1) | Irregular | Irregular/Constant (Eq. 1) | Deformable |
| Rigid Bones (Model 2) | Irregular | Irregular/Varying | Rigid |
| Smoothed Cartilage (Model 3) | Irregular | Smoothed (Eq. 2)/Varying | Deformable |
| Sphere (Model 4) | Smoothed | Smoothed/Constant (Eq. 1) | Deformable |
| Conchoid (Model 5) | Smoothed | Smoothed/Constant (Eq. 1) | Deformable |
Irregular refers to a cartilage/bone (Bone Topology) or cartilage/cartilage (Cartilage Topology) interface that was defined by direct segmentation of the CT image data. Smoothed refers to topology that was fit to spheres and conchoids or a best-fit radius representing the midline of the joint space (Eq. 2), respectively. Varying cartilage thickness was assigned by either direct segmentation of the CT image data or by projection of the bone/cartilage interface to a constant radius (Eq. 1). Constant cartilage thickness was = 1.28 mm, determined by Eq. 1.
The radius calculated in Eq. 2 can be interpreted as the midline of the joint space. Using a common radius with subject-specific bone/cartilage geometry resulted in a model with varying cartilage thickness for both acetabular and femoral cartilage. Finally, Models 4 and 5 were assigned constant cartilage thickness given by Eq. 1, with the bone/cartilage interfaces of the acetabulum and femur independently fit to spheres and rotational conchoids, respectively. Rotational conchoids have been shown to provide a better approximation of the native hip joint geometry than spheres (Menschik, 1997) and are described in polar coordinates by the following equation:
| (3) |
where r is a curve with length measured from the center of the conchoid (O) and θ is the angle between the curve r and the y-axis (Fig. 2, left). When b=0, r=a, yielding the equation for a circle. Eq. 3 describes the Limacon of Pascal, which is a conchoid of a circle with respect to the circle’s origin, O. To maintain consistency with prior studies (Menschik, 1997; Kang, Sadri et al., 2002; Xi, Hu et al., 2003; Kang, 2004), this curve will be referred to as a conchoid herein.
Figure 2.

Conchoid schematic. Left) two radii: a and b (dashed lines) and θ define a conchoid with center CCONCH according to the general equation: r = a + b cosθ. Right) the best fit conchoid (solid line) for the subject-specific bone/cartilage interface (dotted line) was calculated by optimizing CCONCH, a, and b along the direction of n. The central rotation axis, n, was calculated as the average orientation of all vectors (dotted arrows) that originated from the center of a best fit sphere (CSPHERE) and ended at each surface node representing the native bone/cartilage interface.
A central rotation axis, n was chosen to fit the hip joint geometry to a conchoid. One point along the axis of vector n was assumed to be at the center of the femur/acetabulum (based on the center of a best-fit sphere). The direction was determined by averaging the orientation of all vectors originating at this center and ending at the native femur/acetabulum surface nodes (Fig. 2, right). Sensitivity studies demonstrated that this assumption yielded the most appropriate orientation of n since deviations from this axis always resulted in increased fitting errors. Values of a and b were optimized by translating the center of the femur and acetabulum, as determined by spherical fit, along the direction of n until fitting errors were minimized.
Fitting error f was defined as the root mean squared distance that nodes from the native surface had to move to conform to the best-fit sphere or conchoid:
| (4) |
where and are the three-dimensional coordinates of the subject-specific and simplified geometry surface nodes, respectively, and n is the total number of surface nodes.
All FE cartilage meshes were created using TrueGrid (XYZ Scientific, Livermore, CA) as described previously (Anderson, Ellis et al., 2008). Triangular surfaces of the femoral and acetabular bone/cartilage interfaces were converted to triangular shell elements to represent cortical bone (Anderson, Peters et al., 2005). Position-dependent cortical thickness for the simplified meshes, specified at each shell element node, was identical to the SSM using the Hughes-Liu shell element formulation (Hughes and Liu, 1981). When using a Hughes-Liu shell element formulation, three-node shells provide nearly identical bending behavior as four-node quadrilaterals (Anderson, Peters et al., 2005). Hexahedral elements defined cartilage geometry (~37,000 elements), while shell elements with varying nodal thickness represented cortical bone for the pelvis and femur (~35,000 elements). The number of shell and hexahedral elements for all simplified models was the same as the SSM. Mesh density was chosen based on a convergence study performed in the original research (Anderson, Ellis et al., 2008).
Loading & Boundary Conditions, Material Properties
Loads and geometric orientation of the femur relative to the acetabulum were prescribed based on published data for in vivo hip loads (Bergmann, 1998; Bergmann, Deuretzbacher et al., 2001). Bergmann et al. reported hip joint anatomical orientations (flexion, abduction, rotation) and equivalent hip joint forces (magnitude and direction) during routine daily activities for 4 patients with instrumented femoral prostheses (Bergmann, 1998; Bergmann, Deuretzbacher et al., 2001). Data for the equivalent hip joint force at peak load of an “average patient” were used to simulate walking, descending stairs and stair climbing (~2000 N). Nodes along the superior iliac crest and pubis joint of the pelvic bone were fully constrained (Anderson, Ellis et al., 2008). Nodes at the distal femur were allowed to translate in a plane perpendicular to the direction of the equivalent joint reaction force.
Cartilage was represented as an incompressible, neo-Hookean hyperelastic material (Buchler, Ramaniraka et al., 2002) with shear modulus G=13.6 MPa (Park, Hung et al., 2004). Incompressibility was enforced using the augmented Lagrangian method (Hestenes, 1969). Cortical bone was represented as hypoelastic, homogenous and isotropic with elastic modulus E=17 GPa and Poisson’s ratio v=0.29 (Dalstra, Huiskes et al., 1995). Trabecular bone was not included in the models as it has been shown to have little effect on predicted cartilage contact pressures and increases solution time substantially (Anderson, Ellis et al., 2008). All FE analyses were performed using NIKE3D (Maker, Ferencz et al., 1990) on an SGI Altix 3000 16 processor cluster.
Data Analysis
Best fit values for the spherical and conchoid parameters and fitting errors were tabulated for the femur and acetabulum. Predictions of peak contact stress, average stress, and contact area for each simplified model were compared directly to the subject-specific FE model. An element contact stress of 0.1 MPa was stipulated as the lower threshold for calculating average stress and contact area (Anderson, Ellis et al., 2008). Contact areas were calculated by summing individual element areas for only those elements that had nodal pressures greater than 0.1 MPa.
RESULTS
Parameter Optimization Values and Fitting Errors
Overall, the bone/cartilage boundary of both the acetabulum and femoral head closely resembled the ideal hip joint geometry (maximum fitting errors ~0.53 mm) (Table 2). For the femur, the conchoid fitting error was less than the sphere, indicating that the femoral head was slightly better described by a conchoid. Essentially no difference between fitting errors for the acetabulum was observed.
Contact Patterns
The contact pattern for the subject-specific model varied according to the simulated loading activity (Fig. 3). The primary location of contact moved posteriorly as the resultant joint reaction force changed from shallow extension during descending stairs to more moderate flexion angles during walking and stair-climbing. There were several areas where cartilage pressures were localized.
Figure 3.

Comparison of acetabular cartilage pressures between the subject-specific model (first column) and all simplified models (adjacent columns) for each loading scenario analyzed (rows). Pressures were slightly elevated when a constant cartilage thickness was assumed to cover subject-specific bone geometry (column 2). Pressures were substantially elevated and distributed over a smaller area when bones were assumed rigid (column 3). Assuming smooth articulating cartilage topology covering subject-specific geometry (column 4) and fitting the bone/cartilage interface to both spheres (column 5) and conchoids (column 6), with constant cartilage thickness, resulted in a substantial decrease in pressures, with contact distributed over a larger area.
All simplified models had predicted pressures and contact areas that were noticeably different than the subject-specific model but the degree of change varied (Fig. 3). Specifically, Model 1 and Model 2 predicted higher, more localized pressures than the SSM. However, contact occurred in the same general regions as the SSM. When compared to the SSM, cartilage contact pressures were substantially reduced and distributed more evenly for Model 3. Pressures predicted by models with bone/cartilage interfaces fit to spheres (Model 4) and rotational conchoids (Model 5) were reduced even further. In addition, Models 4 and 5 predicted patterns of contact that were very evenly distributed over the articulating surface.
Peak Pressure, Average Pressure, Contact Area
Cartilage peak pressures were affected by alterations in cartilage and bone geometry and the ability of bone to deform (Fig. 4, top). Peak pressures were slightly overestimated when subject-specific bone geometry and constant cartilage thickness were assumed (Model 1). Model 2 predicted peak pressures that were nearly double those predicted by the SSM. In contrast, peak pressures were reduced by more than 50% for the model that assumed a best fit cartilage radius (Model 3) and for both best fit sphere and rotational conchoid models (Models 4 and 5, respectively). Changes to average pressure followed a similar trend as changes to peak pressure, although these differences were not as marked (Fig. 4, middle). Contact areas were also altered in the simplified models. Models 1 and 2 predicted less contact area than the SSM (Fig. 4, bottom). However, contact areas were increased by ~25% for Models 3–5.
Figure 4.

Comparison of FE predicted peak pressures between the subject-specific model and all simplified models. Top) peak pressures increased when a constant cartilage thickness was assumed to cover subject-specific bone geometry and when bones were assumed rigid. Peak pressures were less than half those of the subject-specific model when cartilage topology was simplified to conform to a best-fit radius, sphere or conchoid. Middle) average pressures followed a similar trend as peak pressure. Error bars indicate standard deviations in pressure for elements that predicted pressures > 0.1 MPa. Bottom) comparison of FE predicted contact areas. As expected, contact areas followed a trend opposite to predictions of peak and average pressure.
DISCUSSION
The results of this study have direct relevance to how computational models of the hip joint are developed. Although the morphology of the cadaver hip used in this study was described well by idealized spheres and conchoids (average fitting errors of ~0.5 mm), predictions made by models that treated the bone/cartilage interfaces as perfect spheres or conchoids grossly underestimated pressures and predicted evenly distributed patterns of contact for each of the loading scenarios analyzed. Therefore, models that are based on best fit spheres (such as those reconstructed from digitized 2D plain film radiographs) or conchoids likely lack the geometrical detail that is necessary to accurately predict the magnitude and spatial distribution of cartilage contact pressures.
Since the modulus of bone is orders of magnitude larger than that of articular cartilage, computational models of the hip have often treated the femur and acetabulum as rigid bodies (Macirowski, Tepic etal., 1994; Genda, Konishi et al., 1995; Genda, Iwasaki et al., 2001; Yoshida, Faust et al., 2006). This assumption is an attractive simplification because solution times are greatly reduced (Anderson, Ellis et al., 2008). Moreover, model development time for subject-specific models could be reduced substantially if rigid bones were assumed since only the bone/cartilage interface would need to be segmented from medical image data. In this study, rigid bone models predicted peak and average pressures that were substantially larger than models that treated bones as deformable with pressures concentrated over a smaller area of contact. While assuming that the femur and pelvis to be rigid may be appropriate for certain modeling applications, investigators should use caution when making this assumption for modeling hip joint cartilage contact.
In most instances, contrast agent must be injected into the hip capsule of patients prior to CT or MR imaging to clearly delineate the articulating layers of femoral and acetabular cartilage. However, it is possible to assign cartilage a constant thickness (Eq. 1) or varying thickness based on a projection to the best fit radius of the joint space midline (Eq. 2) using only bone geometry reconstructed from image data. Model 1, which assumed constant cartilage thickness adjacent to an irregular bone/cartilage interface, predicted pressures and contact distributions that were more consistent with the subject-specific FE model results than all other simplified models. Nevertheless, this model had a tendency to overestimate cartilage pressures and underestimate contact areas. While these differences may be acceptable for certain applications such as phenomenological studies, the assumption of constant cartilage thickness would be less suitable for hips with pathologic bone anatomy such as those with dysplasia.
When compared to the SSM, cartilage pressures were drastically reduced and contact was distributed over a larger region when cartilage was assigned varying thickness based on the best fit radius of the joint space midline (Model 3). The substantial decrease in pressures suggests that articulating cartilage surface topology strongly dictates the magnitude and distribution of contact pressures in the hip joint. Therefore, for patient-specific studies where the hip joint cannot be disarticulated as it was in this study, contrast agent should be introduced into the capsule to ensure that the outer contact interface of cartilage can be segmented and modeled independently.
Menschik determined that a conchoid provided a better 3D description of cadaveric femora and acetabula than spheres. However, the difference in fitting errors between the sphere and conchoid were not substantial (Menschik, 1997). For example, mean squared deviation of the osseous surface of the femoral head from a conchoid and sphere were 0.023 and 0.035 mm, respectively (Menschik, 1997), which are similar in trend to the data for the single hip analyzed in this study (0.182 and 0.172 mm, respectively) although they are an order of magnitude smaller. This discrepancy in magnitude is likely due to the method in which the surface points were digitized. Specifically, Menschik used a high precision coordinate measuring machine to digitize the ossesous surface of the cadaver tissues after the cartilaginous tissue was dissolved, whereas we used the coordinates of bone surfaces reconstructed from CT image data.
Pressures predicted by the subject-specific model corresponded well to in vitro data reported in the literature. In contrast, pressure predictions from the simplified Models 3–5 did not agree with in vitro data. For example, peak pressures reported by von Eisenhart-Rothe et al. (von Eisenhart-Rothe, Eckstein et al., 1997), measured by pressure sensitive film on cadaver hips, ranged from 7 MPa at 50% body weight to 9 MPa at 300% body weight. Afoke et al. (Afoke, Byers et al., 1987) reported pressures on the order of 10 MPa at 350% body weight using pressure sensitive film in a similar study. Both of these experimental studies demonstrated that contact patterns were not distributed evenly over the contact interface and concluded that the irregular contact patterns were most likely attributed to the fact that the hips tested were not perfectly spherical (Afoke, Byers et al., 1987; von Eisenhart-Rothe, Eckstein et al., 1997).
Yoshida et al. (Yoshida, Faust et al., 2006) developed dynamic discrete element models (DEA) to predict hip joint contact pressures using the same kinematic and loading conditions applied in the current study. Their models assumed spherical geometry and cartilage with constant thickness and predicted peak pressures of 3.26, 3.77, 5.71 MPa during walking, descending stairs, and stair-climbing, respectively. Our spherical models with constant cartilage thickness predicted peak pressures of 3.59, 3.31 and 4.67 MPa for the same loading conditions, which are in excellent agreement with the results published by Yoshida et al. However, whether analyzed using a discrete element or finite element modeling approach, spherical models with constant cartilage thickness underestimate pressures when compared to measurements obtained in-vitro (Afoke, Byers et al., 1987; von Eisenhart-Rothe, Eckstein et al., 1997).
Many of the limitations detailed in our previous hip joint FE modeling study (Anderson, Ellis et al., 2008) are applicable to the current work, including neglecting the contralateral pelvis, use of loading conditions from the literature, and modeling the cartilage as an incompressible, homogenous, hyperelastic material. Sensitivity studies from our prior work demonstrated that deformation of the contralateral pelvis did not have a notable effect on predicted pressures (Anderson, Ellis et al., 2008), justifying this assumption in the present work. Loading based on data reported from the literature was used since it is the most complete set of data available. To guarantee uniformity, the same kinematic positions and loads were applied to each simplified model. Modeling the cartilage as an incompressible material is justified because both the validation study and the current study simulated the relatively fast loading of cartilage that occurs during normal daily activities (loading rate = ~0.33 Hz). Data from in vitro studies suggests fluid flow is minimal during fast loading (Macirowski, Tepic et al., 1994; Ferguson, Bryant et al., 2003) and the instantaneous response of an incompressible hyperelastic material has been shown to be equivalent to the response of a biphasic material under fast loading conditions (Ateshian, Ellis et al., 2007). Finally, geometry for a single cadaver was used as the basis for all models analyzed in this study. It is possible that this hip had abnormal geometry that caused predictions to vary substantially between subject-specific and simplified models. However, given the small fitting errors (~0.5 mm) and grossly normal appearance, it is unlikely that the specimen analyzed was abnormal. Analyzing more models of other cadaver hips would improve the interpretability of our results.
Previous studies suggest that even normal hips are not spherical and have cartilage with irregular articulating and bone/cartilage topologies (Rushfeldt, Mann et al., 1981; Macirowski, Tepic et al., 1994; Menschik, 1997; Shepherd and Seedhom, 1999). While differences from idealized geometry, including spheres or conchoids may be minor, the results of this study demonstrate that geometrically simplified models of the hip joint do not have the detail necessary to accurately predict the magnitude and spatial distribution of cartilage contact pressures. Therefore, it is recommended that models of cartilage contact mechanics in the hip should use geometry that is as faithful to the true geometry as possible. Use of accurate geometry is vital when studying cartilage contact mechanics on a patient-specific basis since even subtle differences in hip joint geometry are likely to lead to large differences in contact mechanics. For patient-specific modeling applications, imaging techniques such as CT/MR arthrography can be used to obtain the geometry of the cartilaginous and bony tissues in the hip joint.
Acknowledgments
Financial support from NIH #R01 AR053344 is gratefully acknowledged.
Footnotes
Conflict of Interest
The authors have no conflict of interest to report. Funding for this study was provided by the National Institutes of Health R01-AR053344.
Publisher's Disclaimer: This is a PDF file of an unedited manuscript that has been accepted for publication. As a service to our customers we are providing this early version of the manuscript. The manuscript will undergo copyediting, typesetting, and review of the resulting proof before it is published in its final citable form. Please note that during the production process errors may be discovered which could affect the content, and all legal disclaimers that apply to the journal pertain.
References
- Afoke NY, Byers PD, Hutton WC. Contact pressures in the human hip joint. J Bone Joint Surg Br. 1987;69(4):536–41. doi: 10.1302/0301-620X.69B4.3611154. [DOI] [PubMed] [Google Scholar]
- Anderson AE, Ellis BJ, Maas SA, Peters CL, Weiss JA. Validation of finite element predictions of cartilage contact pressures in the human hip joint. J of Biomech Eng. 2008;130(5):051008. doi: 10.1115/1.2953472. [DOI] [PMC free article] [PubMed] [Google Scholar]
- Anderson AE, Ellis BJ, Peters CL, Weiss JA. Cartilage thickness: factors influencing multidetector CT measurements in a phantom study. Radiology. 2008;246(1):133–41. doi: 10.1148/radiol.2461062192. [DOI] [PMC free article] [PubMed] [Google Scholar]
- Anderson AE, Peters CL, Tuttle BD, Weiss JA. Subject-specific finite element model of the pelvis: development, validation and sensitivity studies. J Biomech Eng. 2005;127(3):364–73. doi: 10.1115/1.1894148. [DOI] [PubMed] [Google Scholar]
- Ateshian GA, Ellis BJ, Weiss JA. Equivalence between short-time biphasic and incompressible elastic material responses. J Biomech Eng. 2007;129(3):405–12. doi: 10.1115/1.2720918. [DOI] [PMC free article] [PubMed] [Google Scholar]
- Beck M, Kalhor M, Leunig M, Ganz R. Hip morphology influences the pattern of damage to the acetabular cartilage: femoroacetabular impingement as a cause of early osteoarthritis of the hip. J Bone Joint Surg Br. 2005;87(7):1012–8. doi: 10.1302/0301-620X.87B7.15203. [DOI] [PubMed] [Google Scholar]
- Bergmann G. Hip98: Data Collection of Hip Joint Loading on CD-ROM. Free University and Humboldt University; Berlin: 1998. [Google Scholar]
- Bergmann G, Deuretzbacher G, Heller M, Graichen F, Rohlmann A, Strauss J, Duda GN. Hip contact forces and gait patterns from routine activities. J Biomech. 2001;34(7):859–71. doi: 10.1016/s0021-9290(01)00040-9. [DOI] [PubMed] [Google Scholar]
- Bitsakos C, Kerner J, Fisher I, Amis AA. The effect of muscle loading on the simulation of bone remodeling in the proximal femur. J Biomech. 2005;38(1):133–9. doi: 10.1016/j.jbiomech.2004.03.005. [DOI] [PubMed] [Google Scholar]
- Buchler P, Ramaniraka NA, Rakotomanana LR, Iannotti JP, Farron A. Clin Biomech. 9–10. Vol. 17. Bristol, Avon: 2002. A finite element model of the shoulder: application to the comparison of normal and osteoarthritic joints; pp. 630–9. [DOI] [PubMed] [Google Scholar]
- Cooperman DR, Wallensten R, Stulberg SD. Acetabular dysplasia in the adult. Clin Orthop. 1983;(175):79–85. [PubMed] [Google Scholar]
- Dalstra M, Huiskes R, van Erning L. Development and validation of a three-dimensional finite element model of the pelvic bone. J Biomech Eng. 1995;117(3):272–8. doi: 10.1115/1.2794181. [DOI] [PubMed] [Google Scholar]
- Ferguson SJ, Bryant JT, Ganz R, Ito K. The influence of the acetabular labrum on hip joint cartilage consolidation: a poroelastic finite element model. J Biomech. 2000;33(8):953–60. doi: 10.1016/s0021-9290(00)00042-7. [DOI] [PubMed] [Google Scholar]
- Ferguson SJ, Bryant JT, Ganz R, Ito K. An in vitro investigation of the acetabular labral seal in hip joint mechanics. J Biomech. 2003;36(2):171–8. doi: 10.1016/s0021-9290(02)00365-2. [DOI] [PubMed] [Google Scholar]
- Genda E, Iwasaki N, Li G, MacWilliams BA, Barrance PJ, Chao EY. Normal hip joint contact pressure distribution in single-leg standing--effect of gender and anatomic parameters. J Biomech. 2001;34(7):895–905. doi: 10.1016/s0021-9290(01)00041-0. [DOI] [PubMed] [Google Scholar]
- Genda E, Konishi N, Hasegawa Y, Miura T. A computer simulation study of normal and abnormal hip joint contact pressure. Arch Orthop Trauma Surg. 1995;114(4):202–6. doi: 10.1007/BF00444263. [DOI] [PubMed] [Google Scholar]
- Harris WH. Etiology of osteoarthritis of the hip. Clin Orthop. 1986;(213):20–33. [PubMed] [Google Scholar]
- Hestenes MR. Multiplier and gradient methods. Journal of Optimization Theory and Applications. 1969;4:303–320. [Google Scholar]
- Hughes TJ, Liu WK. Nonliner finite element analysis of shells: Part I. two dimensional shells. Computational Methods in Applied Mechanics. 1981;27:167–181. [Google Scholar]
- Iglic A, Kralj-Iglic V, Daniel M, Macek-Lebar A. Computer determination of contact stress distribution and size of weight bearing area in the human hip joint. Comput Methods Biomech Biomed Engin. 2002;5(2):185–92. doi: 10.1080/10255840290010300. [DOI] [PubMed] [Google Scholar]
- Ipavec M, Brand RA, Pedersen DR, Mavcic B, Kralj-Iglic V, Iglic A. Mathematical modeling of stress in the hip during gait. J Biomech. 1999;32(11):1229–35. doi: 10.1016/s0021-9290(99)00119-0. [DOI] [PubMed] [Google Scholar]
- Ipavec M, Iglic A, Iglic VK, Srakar F. Stress distribution on the hip joint articular surface during gait. Pflugers Arch. 1996;431(6 Suppl 2):R275–6. doi: 10.1007/BF02346375. [DOI] [PubMed] [Google Scholar]
- Kang M. Hip joint center location by fitting conchoid shape to the acetabular rim region of MR images. Proceedings of the 26th Annual International Conference of the IEEE EMBS; San Francisco, CA, USA: IEEE; 2004. [DOI] [PubMed] [Google Scholar]
- Kang M, Sadri H, Moccozet L, Magnenat-Thalmann N, Hoffmeyer P. Accurate Simulation of Hip Joint Range of Motion. IEEE Proceedings of the Computer Animation; 2002; 2002. pp. 1087–4844. [Google Scholar]
- Kim WY, Hutchinson CE, Andrew JG, Allen PD. The relationship between acetabular retroversion and osteoarthritis of the hip. J Bone Joint Surg Br. 2006;88(6):727–9. doi: 10.1302/0301-620X.88B6.17430. [DOI] [PubMed] [Google Scholar]
- Li L, Shirazi-Adl A, Buschmann MD. Investigation of mechanical behavior of articular cartilage by fibril reinforced poroelastic models. Biorheology. 2003;40(1–3):227–33. [PubMed] [Google Scholar]
- Macirowski T, Tepic S, Mann RW. Cartilage stresses in the human hip joint. J Biomech Eng. 1994;116(1):10–8. doi: 10.1115/1.2895693. [DOI] [PubMed] [Google Scholar]
- Maker BN, Ferencz RM, JO H. Lawrence Livermore National Laboratory Technical Report UCRL-MA(105268) 1990. NIKE3D: A nonlinear, implicit, three-dimensional finite element code for solid and structural mechanics. [Google Scholar]
- Mankin HJ. The reaction of articular cartilage to injury and osteoarthritis (first of two parts) N Engl J Med. 1974;291(24):1285–92. doi: 10.1056/NEJM197412122912406. [DOI] [PubMed] [Google Scholar]
- Mankin HJ. The reaction of articular cartilage to injury and osteoarthritis (second of two parts) N Engl J Med. 1974;291(25):1335–40. doi: 10.1056/NEJM197412192912507. [DOI] [PubMed] [Google Scholar]
- Mavcic B, Pompe B, Antolic V, Daniel M, Iglic A, Kralj-Iglic V. Mathematical estimation of stress distribution in normal and dysplastic hips. Journal of Orthopaedic Research. J Biomech. 2002;20(5):1025–30. doi: 10.1016/S0736-0266(02)00014-1. [DOI] [PubMed] [Google Scholar]
- Menschik F. The hip joint as a conchoid shape. J Biomech. 1997;30(9):971–3. doi: 10.1016/s0021-9290(97)00051-1. [DOI] [PubMed] [Google Scholar]
- Michaeli DA, Murphy SB, Hipp JA. Comparison of predicted and measured contact pressures in normal and dysplastic hips. Med Eng Phys. 1997;19(2):180–6. doi: 10.1016/s1350-4533(96)00051-3. [DOI] [PubMed] [Google Scholar]
- Mow VC, Setton LA, Guilak F, Ratcliffe A. Osteoarthritic Disorders. American Academy of Orthopaedic Surgeons; 1995. Mechanical factors in articular cartilage and their role in osteoarthritis. [Google Scholar]
- Murphy S, Tannast M, Kim YJ, Buly R, Millis MB. Debridement of the adult hip for femoroacetabular impingement: indications and preliminary clinical results. Clin Orthop Relat Res. 2004;(429):178–81. doi: 10.1097/01.blo.0000150307.75238.b9. [DOI] [PubMed] [Google Scholar]
- Park S, Hung CT, Ateshian GA. Mechanical response of bovine articular cartilage under dynamic unconfined compression loading at physiological stress levels. Osteoarthritis Cartilage. 2004;12(1):65–73. doi: 10.1016/j.joca.2003.08.005. [DOI] [PubMed] [Google Scholar]
- Phillips AT, Pankaj P, Howie CR, Usmani AS, Simpson AH. Finite element modeling of the pelvis: inclusion of muscular and ligamentous boundary conditions. Med Eng Phys. 2007;29(7):739–48. doi: 10.1016/j.medengphy.2006.08.010. [DOI] [PubMed] [Google Scholar]
- Pistoia W, van Rietbergen B, Laib A, Ruegsegger P. High-resolution three-dimensional-pQCT images can be an adequate basis for in-vivo microFE analysis of bone. J Biomech Eng. 2001;123(2):176–83. doi: 10.1115/1.1352734. [DOI] [PubMed] [Google Scholar]
- Poole AR. Osteoarthritic Disorders. American Academy of Orthopaedic Surgeons; 1995. Imbalances of anabolism and catabolism of cartilage matrix components in osteoarthritis. [Google Scholar]
- Reynolds D, Lucas J, Klaue K. Retroversion of the acetabulum. A cause of hip pain. J Bone Joint Surg Br. 1999;81(2):281–8. doi: 10.1302/0301-620x.81b2.8291. [DOI] [PubMed] [Google Scholar]
- Rushfeldt PD, Mann RW, Harris WH. Improved techniques for measuring in vitro the geometry and pressure distribution in the human acetabulum--I. Ultrasonic measurement of acetabular surfaces, sphericity and cartilage thickness. J Biomech. 1981;14(4):253–60. doi: 10.1016/0021-9290(81)90070-1. [DOI] [PubMed] [Google Scholar]
- Russell ME, Shivanna KH, Grosland NM, Pedersen DR. Cartilage contact pressure elevations in dysplastic hips: a chronic overload model. J Orthop Surg. 2006;1:6. doi: 10.1186/1749-799X-1-6. [DOI] [PMC free article] [PubMed] [Google Scholar]
- Shepherd DE, Seedhom BB. Thickness of human articular cartilage in joints of the lower limb. Ann Rheum Dis. 1999;58(1):27–34. doi: 10.1136/ard.58.1.27. [DOI] [PMC free article] [PubMed] [Google Scholar]
- Speirs AD, Heller MO, Duda GN, Taylor WR. Physiologically based boundary conditions in finite element modeling. J Biomech. 2007;40(10):2318–23. doi: 10.1016/j.jbiomech.2006.10.038. [DOI] [PubMed] [Google Scholar]
- von Eisenhart-Rothe R, Eckstein F, Muller-Gerbl M, Landgraf J, Rock C, Putz R. Anat Embryol. 3. Vol. 195. Berl: 1997. Direct comparison of contact areas, contact stress and subchondral mineralization in human hip joint specimens; pp. 279–88. [DOI] [PubMed] [Google Scholar]
- Xi J, Hu X, Jin Y. Shape Analysis and Parameterzied Modeling of Hip Joint. Journal of Computing and Information Science in Engineering. 2003;3:260–5. [Google Scholar]
- Yoshida H, Faust A, Wilckens J, Kitagawa M, Fetto J, Chao EY. Three-dimensional dynamic hip contact area and pressure distribution during activities of daily living. J Biomech. 2006;39(11):1996–2004. doi: 10.1016/j.jbiomech.2005.06.026. [DOI] [PubMed] [Google Scholar]