

Abstract
Functional magnetic resonance imaging (fMRI) data and electroencephalography (EEG) data provide complementary spatio-temporal information about brain function. Methods to couple the relative strengths of these modalities usually involve two stages: first forming a feature set from each dataset based on one criterion followed by exploration of connections among the features using a second criterion. We propose a data fusion method for simultaneously acquired fMRI and EEG data that combines these steps using a single criterion for finding the cross-modality associations and performing source separation. Using multi-set canonical correlation analysis (M-CCA), we obtain a decomposition of the two modalities, into spatial maps for fMRI data and a corresponding temporal evolution for EEG data, based on trial-to-trial covariation across the two modalities. Additionally, the analysis is performed on data from a group of subjects in order to make group inferences about the covariation across modalities. Being multivariate, the proposed method facilitates the study of brain connectivity along with localization of brain function. M-CCA can be easily extended to incorporate different data types and additional modalities. We demonstrate the promise of the proposed method in finding covarying trial-to-trial amplitude modulations (AMs) in an auditory task involving implicit pattern learning. The results show approximately linear decreasing trends in AMs for both modalities and the corresponding spatial activations occur mainly in motor, frontal, temporal, inferior parietal, and orbito-frontal areas that are linked both to sensory function as well as learning and expectation—all of which match activations related to the presented paradigm.
I. Introduction
Brain imaging techniques such as functional magnetic resonance imaging (fMRI) and electroencephalography (EEG) provide complementary information about the brain function. Although fMRI provides an indirect hemodynamic measure of brain function that serves as a surrogate for neuronal activity, it offers good spatial localization of blood oxygen dependent activity. On the other hand, while EEG is a more direct measure of the brain's electrical activity measured instantaneously at excellent temporal resolution, it does not provide satisfactory spatial location of the source of the activation. Integrating the information from these two imaging modalities promises to provide a better understanding of brain function, see e.g., [1]–[4].
A number of methods have been developed to combine the information in these modalities using constraint analysis, for e.g., source localization from fMRI to inform EEG [5]–[7], prediction of fMRI using the time dynamics of EEG as regressors [8], and feature-based fusion that uses a common generative model to explain different modalities [9], [10], where a feature is a lower dimensional representation of the brain function. Recently, effective techniques have been developed to acquire EEG data during fMRI data acquisition in the MR scanner [11] and several approaches [8], [12]–[15] have been developed to analyze such concurrent recordings. These approaches study the trial-to-trial variability of single trial event-related potentials (ERPs) [16], [17] and its effects on hemodynamic activity [18] to evaluate the relationship between the two modalities. In [8], single trial ERP data are shown to demonstrate paradigm induced amplitude modulation (AM) at certain time points and these AMs convolved with the hemodynamic response function (HRF) are used as predictors of fMRI responses. Similarly in [15], the fMRI response was predicted based on the AMs observed in the temporal components obtained from independent component analysis (ICA) on the EEG data. As an extension of this approach, a spatiotemporal demixing of fMRI and EEG via parallel ICA on each dataset and subsequent data integration was presented in [12], wherein the time courses of the independent spatial components from fMRI were modeled with the HRF-convolved target stimulus as well as the detrended single trial weights of select independent temporal components from EEG. These approaches can be seen as extensions to the general linear model (GLM)-based approach for fMRI data analysis, where electrical activity from EEG is used to fit fMRI data, instead of or in addition to using the information about the hemodynamic activity related to the task.
To summarize, data integration strategies for concurrently acquired data usually involve two stages: a form of feature extraction, e.g., source separation, followed by a cross-modality correlation or regression based on these features [8], [12]. Decomposing the data and then correlating across modalities may not ensure discovery of optimal relationship across modalities since this may lead to making non-physiological assumptions about the data and the cross-modality relationships [13]. Rather than performing source separation on each modality based on one criterion such as statistical independence of sources and then performing cross-modality integration based on a second criterion such as temporal correlation as done in [12], a more straightforward approach would be to unify the task by using a single cost for both purposes—evaluating the cross-modality associations and achieving source separation, both at the same time. Such a method would allow the study of the modular nature of brain function together with neuronal connectivity. Moreover, performing the fusion analysis at the group level is highly desirable since low cross-modality correlations as well as inter-subject differences may make it difficult to find one-to-one correspondence while matching the cross-modality linkages across subjects.
In this paper, we unify the two-step strategy in a multi-subject analysis by employing multi-set canonical correlation analysis (M-CCA) [19] to perform data fusion of concurrently-acquired fMRI and EEG data from multiple subjects. Our fusion approach is based on a linear mixing model where each dataset is decomposed into a set of components (spatial areas for fMRI and temporal segments for EEG) and their mixing coefficients (weights reflecting the trial-to-trial variation of the components). We use M-CCA for finding a transformed coordinate system that maximizes the trial-to-trial covariation across the two modalities and across multiple subjects, and based on these covariation, we determine associations among the components across datasets. Thus, we perform source separation at the group level under one cost function that incorporates correlations across the modalities and the subjects. We identify regions in the fMRI data whose activation undergoes similar dynamics as the trial-to-trial amplitude modulations (AMs) in the EEG. Unlike univariate approaches for evaluating the association of each region with the AM at a certain latency, we can evaluate a subset of regions associated with the AM possibly manifested at a number of latencies. Consequently, our multivariate approach allows us to study localization of brain function as well as neuronal connectivity across the brain. The proposed fusion scheme is flexible and can be extended to jointly study different data types from a large number of subjects.
The superior performance of M-CCA in joint source separation for large number of fMRI datasets, its robustness to outliers, and its robustness to complex-valued data distributions, when compared with the competitive methods handling multiple datasets is shown in [20]. A recently developed feature-based fusion approach uses M-CCA to link multiple data types through inter-subject covariation [10], [21] to fuse three datasets: fMRI, EEG, and structural MRI obtained from subjects with schizophrenia and healthy controls [22]. M-CCA identified a linearly transformed co-ordinate system such that the inter-subject covariation across different modalities are maximized. The results identified changes in the motor and temporal areas associated with the N2/P3 complex in the ERP, all of which have been well known to be affected in schizophrenia. However, in this previous application since the EEG-fMRI data were not acquired simultaneously, the method is limited to a feature-based analysis that cannot link the temporal dynamics of the fMRI dataset with the trial-to-trial variations of the EEG.
In order to test and compare our method, we use data consisting of a pattern learning paradigm of auditory tones presented at random and regular intervals. This paradigm stimulates subjective predictability/expectation which results in AMs in the EEG occurring at certain latencies, as shown in [8], [12]. Our results demonstrate that M-CCA successfully identifies physiologically meaningful linked processes in both the fMRI and EEG data. M-CCA detects AM across the time on trial in the oddball task, which demonstrates long-term habituation in the multimodal data. The spatial areas linked with these AMs mainly include orbito-frontal cortex, motor areas, inferior-parietal gyrus, and temporal lobes. The EEG components show smooth oscillations; however, latency jitter and convolution with the HRF make it difficult to observe any prominent peaks.
Next we present a brief background on related fusion studies and applications of M-CCA in Section II, followed by the generative model for the M-CCA method in Section III, our experiments in Section IV, results in Section V, and discussion on the proposed method and results in Section VI.
II. Background
Canonical correlation analysis (CCA) [23] and M-CCA—its extension to multiple datasets—are data-driven approaches that provide a natural framework for the study of two or more datasets. Recently, there has been increased interest in the use of CCA for fusion of features to obtain a more discriminating feature set in various pattern recognition applications [24]–[28]. Also, in biomedical applications, CCA and M-CCA have found a number of interesting applications. CCA has been used to decompose fMRI data into spatial maps of the sources of brain activation by maximizing spatial auto-correlation [29]. More recently, feature-level fusion has been successfully achieved across two modalities using CCA [10] and across three modalities via M-CCA [22]. Also, M-CCA has been proposed for group analysis of fMRI data [30] and has been shown to be robust across heterogeneous correlation profiles [31]. In this paper, we propose a novel application of M-CCA to data fusion of concurrently acquired fMRI and EEG data, where M-CCA identifies the linear relationships in the form of co-variations in trial-to-trial AMs of the two modalities over multiple subjects.
A couple of other fusion methods are related to our proposed fusion framework in principle by merging the source separation and fusion criteria. In [13], multiway partial least squares (N-PLS) approach was used to find correlations between fMRI time courses and the spectral components of the EEG data from a single subject. The N-PLS method assumes a tri-linear decomposition of the EEG data into spectral components weighted by spatial signatures and temporal signatures and a linear mixing model for fMRI data into spatial components and temporal weights. The EEG data are assumed to be the independent variables and the fMRI data, the dependent variables. The two datasets are decomposed while maximizing the correlation between the temporal weights between the two modalities. Even though an initial inspection may suggest that this method is similar to our proposed method, there are a number of differences between the two methods. We evaluate the single-trial temporal evolution while they study the evolutional spectrum. Unlike the N-PLS method, our method does not assign independent/dependent labels to either of the modalities and treats both equally. Also, the N-PLS model is sensitive to the appropriateness of the trilinear model for EEG and also the correct estimation of model order.
The other method is the joint-ICA (jICA) [9] data fusion approach to fuse single trial EEG and fMRI data from single as well as multiple subjects demonstrated using simulated data in [14]. The jICA method is promising as it proposes to use all the available data from the simultaneous acquisition to identify latent neuronal sources whose trial-to-trial dynamics are jointly reflected in both modalities. However, jICA makes the assumption that the sources are independent. The independence assumption can be useful for interpreting results, but is also a very strong assumption about the underlying sources. M-CCA is similar to this joint ICA method in that it combines the source separation, multimodality fusion, and multiple subject analysis. However, the two methods are much different in the modeling assumptions, with the M-CCA approach being more flexible since unlike jICA, M-CCA does not constrain the modulation profiles of components to be the same for both modalities and also, does not constrain the sources to be independent. In [10], through the use of simulated data, a comparison of jICA and CCA-based fusion on feature datasets showed that a common profile works well when the associations across modalities are highly correlated while for lower correlations the use of separate modulation profiles performs better. In our experience, the within-subject linear correlations between raw (mixed) EEG single trial amplitudes and fMRI voxel timeseries are generally weak, and range from approximately −0.3 to 0.3 and hence it is more suitable to use the M-CCA-based approach that estimates a separate modulation profile for each modality.
III. Theory
In this section, we present the proposed generative model for the fusion of concurrently acquired fMRI and EEG data from N subjects. Then, we explain the M-CCA procedure for fusion of the 2N datasets (two modalities for each subject).
A. Generative model for data fusion
In our generative model, each fMRI data matrix, containing the spatial regions of interest at the different scan times, is a linear mixture of spatial components and their corresponding mixing vectors. Similarly, each EEG data matrix, containing the single trial target epochs convolved with the hemodynamic response function, is a mixture of temporal components and their mixing vectors over trials. A schematic representation of the generative model is shown in Fig. 1. The decomposition is achieved such that the correlations in the trial-to-trial variations across the modalities is maximized. Since the analysis is performed for a group dataset, we also maximize the correlations within as well as between modalities across all subjects. In this generative model, each component is associated with only one component in each other dataset through one uncorrelated modulation profile. This one-to-one correspondence aids in the examination of associations across modalities.
Fig. 1.

Generative model for concurrently acquired fMRI and EEG data fusion. The two datasets are decomposed into the maximally correlated variations over trials and the spatial components for the fMRI dataset and temporal components for the EEG dataset.
The generative model is thus given by
where Xk ∈ ℝT×Vk, Ak ∈ ℝT×D, Ck ∈ ℝD×Vk is the number of variables (number of spatial regions in fMRI/length of target epoch in EEG) in Xk, T is the number of observations (number of timepoints) in Xk and D is the min(rank(Xk)),k = 1,…,2N. As per the model, the modulation profiles given by the ith column of the A matrices, i.e., (i = 1,…,d) satisfy the following properties:
-
The modulation profiles are uncorrelated within each dataset and have zero mean and unit variance, i.e.,
-
The modulation profiles have non-zero correlation only on their corresponding indices, and have correlation coefficients, , where , i.e.,
where
In this paper, we obtain the A matrices as the canonical variates obtained by M-CCA, as we show in the next section, and the least squares approximations of the components are given by
B. Multi-set CCA
Multi-set CCA is a multi-dataset extension of the two dataset canonical correlation analysis (CCA) proposed in [23]. We exploit the M-CCA approach proposed in [19] to find the co-variation across the modalities and subjects. The generative model for 2N datasets is given by
The canonical correlations can be obtained by optimizing a number of cost functions proposed in [19], e.g., maximizing the sum of squared correlations among the canonical variates. Consider the canonical variate matrices Ak, where each is a linear combination of the dataset Xk given as
and Wk are the canonical transformation matrices whose columns contain the canonical coefficient vectors.
We can summarize the multi-set CCA procedure based on sum of squares (SSQCOR) cost as:
-
Stage 1
-
Stage 2 to D
for i = 2:D
end
where and D ≤ min(rank(Xk)). In [19], Stage 1 is solved by first calculating the partial derivative function of the SSQCOR cost with respect to each and equating it to zero to find the stationary point. Since the SSQCOR cost is a quadratic function of each , the partial derivative is a linear function of and hence, the closed form solution can be derived. Starting from an initial point, each vector is updated in sequel to guarantee an increase in the cost function and a sweep through all the constitutes one step of the iterative maximization procedure. The iterations are stopped when the cost convergence criterion is met and the resulting vectors are taken as the optimal solution. Stage 2 and higher stages are solved in a similar manner with the cost function replaced by a Lagrangian incorporating the orthogonality constraints on the canonical coefficient vectors. A schematic representation of the principle of M-CCA for Stage i of the M-CCA is shown in Fig. 2
Fig. 2.

Stage i of the M-CCA iterative procedure. M-CCA maximizes the sum of squared correlations of the trial-to-trial variations across the two modalities across N subjects. X1 : XN represents the fMRI datasets and XN+1: X2N represents the EEG datasets. The rectangle represent column vectors and the squares represent matrices.
In [20], the study of source separability conditions of M-CCA based on a flexible generative model shows that the method can be used to achieve successful source separation under mild conditions. It is shown that the conditions depend on the chosen cost function, e.g., is a practical choice for the cost and it leads to robust separation performance and a separability condition that is easily satisfied especially when the number of observations increases.
IV. Materials and Methods
A. Subjects
Fifteen healthy right-handed participants (21–28 years, seven female and eight male) took part in the experiment after providing a written statement of informed consent.
B. Stimuli
The stimuli during the sparse-sampling fMRI acquisition consisted of chords (50 ms) presented in eyes-closed condition via headphones (≈ 80 dB) with an onset synchrony of 2 s. Two tones were presented: 216 infrequent “targets” (500 Hz, 25 % probability) were interspersed with frequent “standard” (250 Hz with 75% probability). The targets were presented in alternating sequences of six consecutive targets, either with a random target-to-target interval (TTI) ranging from 4 to 22 s or with regular TTI of 8 s. Each of these 12-target cycles lasted on an average of 96 s and 18 sets (9 in each session) of such cycles were presented. In response to each target, participants were instructed to press a button in the middle of the interval between the target and next standard stimulus. This delayed response while hampering the expected behavioral effect of response-time speeding allows to focus on stimulus-related perceptual and cognitive effects associated with predictability. Participants were not informed beforehand about the regularity in the TTI.
C. Data Analysis
An overview of the data analysis steps for a single subject is shown in Fig. 3.
Fig. 3.

Analyses steps for fMRI and EEG data for a single subject. In the case of multiple subject, the preprocessing and data reduction steps are performed for each subject and then whitened data from all the subjects are entered into a single group level M-CCA.
1) fMRI data acquisition
Imaging was performed on a 1.5 T scanner (Siemens, Germany). After scanning of anatomy with a T1 weighted MPRAGE sequence, 300 BOLD sensitive echo planar images (EPI) were collected in two sessions. EPI volumes were aligned to the anterior-posterior comissura line and consisted of 18 axial slices with 5.5 mm thickness including 0.5 mm interslice gap, flip angle: 90°, excitation time: 60 ms, field of view: 220 × 200 mm, matrix 64 × 64 voxels. A sparse-sampling acquisition protocol [32] with 8 s repetition time and 2 s acquisition time was used. The protocol makes use of the hemodynamic lag between stimulus onset and BOLD peak and allowed for EEG recording without interfering scanner noise and gradient artifacts during a 6 s silent gap between successive volume acquisitions. The first three images from each session are eliminated from the analysis.
2) EEG data acquisition
EEG were recorded continuously at 5 kHz with an amplifier placed inside the MR-scanner (BrainProducts, Germany). Subjects were fitted with elastic cap containing 30 Ag/AgCl electrodes (FP1, FP2, F7, F3, Fz, F4, F8, T7, C3, Cz, C4, T8, P7, P3, Pz, P4, P8, O1, OZ, O2, FC5, FC1, FC2, FC6, CP5, CP1, CP2, CP6, EOG, ECG) referenced to FCz, impedances were kept low below 5kΩ. The helium pump was turned off for the duration of the experiment to avoid related artifacts [33].
All preprocessing and statistical analyses reported next is done in Matlab (www.mathworks.com) with the academic freeware toolboxes SPM2 (http://www.fil.ion.ucl.ac.uk/spm2.), EEGLAB (http://sccn.ucsd.edu/eeglab/), and customized functions.
3) fMRI preprocessing
All images were realigned to the first image in the time series to correct for head movement and then normalized to the Montreal Neurological Institute (MNI) reference space, and were resliced to a voxel size of 3 mm3 and smoothed with a 8 mm FWHM Gaussian kernel. Ninety regions of interest (ROIs) are calculated based on the anatomical automatic labeling (AAL) atlas [34], and the normalized mean of each ROI is used as a representative for that region. The volume mean is regressed out from each ROI. The ninety ROI time courses are normalized to have zero mean and unit variance, and are linearly detrended. Use of ROIs help lower the dimensionality of the dataset while retaining information from the different structural regions.
4) EEG preprocessing
Continuous EEGs were filtered from 1–45 Hz (25 dB/octave) and then down-sampled offline to 500 Hz. EEG epochs from -312 to 712 ms (512 points) around stimulus onsets were recalculated to average reference and subjected to an individual tICA as implemented in EEGLAB [35]. This step was used to identify and remove pulse and eye movement artifacts from the data retaining minimally 20 out of 30 components [36], [37]. Single-trials were then wavelet-denoised [16], constraining the single-trial EEGs to time-frequency features relevant to the evoked activity. The amplitude of the single trial ERPs at each frame have been decorrelated from the general response to the target so as to focus on investigating the electrophysiological activity and not some general features in the evoked response to targets. At each latency the trial-to-trial dynamics are convolved with the HRF to make the correspondence with the fMRI time courses. The average of four fronto-central electrodes (Fz, FC1, FC2, and Cz) is used in the rest of the analysis as these electrodes have shown to exhibit maximum AMs in a previous study [8]. As a data reduction, we restrict our analysis to 360 ms (90 consecutive samples) after stimulus onset. This data reduction does not affect the analysis as the most relevant components in the EEG response to oddball stimuli are known to occur within the first 300-400 ms after stimulus onset. The data is then normalization to zero mean and unit variance.
5) Fusion analysis
Each dataset is whitened using principal component analysis (PCA) and the principal components are entered into the M-CCA. The EEG data is found to be rank defficient with 25 non-zero eigen-values while the fMRI data has full-column rank. Hence, the dimensionality of the EEG data entering the M-CCA is 25 while that of the fMRI data is 90. To estimate the robustness of the method, we perform multi-set CCA on the orthogonal data from both modalities from all subjects using a leave-one-out cross validation scheme (LOOCV) and report the mean results. In the LOOCV, the fMRI and EEG data from one subject is left out of each analysis, resulting in fifteen iterations of the M-CCA. After the transform matrices A are obtained using M-CCA, the spatial and temporal components are obtained using least-squares approximation, as explained in Section III-A.
V. Results
From the 25 component associations obtained through M-CCA, we focus on the two most correlated variations over trials as these showed maximum amplitude modulations as well as interesting spatial activation. For each cross-modality association, we discuss the trial-to-trial variations captured in the A vectors for both the modalities, the fMRI spatial component, and the EEG temporal component.
A. Trial-to-trial correlations
The average over subjects of the cross-modality and within-modality correlations are listed in Table 1. The average cross-modality correlation for the first component pair is 0.3816 and for the second component pair is 0.3370. The average correlations within the fMRI data are stronger as compared to that within the EEG data. This is due to the larger inter-subject variability in the EEG data.
TABLE 1.
Average Cross-Modality and Within-Modality Correlations Across Subjects
| Component number | Average correlations | ||
|---|---|---|---|
| across modality | within fMRI datasets | within EEG datasets | |
| component 1 | 0.38 | 0.79 | 0.38 |
| component 2 | 0.34 | 0.77 | 0.34 |
B. Trial-to-trial amplitude modulations
We analyzed the trial-to-trial variations to check for evidence of learning in the form of amplitude modulations both across sequences at the minute scale for long term habituation as well as within sequence for short term learning. We averaged the weights of the trial-to-trial modulations at the time on trial over the 12 targets within each of the 18 sequences to obtain the average amplitude for each sequence. Then, an average over the two sessions was calculated to obtain the across sequence average. Similarly, the within sequence averages are calculated by averaging over the 18 sequences for each of the 12 targets.
We observed slow learning showing approximately linear trends for both associations (see Fig. 4(a) and (d)). The weights from the trial-to-trial modulation for the fMRI component best fit to a linear trend given by slope (−0.351) and intercept (1.1408) while for the EEG component best fit a slope of (−0.1974) and an intercept of (0.6343). For the second component the fMRI best fit is −0.2053x + 0.6978 and the EEG best fit is −0.1075x + 0.3230. The first component pair shows faster habituation than the second component pair. Also, the fMRI has higher slope than the EEG. No significant short term trends were found in the within sequence averages.
Fig. 4.
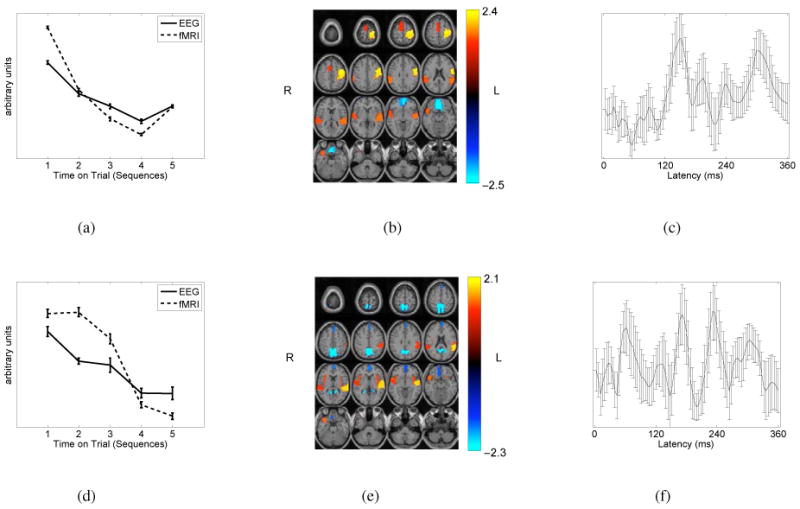
For component 1: (a) Average trial-to-trial variations for the first 5 sequences and standard error bars for fMRI and EEG, (b) thresholded average fMRI map (Z = 1.5) showing high activation in pre-and postcentral gyrus (yellow) along with slightly lower activation in supplementary motor area, supra-marginal gyrus, and the superior temporal gyri and pole (orange) and deactivation in superior orbito-frontal cortex, medial orbito-frontal cortex, and rectus gyri (cyan/blue), and (c) the squared average of the EEG component. For component 2: (d) Average trial-to-trial variations for the first 5 sequences and standard error bars for fMRI and EEG, (e) thresholded average fMRI map (Z = 1.5) showing high activation in superior temporal gyrus (yellow) with slightly lower activation in insula, supra-marginal gyrus, and the superior temporal gyri and pole (orange) and high deactivation in precuneus (cyan) along with slightly lower deactivation in medial frontal gyrus, orbito-frontal gyrus, and rectus (blue) and (f) the squared average of the EEG component.
C. fMRI activation maps
The fMRI activation for the first component (see Fig. 4 (b)) showed large signal increases in the pre-and postcentral gyrus (left), which are primary motor and primary somatosensory areas, respectively. Also significant signal decreases are seen in the superior orbito-frontal cortex (left), medial orbito-frontal cortex, and rectus gyri—all of which are known to be part of the default mode network. The orbitofrontal cortex is related to memory, learning, and expectation. Additionally slightly lower activation is seen in the supplementary motor area (right), supra-marginal gyrus (right), and the superior temporal gyri and pole (right).
The second component (see Fig. 4 (e)) shows high activation in superior temporal gyrus (left) and also high inverse relation with the precuneus, which is another part of the default mode network. Lower activation is seen in the medial frontral gyrus (left), orbito-frontal gyrus (left), rectus gyrus (right), insula, supra-marginal (left), and superior temporal gyrus (right) and pole (right). The high activation in the second component does not overlap with high activation in the first component. However, there is overlap with the lower activations. Tables 2 and 3 summarize the AAL labels and Z-scores for highly activated and highly deactivated ROIs in component 1 and component 2, respectively.
TABLE 2.
fMRI Component 1: AAL labels With |Z| ≥ 1.5
| AAL Label | ROI number | Z score |
|---|---|---|
| Precentral_L 2002 | 2 | 2.44 |
| Postcentral_L 6002 | 58 | 2.31 |
| Frontal_Sup_Orb_L_2112 | 6 | −2.11 |
| Frontal_Med_Orb_R_2612 | 25 | −2.00 |
| Frontal_Med_Orb_L 2612 | 26 | −2.33 |
| Rectus_R 2701 | 27 | −2.37 |
| Rectus_L 2702 | 28 | −2.54 |
| Supp_Motor_Area_R 2401 | 19 | 1.65 |
| SupraMarginal_R 6211 | 63 | 1.90 |
| Temporal_Sup_R 8111 | 81 | 1.76 |
| Temporal_Sup_L 8112 | 82 | 1.88 |
| Temporal_Pole_Sup_R 81217 | 83 | 1.82 |
TABLE 3.
fMRI Component 2: AAL Labels with |Z| ≥ 1.5
| AAL Label | ROI number | Z score |
|---|---|---|
| Precuneus_R 6301 | 67 | −2.33 |
| Precuneus_L 6302 | 68 | −2.22 |
| Temporal_Sup_L 8112 | 82 | 2.08 |
| Frontal_Sup_Medial_L 2602 | 24 | −1.67 |
| Frontal_Med_Orb_L 2612 | 26 | −1.53 |
| Rectus_R 2701 | 27 | −1.59 |
| Insula_R 3001 | 29 | 1.58 |
| Insula_L 3002 | 30 | 1.55 |
| SupraMarginal_L 6212 | 64 | 1.54 |
| Temporal_Sup_R 8111 | 81 | 1.51 |
| Temporl_Pole_Sup_R 8121 | 83 | 1.69 |
D. EEG time-courses
The latency jitter and convolution makes it difficult to make inferences about the EEG data. Also since the average response is removed, the EEG components are not expected to show peaks as seen by methods which include the ERP is in the data. We do not observe any abrupt transients in the components, see Fig. 4 (c) and (f). The information from the EEG time courses lies in the trial to trial amplitude modulations shown in Fig. 4 (a) and (d).
VI. Discussion
We have introduced an effective data fusion approach to fuse single trial EEG data with fMRI data using M-CCA. The proposed approach offers a number of advantages over existing methods for analyzing concurrently acquired fMRI and EEG data. Being a data-driven approach, it minimizes the modeling assumptions about the cross-modality relationships between fMRI and EEG data. Its multivariate nature allows for inferences about connectivity across functional networks as opposed to univariate methods that only allow for local inferences. Our M-CCA based approach to fusion naturally performs group analysis and is flexible as it can be applied to multiple modalities and subjects. Unlike methods performing source separation on each modality separately [12], our M-CCA-based fusion technique performs the source decomposition taking into account the statistical properties not only within each modality but also across modalities. It is based on second order statistics and is less constrained than methods involving higher order statistics such as statistical independence. Additionally, it does so without making strong assumptions such as a shared trial-to-trial amplitude modulation matrix for both modalities, as in [14].
Next, we highlight the key findings from our results. Our approach identifies covariation in the trial-to-trial modulations of the two modalities and uses a linear mixing model to decompose the data into spatial activation components for fMRI and temporal components for EEG according to this covariation pattern. The results indicate that the within modality correlations of trial-to-trial modulations are stronger in the fMRI data as compared to the EEG data. The smoothness of the data and thus the sensitivity to jitter is much different across these two modalities. As expected, the correlations identified across subjects for the EEG data are not very high since the EEG data have been decorrelated from the standard response to the paradigm thus removing much of the common signal across subjects. The slow drift AMs seen in our results are approximately linearly decreasing for the first four to five sequences and then tend to increase or flatline over the next sequences. The decreasing trend can be explained by possible habituation to the occurrence of alternating random and regular TTI. This is different from the AMs seen in previous work on this dataset [12] where there was a steady linearly decreasing trend over the sequences. The spatial locations in the first fMRI component involve activations expected in auditory target processing and highly overlap with the target processing contrast maps obtained in [8] for the same task. The difference in our finding here is that the inverse association with the default mode network is suppressed during the task. Moreover, we did not see the high activation in the anterior cingulate gyrus seen in [8]. However, the temporal lobe activation and motor activation that we find to be associated with AM was not seen in [8].
The deactivated areas observed in both AM-related spatial components are part of the default mode network (DMN), which is known to be consistently anti-correlated with task-related activations [38], [39]. The DMN has been observed to consist of subnetworks that differ in their interactions with other networks [40], [41]. In our results, we observe such division in interactions as we see that the orbito-frontal part of the DMN is mainly associated with motor activation in the precentral and postcentral gyri while the precuneus part of the DMN is closely associated with the temporal activation. These default mode network activation patterns are similar to those reported to be related to the amplitude modulated P2 and N2 peaks [8]. The results obtained, thus differ from the GLM approaches of prediction-based integration method in [8] and the decompose and correlate technique used in [12]. The three methods provide complementary perspectives, each with different strengths and weaknesses, to the same problem, and hence help discover different and complementary aspects of the problem.
The M-CCA based method we present in this paper for fusion of simultaneously acquired data is flexible and significantly reduces the modeling assumptions on the data, however, as with any method it has some limitations as well. Using only the trial-to-trial correlations across the datasets results in component maps that are not as sparse as other methods, especially those based on independent component analysis, which usually emphasize super-Gaussian sources and hence emphasize sparsity. The spatial maps obtained by M-CCA-based fusion show the connectivity across a number of functional areas. Sparse components however, tend to be somewhat easier to interpret as they usually contain fewer functional areas. Incorporating a sparseness constraint to the spatial maps may provide a way to address this limitation. Another consideration while using the proposed method is that we do not use the entire spatial or temporal resolution of the data as this would result in overfitting. Instead we reduce the redundancy in the data by using an ROI-based analysis for fMRI and by using an average of the four fronto-central electrodes and subsampling the EEG. Previously, the largest task-related amplitude modulation had been observed in the four fronto-central electrodes used in our study. However, using a sub-set of the electrodes does not utilize the spatial information from the multi-channel EEG recordings. As an extension to the current method, one can try to use more or all the electrodes in the M-CCA fusion approach with each electrode as a separate dataset. Another promising extension to the current approach is the investigation of non-linear associations across the modalities by incorporating higher-order statistics into the cost-function used for the fusion analysis.
We have presented an effective data-driven approach to fusion that uses a single cost to identify cross-modality associations across simultaneously acquired fMRI and EEG data. To test and compare our method, we have used data consisting of a pattern learning that stimulates subjective predictability/expectation which results in AMs in the EEG occurring at certain latencies. Through our results, we have shown that the proposed method identifies AMs in the trial-to-trial covariations, which show linearly decreasing trends indicating habituation to the task. The corresponding fMRI spatial components show activations in areas linked to sensory function as well as learning and expectation. From the results, we conclude that the proposed data-driven approach to the fusion of simultaneously acquired fMRI and EEG data identifies interesting and physiologically meaningful associations across the modalities. This method is an attractive multivariate tool that provides an alternative to previous model-based approaches as well as more constrained approaches.
Acknowledgments
This research was supported in part by the NIH grants R01 EB 005846 and R01 EB 000840, and the NSF grant 0612076.
Footnotes
Publisher's Disclaimer: This is a PDF file of an unedited manuscript that has been accepted for publication. As a service to our customers we are providing this early version of the manuscript. The manuscript will undergo copyediting, typesetting, and review of the resulting proof before it is published in its final citable form. Please note that during the production process errors may be discovered which could affect the content, and all legal disclaimers that apply to the journal pertain.
References
- 1.Calhoun VD, Adalı T. Feature-based Fusion of Medical Imaging Data. IEEE Trans Inf Tech in Biomedicine. 2009;13:1–10. doi: 10.1109/TITB.2008.923773. [DOI] [PMC free article] [PubMed] [Google Scholar]
- 2.Hopfinger JB, Khoe W, Song AW. Combining electrophysiology with structural and functional neuroimaging: ERPs, PET, MRI and fMRI. In: Handy TC, editor. Event Related Potentials A Methods Handbook. MIT Press; Cambridge: 2005. pp. 345–380. [Google Scholar]
- 3.Horwitz B, Poeppel D. How can EEG/MEG and fMRI/PET data be combined? Human Brain Mapping. 2002;17(1):1–3. doi: 10.1002/hbm.10057. [DOI] [PMC free article] [PubMed] [Google Scholar]
- 4.Makeig S, Jung TP, Sejnowski TJ. Having your voxels and timing them too? In: Sommer F, Wichert A, editors. Exploratory Analysis and Data Modeling in Functional Neuroimaging. The MIT Press; Cambridge: 2002. pp. 195–207. [Google Scholar]
- 5.Bonmassar G, Schwartz DP, Liu AK, Kwong KK, Dale AM, Belliveau JW. Spatiotemporal brain imaging of visual-evoked activity using interleaved EEG and fMRI recordings. NeuroImage. 2001;13:1035–1043. doi: 10.1006/nimg.2001.0754. [DOI] [PubMed] [Google Scholar]
- 6.Liu AK, Belliveau JW, Dale AM. Spatiotemporal imaging of human brain activity using functional MRI constrained magnetoencephalography data: Monte Carlo simulations. Proc Natl, Acad Sci (PNAS) 1998;95:8945–8950. doi: 10.1073/pnas.95.15.8945. [DOI] [PMC free article] [PubMed] [Google Scholar]
- 7.Bledowski C, Prvulovic D, Hoechstetter K, Scherg M, Wibral M, Goebel R, Linden DEJ. Localizing P300 generators in visual target and distractor processing: A combined event-related potential and functional magnetic resonance imaging study. J Neuroscience. 2004;24:9353–9360. doi: 10.1523/JNEUROSCI.1897-04.2004. [DOI] [PMC free article] [PubMed] [Google Scholar]
- 8.Eichele T, Specht K, Moosmann M, Jongsma M, Quiroga R, Nordby H, Hugdahl K. Assessing the spatiotemporal evolution of neuronal activation with single-trial event-related potentials and functional MRI. Proc Nat Acad Sci (PNAS) 2005;102:17798–17803. doi: 10.1073/pnas.0505508102. [DOI] [PMC free article] [PubMed] [Google Scholar]
- 9.Calhoun VD, Adalı T, Pearlson GD, Kiehl KA. Neuronal chronometry of target detection: Fusion of hemodynamic and event-related potential data. NeuroImage. 2006;30:544–553. doi: 10.1016/j.neuroimage.2005.08.060. [DOI] [PubMed] [Google Scholar]
- 10.Correa NM, Li YO, Adalı T, Calhoun VD. Canonical correlation analysis for feature-based fusion of biomedical imaging modalities and its application to detection of associative networks in schizophrenia. IEEE J Sel Topics Sign Proc. 2008;2(6):998–1007. doi: 10.1109/JSTSP.2008.2008265. [DOI] [PMC free article] [PubMed] [Google Scholar]
- 11.Goldman RI, Stern JM, Engel J, Jr, Cohen MS. Acquiring simultaneous EEG and functional MRI. Clinical Neurophysioloy. 2000;111:1974–1980. doi: 10.1016/s1388-2457(00)00456-9. [DOI] [PubMed] [Google Scholar]
- 12.Eichele T, Calhoun V, Moosmann M, Specht K, Jongsma M, Quiroga R, Nordby H, Hugdahl K. Unmixing concurrent EEG-fMRI with parallel independent component analysis. Int J Psychophysiology. 2008;67(3):222–34. doi: 10.1016/j.ijpsycho.2007.04.010. [DOI] [PMC free article] [PubMed] [Google Scholar]
- 13.Martinez-Montes E, Valdes-Sosa P, Miwakeichi F, Goldman R, Cohen M. Concurrent EEG/fMRI analysis by multiway partial least squares. NeuroImage. 2004;22:1023–1034. doi: 10.1016/j.neuroimage.2004.03.038. [DOI] [PubMed] [Google Scholar]
- 14.Moosmann M, Eichele T, Nordby H, Hudgdahl K, Calhoun V. Joint independent component analysis for simultaneous EEG-fMRI: Principle and simulation. Int J Psychophysiology. 2008;67:212–221. doi: 10.1016/j.ijpsycho.2007.05.016. [DOI] [PMC free article] [PubMed] [Google Scholar]
- 15.Debener S, Ullsperger M, Siegel M, Fiehler K, Yves von Cramon D, Engel AK. Trial-by-trial coupling of concurrent electroencephalogram and functional magnetic resonance imaging identifies the dynamics of performance monitoring. J Neuroscience. 2005;25:11730–11737. doi: 10.1523/JNEUROSCI.3286-05.2005. [DOI] [PMC free article] [PubMed] [Google Scholar]
- 16.Quian Quiroga R, Garcia H. Single-trial event-related potentials with wavelet denoising. Clinical Neurophysiology. 2003;114(2):376–390. doi: 10.1016/s1388-2457(02)00365-6. [DOI] [PubMed] [Google Scholar]
- 17.Spencer KM. Averaging, detection, and classification of single-trials ERPs. In: Handy TC, editor. Event Related Potentials A Methods Handbook. MIT Press; Cambridge, MA: 2005. pp. 209–228. [Google Scholar]
- 18.Stevens M, Calhoun VD, Kiehl KA. fMRI in an oddball task: effects of target-to-target interval. Psychophysiology. 2005;42:636–642. doi: 10.1111/j.1469-8986.2005.00368.x. [DOI] [PubMed] [Google Scholar]
- 19.Kettenring J. Canonical analysis of several sets of variables. Biometrika. 1971;58:433–451. [Google Scholar]
- 20.Li YO, Wang W, Adalı T, Calhoun VD. Joint blind source separation by multi-set canonical correlation analysis. IEEE Trans Sign Proc. 2009;57(10):3918–3929. doi: 10.1109/TSP.2009.2021636. [DOI] [PMC free article] [PubMed] [Google Scholar]
- 21.Calhoun VD, Adalı T, Liu J. A feature-based approach to combine functional MRI, structural MRI, and EEG brain imaging data. Proc EMBS. 2006;1:3672–3675. doi: 10.1109/IEMBS.2006.259810. [DOI] [PubMed] [Google Scholar]
- 22.Correa NM, Li YO, Adalı T, Calhoun VD. Fusion of fMRI, sMRI, and EEG data using canonical correlation analysis. Proc IEEE Int Conf Acoust, Speech, Sign Proc (ICASSP) 2009:385–388. [Google Scholar]
- 23.Hotelling H. Relations between two sets of variates. Biometrika. 1936;28:321–377. [Google Scholar]
- 24.Sun QS, Zeng SG, Heng PA, Xia DS. Feature fusion method based on canonical correlation analysis and handwritten character recognition. Proc Int Conf Control, Automation, Robotics, and Vision. 2004:1547–1552. [Google Scholar]
- 25.Yan X, Cao L, Huang DS, Li K, Irwin G. A novel feature fusion approach based on blocking and its application in image recognition. Proc Int Conf on Intelligent Computing Part 1. 2006:1085–1091. [Google Scholar]
- 26.Xu X, Mu Z. Feature fusion method based on KCCA for ear and profile face based multimodal recognition. Proc Int Conf Automation and Linguistics. 2007:620–623. [Google Scholar]
- 27.Shan C, Gong S, McOwan P. Beyond facial expressions: learning human emotion from body gestures. British Machine Vision Conference 2007 [Google Scholar]
- 28.Sargın M, Yemez Y, Erzin E, Murat AM. Audiovisual synchronization and fusion using canonical correlation analysis. IEEE transactions on Multimedia. 2007;9(7):1396–1403. [Google Scholar]
- 30.Friman O, Borga M, Lundberg P, Knutsson H. Exploratory fMRI analysis by autocorrelation maximization. Neuroimage. 2002;16:454–464. doi: 10.1006/nimg.2002.1067. [DOI] [PubMed] [Google Scholar]
- 30.Li YO, Wang W, Adalı T, Calhoun VD. CCA for joint blind source separation of multiple datasets with application to group fMRI analysis. Proc IEEE Int Conf Acoust, Speech, Sign Proc (ICASSP) 2008:1837–1840. [Google Scholar]
- 31.Li YO, Wang W, Adalı T, Calhoun VD. A group study of simulated driving fMRI data by multiset canonical correlation analysis. Proc Human Brain Mapping. 2009 doi: 10.1007/s11265-010-0572-8. [DOI] [PMC free article] [PubMed] [Google Scholar]
- 32.Hall DA, Haggard MP, Akeroyd MA, Palmer AR, Summerfield AQ, Elliott MR, Gurney EM, Bowtell RW. “Sparse” temporal sampling in auditory fMRI. Human Brain Mapping. 1999;7(3):213–223. doi: 10.1002/(SICI)1097-0193(1999)7:3<213::AID-HBM5>3.0.CO;2-N. [DOI] [PMC free article] [PubMed] [Google Scholar]
- 33.Ravicz ME, Melcher JR, Kiang NY. Acoustic noise during functional magnetic resonance imaging. J Acoust Soc Am. 2000;108:1683–1696. doi: 10.1121/1.1310190. [DOI] [PMC free article] [PubMed] [Google Scholar]
- 34.Tzourio-Mazoyer N, Landeau B, Papathanassiou D, Crivello F, Etard O, et al. Automated anatomical labeling of activations in SPM using a macroscopic anatomical parcellation of the MNI MRI single-subject brain. NeuroImage. 2002;15:273–289. doi: 10.1006/nimg.2001.0978. [DOI] [PubMed] [Google Scholar]
- 35.Delorme A, Makeig S. EEGLAB: an open source toolbox for analysis of single-trial EEG dynamics. J Neuroscience Methods. 2004;134:9–24. doi: 10.1016/j.jneumeth.2003.10.009. [DOI] [PubMed] [Google Scholar]
- 36.Debener S, Strobel A, Sorger B, Peters J, Kranczioch C, Engel AK, Goebel R. Improved quality of auditory event-related potentials recorded simultaneously with 3-T fMRI: removal of the ballistocardiogram artefact. NeuroImage. 2007;34(2):587–597. doi: 10.1016/j.neuroimage.2006.09.031. [DOI] [PubMed] [Google Scholar]
- 37.Jung TP, Makeig S, Humphries C, Lee TW, Mckeown MJ, Iragui V, Sejnowski TJ. Removing electroencaphalographic artifacts by blind source separation. Psychophysiology. 2000;37:163–178. [PubMed] [Google Scholar]
- 38.Fox MD, Snyder AZ, Vincent JL, Corbetta M, Van Essen DC, Raichle ME. The human brain is intrinsically organized into dynamic, anticorrelated functional networks. Proc Nat Acad Sci (PNAS) 2005;102(27):9673–9678. doi: 10.1073/pnas.0504136102. [DOI] [PMC free article] [PubMed] [Google Scholar]
- 39.Fox MD, Zhang D, Snyder AZ, Raichle ME. The Global Signal and Observed Anticorrelated Resting State Brain Networks. J Neurophysiology. 2009;101:3270–3283. doi: 10.1152/jn.90777.2008. [DOI] [PMC free article] [PubMed] [Google Scholar]
- 40.Uddin LQ, Clare Kelly AM, Biswal BB, Castellanos FX, Milham MP. Functional connectivity of default mode network components: correlation, anticorrelation, and causality. Human Brain Mapping. 2009;30:625–637. doi: 10.1002/hbm.20531. [DOI] [PMC free article] [PubMed] [Google Scholar]
- 41.Kim D, Manoach DS, Mathalon D, Turner J, Brown G, Ford JM, Gollub RL, et al. Dysregulation of working memory and default-mode networks in schizophrenia during a Sternberg item recognition paradigm: an independent component analysis of the multisite Mind and fBIRN studies. Human Brain Mapping. 2009;30(11):3795–3811. doi: 10.1002/hbm.20807. [DOI] [PMC free article] [PubMed] [Google Scholar]