Abstract
It has been challenging for clinicians using current imaging modalities to visualize internal structures and detect lesions inside human prostates. Lack of contrast among prostatic tissues and high false positive or negative detection rates of prostate lesions have limited the use of current imaging modalities in the diagnosis of prostate cancer. In this study, Acoustic Radiation Force Impulse (ARFI) imaging is introduced to visualize the anatomic and abnormal structures in freshly excised human prostates. A modified Siemens Antares™ ultrasound scanner and a Siemens VF10-5 linear array were used to acquire ARFI images. The transducer was attached to a three-dimensional (3D) translation stage, which was programmed to automate volumetric data acquisition. A depth dependent gain (DDG) method was developed and applied to 3D ARFI datasets to compensate for the displacement gradients associated with spatially varying radiation force magnitudes as a function of depth. Nine human prostate specimens were collected and imaged immediately after surgical excision. Prostate anatomical structures such as seminal vesicles, ejaculatory ducts, peripheral zone, central zone, transition zone and verumontanum were visualized with high spatial resolution and in good agreement with McNeal's zonal anatomy. The characteristic appearance of prostate pathologies, such as prostate cancerous lesions, benign prostatic hyperplasia, calcified tissues and atrophy were identified in ARFI images based upon correlation with the corresponding histological slides. This study demonstrates that ARFI imaging can be used to visualize internal structures and detecting suspicious lesions in the prostate and appears promising for image guidance of prostate biopsy.
Keywords: Acoustic radiation force, ultrasound, elasticity, prostate anatomy, cancer
Introduction
Prostate cancer is the most common non-skin cancer and the second leading cause of cancer death in American men. According to the American Cancer Society (ACS), there are over 186,000 new cases diagnosed and over 28,000 prostate cancer deaths annually in the United States (ACS, 2008). Early prostate cancer detection is essential for improving treatment outcomes and survival rates (Carter and Coffey, 1990). Imaging techniques capable of delineating prostate structures and abnormalities can play an integral role in prostate cancer management. However, current imaging techniques are suboptimal in detecting prostate cancers, limited by either the inability to differentiate different prostatic tissue types or inaccuracies of identifying prostate cancers (Halpern et al, 2002). Needle biopsy remains the gold standard for prostate cancer diagnosis.
Currently, prostate needle biopsy is usually guided with transrectal ultrasound (TRUS). Physicians can target hypoechic regions under the guidance of TRUS. However, up to 40% of prostate cancers are isoechoic and thus invisible under traditional ultrasound imaging(Akin and Hricak, 2007). Some benign processes, such as prostatitis, benign prostatic hyperplasia (BPH) and atrophy can appear hypoechic (Shinohara et al, 1989). The inability of ultrasound to identify cancerous regions results in random or systematic placement of cores within prostates during needle biopsy procedures. Usually, 6-12 biopsy cores are taken systematically within the prostatic glands without targeting suspicious regions. With the tiny amount of prostatic tissue contained in a biopsy core, the sampling error is high. In more than 1 million prostate biopsies performed each year, cancer detection rates on first biopsy are as low as 25%-36% (Akin and Hricak, 2007; Pallwein et al, 2008b; Elabbady and Khedr, 2006), with repeat biopsy procedures demonstrating cancer in 10-35% of cases (Elabbady and Khedr, 2006; Hernden et al, 2008; Pallwein et al, 2008b), and up to 20% of men requiring three or more distinct biopsy sessions for diagnosis(Pallwein et al, 2008b).
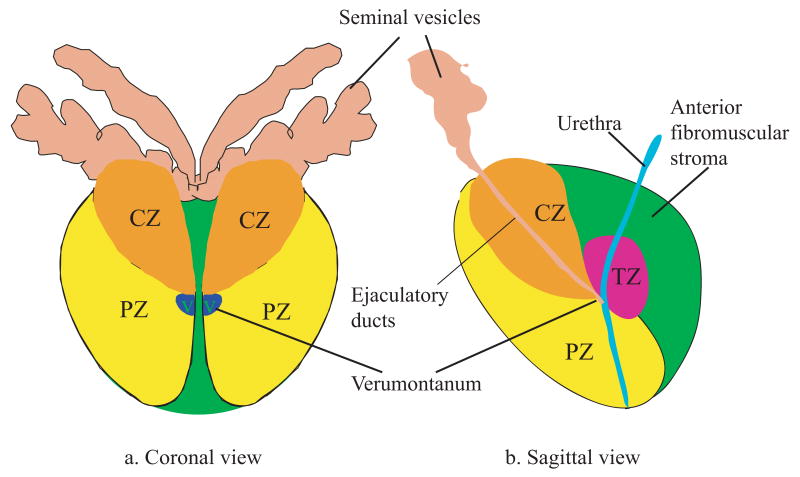
Prostate lesions such as BPH and adenocarcinomas are known to preferentially occur in different glandular zones (Taneja, 2006; Augustin et al, 2004). Imaging techniques capable of identifying the anatomic structures would be beneficial. Figure 1 shows the coronal and sagittal diagrams of a normal human prostate based on McNeal's zonal anatomy (McNeal et al, 1986). It divides the human prostate into three glandular zones (peripheral (PZ), transitional (TZ) and central (CZ)) and one non-glandular zone(the anterior fibromuscular stroma). Around 70-85% of prostate cancer occurs in the PZ; BPH primarily develops in the TZ (McNeal et al, 1986; Oesterling, 1991).
Figure 1.
Diagrams of McNeal's zonal anatomy of the human prostate (McNeal, 1981). It divides a human prostate into one non-glandular zone (the anterior fibromuscular stroma), and three glandular zones: central zone, peripheral zone, and transition zone, denoted by CZ, PZ, TZ respectively.(a) Coronal section of the prostate. V represents the verumontanum. (b) Sagittal section of the prostate. In the top part of the diagram, the seminar vesicles and ductus deferens enter the central zone and connect to the ejaculatory ducts, which merge with the urethra at the verumontanum.
Pathological processes change the mechanical properties of prostatic tissue, which is the basis for physicians to palpate prostatic abnormalities during digital rectal exam (DRE). Mechanical measurements have been performed to quantify the elastic properties of prostatic tissues (Parker et al, 1998; Krouskop et al, 1998; Jalkanen et al, 2006; Phipps, 2006; Zhang et al, 2008). The results reveal that prostate cancer is stiffer than benign prostatic hyperplasia (BPH) and normal prostate tissue, which provides opportunities for elasticity imaging techniques to resolve prostatic lesions. Recently, elastography has been introduced and evaluated for guiding prostate needle biopsies (Konig et al, 2005; Tsutsumi et al, 2007; Pallwein et al, 2008b; Salomon et al, 2008). In a recent clinical study on 109 patients scheduled for radical prostatectomy, Salomon et al. reported the sensitivity and specificity of detecting prostate cancer using elastography to be 75.5% and 76.6%, and an overal accuracy of 76% as compared to 67% for TRUS (Salomon et al, 2008). In another clinical trial, Pallwein et al. reported a sensitivity of 86% and a specificity of 72% using real-time elastography guided needle biopsy on 492 patients (Pallwein et al, 2008b). While these studies suggest real-time elastography is promising to provide better image guidance of prostate needle biopsy, challenges are also reported. During elastography, compression of the prostate is accomplished using a hand-held rectal probe and it can be difficult to achieve a uniform stress inside the prostate. This non-uniform stress can create ‘artificial’ stiff regions in elastography images that increase the false positive rate and decrease tissue contrast in the images (Tsutsumi et al, 2007; Salomon et al, 2008). In addition, the detection rates in the basal area are reported to be low (Tsutsumi et al, 2007; Salomon et al, 2008; Pallwein et al, 2008b). It is also reported that BPH and prostatitis can appear stiff; thus they are not always discernible from prostate cancer in elastography (Pallwein et al, 2008a). One potential solution to overcome the problem of non-uniform compression is to use acoustic radiation force to excite the tissue inside the prostate gland, which is independent of angle or degree of probe compression on the prostate.
Acoustic radiation force impulse (ARFI) imaging is an ultrasonic method that images the mechanical properties of tissue (Nightingale et al, 2000, 2001). Instead of applying an external compression or vibration, ARFI imaging delivers high intensity, focused acoustic beams inside the tissue to generate acoustic radiation force, and resolves structures of different stiffness by monitoring the resultant displacement responses. Under the same acoustic radiation force, the displacement amplitude is inversely related to the local tissue stiffness. Acoustic radiation force is caused by a momentum transfer from the acoustic waves to the propagation medium (Nyborg, 1965). In soft tissues, the magnitude of acoustic radiation force is determined by the acoustic attenuation of the medium, the pulse average acoustic intensity and the speed of sound in the medium (Nyborg, 1965). The goal of this paper is to determine the characteristic appearances of prostate anatomic structures and pathologies in ARFI images.
Methods
ARFI imaging parameters
A modified Siemens Antares scanner and a Siemens VF10-5 linear array (Siemens Medical Solutions USA, Inc., Ultrasound Division, Issaquah, WA) were used to generate custom ARFI beam sequences. The array contains 192 elements, whose dimensions are 5 mm in height and 0.2 mm in width. The lateral beam spacing is 0.15 mm. To decrease heat generation and shorten ARFI data acquisition time, a 4:1 parallel receive sequencing technique was used (Dahl et al, 2007). The detailed ARFI imaging parameters are shown in Table 1. The lateral field of view (LFOV) of an ARFI dataset was 26.4 mm.
Table 1.
ARFI parameters for imaging human prostates ex vivo
| Excitation beam | Tracking beam* | |
|---|---|---|
| Center frequency (MHz) | 5.7 | 10.0 |
| Lateral focal depth (mm) | 15 | 15 |
| Elevational focal depth (mm) | 20 | 20 |
| Transmit F/# | 1.5 | 2.0 |
| Lateral line spacing (mm) | 0.6 | 0.15 |
| Total number of locations | 44 | 4×44 |
| Excitation Isppa.7 (W/cm2) | 1,663 | |
| Excitation pulse duration (μs) | 53 | |
| PRF of track lines (kHz) | 9.2 |
The tracking beams are standard B-mode beams.
Experimental procedures
This study was approved by the institutional review board (IRB) of the Duke University Medical Center. Informed patient consent was waived by the IRB as imaging was performed post-resection. Nine fresh prostate specimens (A - I) were obtained immediately (within 15 minutes) after radical prostatectomy, and placed in an isotonic saline bath at room temperature (24°C). A custom prostate holder was used to stabilize the specimens during imaging. In order to image the prostate in the same orientation that is used in transrectal ultrasound and ARFI prostate imaging in vivo, the imaging probe was positioned over the posterior side of each prostate specimen, imaging the axial view of the normal anatomy. The posterior surface of each specimen was positioned parallel to the transducer surface. Figure 2 shows the experimental setup.
Figure 2.
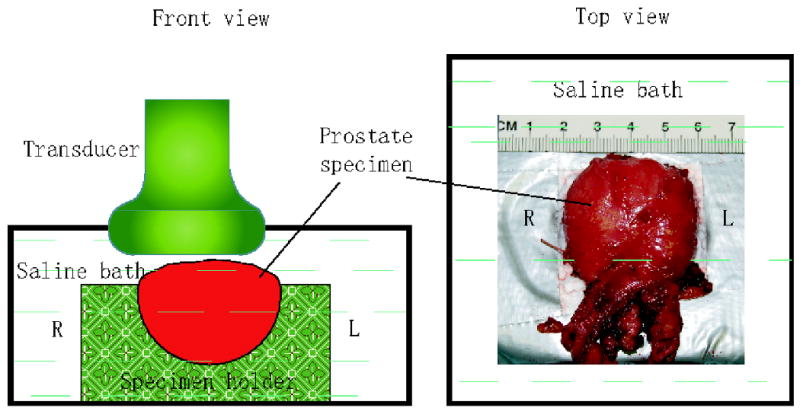
Experimental setup of ARFI imaging of human prostates ex vivo. Prostate specimens were placed in a custom specimen holder submerged in isotonic saline with the posterior side facing up. The ultrasound transducer was positioned on the top. The ‘L’ and ‘R’ denote the corresponding left and right sides of the prostate in normal human anatomy.
Volumetric data acquisition of each prostate specimen was performed by mechanically translating the imaging probe. During this study, the probe was mounted to a Newport three-dimensional (3D) translation stage (Newport Corporation, 1791 Deere Ave.,Irvine, CA 92606, USA). The scanner and translation stage were controlled and coordinated by a custom written Labview program (National Instruments, Austin, Texas, USA). At each axial plane of the prostate, the program triggered the scanner to initiate a 2D ARFI acquisition and then commanded the motion controller to move the probe in the elevation direction to the next axial plane upon the completion of the 2D data acquisition. IQ data were recorded for off-line displacement calculation. The elevation increment between planes was 1 mm. Since the lateral dimension of the prostate specimens was usually larger than the lateral field of view (LFOV) of ARFI images, the left and right half volumes were acquired separately and then combined together in the post-processing. An overlapping region of at least 3 mm in the lateral direction was maintained for data registration. 3D data acquisition took 20 to 30 minutes depending on specimen size.
After completion of data acquisition, prostate specimens were returned to the surgical pathology lab for regular histological analysis. Histological sections were cut along either the lateral-axial (axial view) or lateral-elevational (coronal view) imaging plane every 3-5 mm, and then were divided into small pieces (5 μm thick) to mount on microscope slides. The locations of each section were recorded to facilitate correlation with ARFI images. The standard haematoxylin and eosin (H&E) staining method was used for all specimens. During histological analysis, anatomic landmarks (i.e. urethra and ejaculatory ducts), cancerous regions and BPH were identified in all slides by a pathologist blinded to ARFI images. A Gleason's score was assigned for each identified cancerous region.
Data processing
For each tracking location, ARFI displacements were estimated using Loupas' algorithm (Loupas et al, 1995) based on the pre-push and post-push track beams. Phase wrapping and aliasing errors can be problems in estimating large ARFI displacements. To solve this problem, displacements were computed using the following steps:
Calculate relative displacements in time using adjacent post-push tracking beams;
Calculate the absolute displacements at the last time step (6 ms) by using the pre-push reference tracking beam.
Accumulate all relative displacements and calculate the absolute displacements at all times using displacements at 6 ms as a reference.
Displacement data at 0.23 ms after ARFI push pulses at every tracking location were used for the following analysis.
To form a full 3D volume from data acquired from two sides of the specimen, the two datasets in a given plane were first aligned according to the translation distances recorded during the experimental procedures. Then a two dimensional (2D) cross-correlation method was performed to determine the potential specimen motion between the two B-mode images within a range of 0.5 mm, and register the two datasets accordingly. Both B-mode and ARFI data were juxtaposed together to form images of a full axial plane. Surrounding fluid regions were segmented based on the brightness values in B-mode images and masked blue in ARFI images. The 3D volume data were formed by stacking the 2D images together in elevation. Finally, the volume data (both B-mode and ARFI) were linearly interpolated to a uniform spacing of 0.1 mm in all three dimensions.
Because of the non-uniform spatial distribution of acoustic radiation force, the force amplitude is depth dependent and influenced by both the focal gain and attenuation of the tissue. Thus, displacement gradients along the axial direction are expected in ARFI images (Nightingale et al, 2000, 2006). This axial gradient can confound interpretation of ARFI images and make it difficult to evaluate the relative stiffness at different depths. To compensate for this effect, a depth dependent gain (DDG) algorithm was applied to each 3D ARFI dataset: ARFI displacements were normalized by the median displacement in each lateral-elevational plane. Image data were cropped axially below the focal depth, where the median displacement first dropped to 1 μm. The penetration depths in the prostates in this study were 15-18 mm.
Image evaluation
In order to determine the characteristic appearance of anatomic zonal structures and prostatic pathologies in ARFI images, these features were first identified in either the histological slides, B-mode images or McNeal zonal anatomy, then evaluated in the ARFI images. Based on the anatomical landmarks and notes taken during the pathological sectioning, histological slides were registered with ARFI images. The alignment between ARFI images and histological slides was within 3 mm. Structures such as urethra, BPH, prostate cancer and atrophy were identified in the histological slides, and their appearances were evaluated in the corresponding ARFI images. Focal cancerous lesions with their smallest dimension of 3 mm or larger as measured in the histological slides were evaluated and reported. Anatomic zones were identified by comparing ARFI images to McNeal zonal anatomy (Figure 1). Calcifications were identified in B-mode images as hyperechoic regions. Cancers introduce lateral asymmetry in ARFI images; this asymmetry was quantified by calculating the contralateral contrast-to-noise ratio (CNR) for each cancerous lesion identified in coronal ARFI images. The cancer boundaries were outlined manually by visually inspecting the relative stiffness as compared to the surrounding tissue. Lesion dimensions were measured in both ARFI data and the histological slides. Regions on the contra-lateral sides were selected based on anatomic symmetry. CNRs were computed for both ARFI and B-mode images using the formula:
| (1) |
where μ1, μ2, σ1 and σ2 are the mean image brightness values and the standard deviations in the suspicious cancerous region and its contra-lateral region, respectively. Because the displacement amplitude is inversely related to the tissue stiffness, the contra-lateral stiffness ratio (SR) was defined as:
| (2) |
Results
Figure 3 shows matched B-mode and ARFI images of an axial section acquired from specimen A. The full axial view was synthesized from the two datasets (left and right) acquired in the same lateral-axial plane. Figures 3b and 3c are the same axial section of ARFI images before and after DDG. In contrast to the strong focal gain in Figure 3b, Figure 3c presents a more axially uniform displacement distribution, which improves structural visualization in the near and far field. In the ARFI images, brightness represents the displacement amplitude. For a given radiation force, more compliant tissues are displaced further. Thus, brighter regions in ARFI images indicate softer tissues (Palmeri, 2005). The imaging plane in Figure 3 intersects the PZ, TZ and verumontanum (green arrows).
Figure 3.
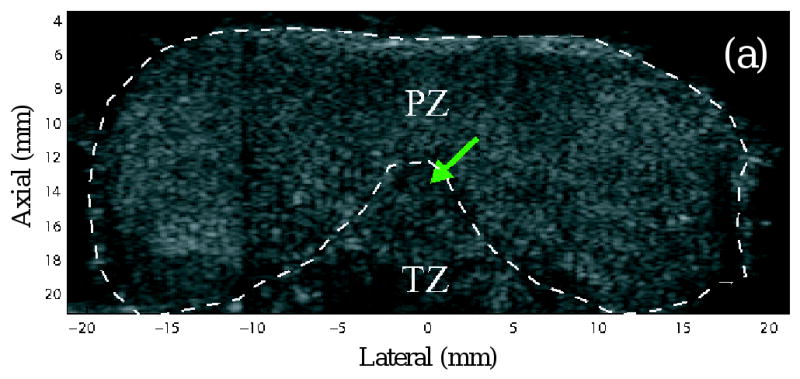
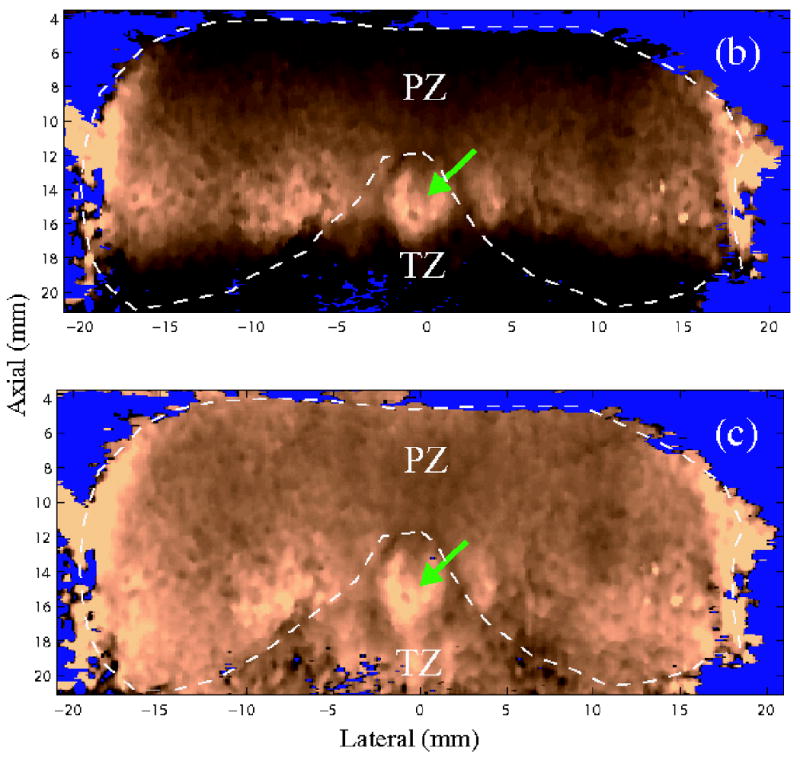
Images of an axial section. (a) B-mode image (b) ARFI image before depth dependent gain (DDG) normalization (c) ARFI image after DDG normalization. The images are synthesized from the two datasets acquired on the two sides of the specimen. The green arrows point to the verumontanum. PZ and TZ represent the peripheral zone and transition zone respectively. Fluid regions were segmented from the B-mode image and masked with blue color.
Normal anatomic structures/zones
Figure 4 shows ARFI images of specimen A in orthogonal views. ARFI displacement data were normalized using the DDG algorithm. The top row shows the axial view (lateral-axial plane) and the sagittal view (elevational-axial plane); the second row shows the coronal views (lateral-elevational planes) at three axial depths (5.8, 11.6 and 16.1 mm from the transducer surface). The white dashed lines indicate the intersections of the orthogonal planes. The ARFI coronal sections are displayed using the normal anatomic position with the prostate base on the top and apex at the bottom. This specimen was from the youngest patient (in his early 40's) in this study, and had regular prostate zonal anatomy without TZ enlargement. These anatomical structures were recognized by comparing ARFI images to the diagrams in Figure 1. At the depth of 5.8 mm, Figure 4c portrays the homogeneous glandular tissue in the PZ. At the the depth of 11.6 mm, Figure 4d depicts the CZ as a stiff structure with a heart shape in the base area. According to Equation 2, the CZ-to-PZ stiffness ratio (SR) was computed to be 1.8. The verumontanum (purple arrow) appears softer compared to surrounding tissues. Subtle stiffness variations across the PZ are observed in this plane. At the depth of 16.1 mm, the TZ is circled with green dashed lines in Figure 4e, which demonstrates a similar stiffness to the PZ. A moderately stiffer band is sometimes seen surrounding the TZ with an opening towards the apex. This stiff band was more obvious in the specimens with enlarged TZs (Figures 5, 6 and 7), and appeared to be correlated with a layer of fibromuscular tissue surrounding the TZ as determined by histological analysis. The opening was observed in all specimens and consistently corresponded to the urethra locations, where the urethra runs through the TZ and connects to the apex outlet. The overall bilateral symmetry of this specimen in the axial and the coronal views is well preserved.
Figure 4.
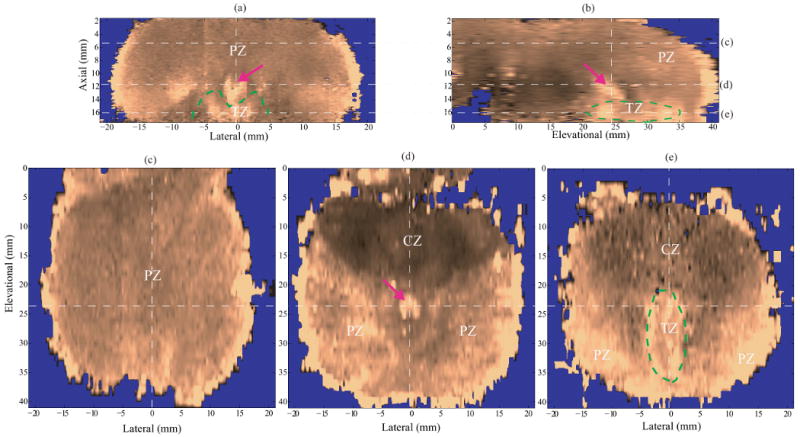
ARFI images of anatomic structures in specimen A after DDG. (a) axial section, (b) sagittal section, (c)-(e) coronal sections at different axial depths (5.8, 11.6, and 16.1 mm, respectively). The dashed white lines indicate the intersections of the orthogonal planes in the images. The zonal structures are well correlated with those in the diagrams of prostate anatomy (Figure 1), and denoted with PZ, CZ and TZ. In the coronal sections, the prostate images are oriented with the basal area on the top and apex region at the bottom. The CZ is located in the base and appear stiffer than other anatomical structures. The verumontanum (purple arrow) is located in the middle of the prostate and shown softer than the surrounding tissue.
Figure 5.
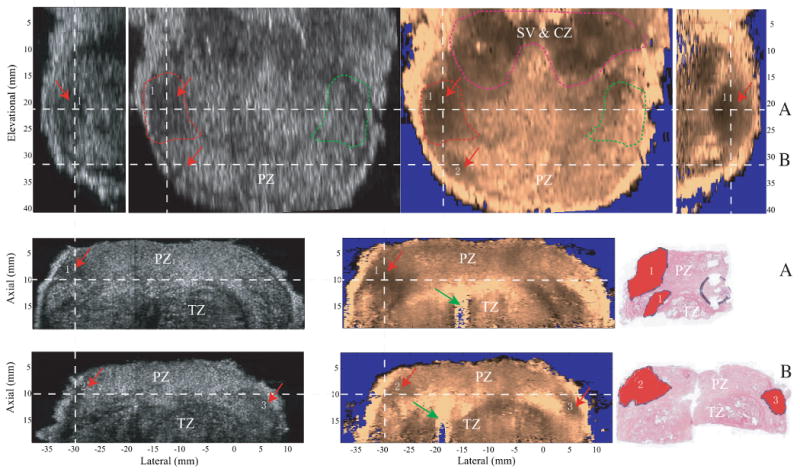
Orthogonal views of prostate lesions in specimen C and the corresponding histological slides in the axial view. The gray scale B-mode images are shown on the left side and ARFI images are shown on the right. The top row shows the sagittal views (on the two sides) and coronal views (in the middle) of the prostate. The second and third rows the two axial views with the corresponding histological slides. The white dashed lines indicate the relative alignment of the imaging planes to one another. Section A and B are the axial sections taken from dashed lines A and B in the coronal view. Cancerous regions are indicated by red arrows and labeled with numbers in both B-mode and ARFI images, and masked red in the histological slides. The coronal plane is centered in the circled cancerous lesion on the left side of the prostate, whose contra-lateral side is circled with green dashed lines. The contra-lateral CNR of this lesion was computed based on these two circled regions. In the top part of the coronal view, seminal vesicles (SV) and CZ are identified as stiff structures and circled with pink dashed lines. Inside the TZ, the urethra is indicated by green arrows in the two axial ARFI images.
Figure 6.
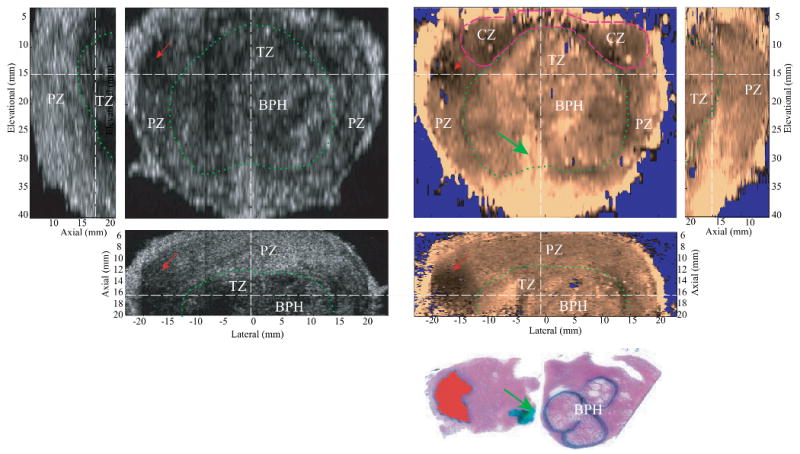
Matched B-mode and ARFI images of the typical appearance of BPH with the corresponding axial histological slide. The relative alignment between planes are indicated by the dashed white lines. The PZ and CZ are distorted from the BPH-enlarged TZ (circled in dashed green line). The TZ is seen surrounded by a stiffer band corresponding to a layer of fibromuscular tissue. The soft structure running through the TZ and connected to the apex is the urethra (green arrow), which is marked in green in the histological slide. The nodular texture inside the TZ was correlated to the growth of BPH nodules, which are circled with black ink in the histological slide. A prostate cancer on the left side of the specimen appears stiffer in ARFI images and hypoechoic in the B-mode images. The lesion is masked red in the histological slide.
Figure 7.
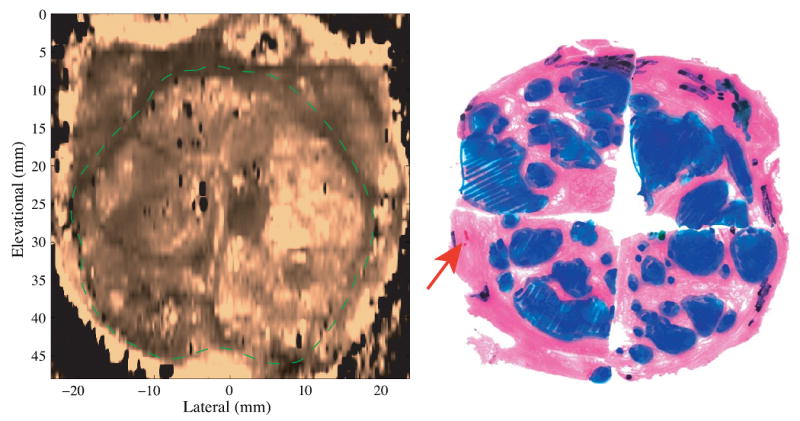
Coronal ARFI image of BPH with the matched histological slide. The TZ is circled with the dashed green line. The heterogeneous, nodular structures inside the TZ correspond to the presence of BPH nodules. In the histological slide, BPH, cancer and atrophy are masked blue, red and black respectively. The Gleason's score is 3+3.
Prostate cancer
Figure 5 shows cancerous lesions in both B-mode and ARFI images with the corresponding axial histological slides. The spatial relationship of the orthogonal planes is indicated by the dashed white lines. Data were acquired on specimen C. The top row shows the sagittal (two sides) and coronal views (middle) of the specimen. The coronal views were taken in the PZ at an axial depth of 10 mm. The seminal vesicles (SV) and CZ are identified as stiff symmetric structures in the base area and circled with pink dashed lines. Cancerous regions are indicated by red arrows and labeled with numbers in ARFI images. Two stiff cancerous regions (1 and 2) are identified on the left side, which disrupt the bilateral stiffness symmetry in the coronal ARFI image. The two axial planes (along dashed lines A and B) through the two cancerous regions are displayed in the second and the third rows with the corresponding histological slides (right). The histological slide in plane A corresponds to the left half of the ARFI axial image. Three discrete cancerous lesions larger than 3mm in all dimensions were identified and colored red in the two histological slides and matched with the stiff regions in ARFI images. In plane A, the two separate cancerous regions in the histological slide are not separable in the ARFI image, thus were considered one lesion (lesion #3) in Table 2. This cancerous lesion is seen as a hypoechoic region in the B-mode image. The contra-lateral CNRs of B-mode and ARFI coronal images were computed based on the circled regions in the coronal images (the cancerous region and its contra-lateral side are circled with red and green dashed lines, respectively). The CNR is 1.7 for the B-mode image and 3.2 for the ARFI image. The lesion size was measured to be 8.3 mm (lateral) by 12.2 mm (elevation) and 12.5 mm (axial) from the volumetric ARFI data. In plane B, two cancerous lesions (2 and 3) are clearly seen in the ARFI images, but are not visualized in the corresponding B-mode images.
Table 2.
Prostate cancerous focal lesions over 3mm in histological slides
| Lesion number | Gleason's Score | Lesion size (x,y,z (mm)) | Contra-lateral CNR | SR | ||
|---|---|---|---|---|---|---|
| Histology | ARFI | ARFI | B-mode | |||
| 1 | 3+2 | 16.2, -, 5.8 | - | - | - | - |
| 2 | 3+2 | 4.1, -, 8.0 | - | - | - | - |
| 3 | 4+4 | 7.9, -, 13.4 | 8.3, 12.2, 12.5 | 3.2 | 1.7 | 2.3 |
| 4 | 4+3 | 12.0, -, 10.9 | 8.7, 6.7, 6.8 | 1.9 | 0.5 | 3.0 |
| 5 | 3+4 | 5.8, -, 6.7 | 4.9, 5.6, 6.8 | 0.8 | 0.3 | 3.5 |
| 6 | 4+5 | 6.3, -, 22.0 | 6.4, 6.7, 7.8* | 1.8 | 0.8 | 3.0 |
| 7 | 4+3 | 5.9, 9.3, - | 7.5, 8.1, 11.0 | 2.1 | 0.3 | 1.7 |
The measurable z dimension of the lesion. The bottom of the lesion was out of the the axial range of ARFI images due to the attenuated acoustic radiation force at depth.
In the 9 excised prostate specimens, 3 cases had diffusely distributed prostate cancer (A, G and I with Gleason's scores of 3+3, 3+4 and 3+2 respectively); 2 cases (H and E) had only a few cancerous foci (less than 0.5 mm). In the remaining 4 cases, 7 focal lesions with their smallest dimensions of 3 mm or greater were identified in the histological slides. Table 2 provides a summary of these 7 lesions and their appearance in the corresponding ARFI images. For the histological results, lesion dimensions were measured from the 2D histological slides; a ‘-’ means the measurement was not available.
Benign prostatic hyperplasia (BPH)
Figure 6 shows the typical appearance of BPH in B-mode and ARFI images with the corresponding axial histological slide from specimen D. The orthogonal planes are centered inside the TZ. The zonal structures are circled and marked in the images. Due to the enlargement of the TZ, the glandular structures of this specimen were distorted. The TZ pushed both the PZ and CZ towards the prostate boundaries and became the predominant zone inside the prostate. In the ARFI image, a moderately stiff band is observed around the TZ corresponding to fibromuscular tissue in the histological slide. Nodular texture is also seen inside the TZ in ARFI images, which corresponds to BPH nodules in the histological slide. In the axial histological slide, BPH nodules are circled in black, prostate cancer is masked with red and the urethra is inked green. When seen in ARFI images, individual BPH nodules can present with two different appearances. Most of the nodules appear stiffer towards the boundaries with softer centers, while some nodules appear to be uniformly stiff spherical inclusions. Inside the TZ, the periurethral region (indicted by the green arrows) appears softer than the surrounding tissue. The orthogonal images also show a cancerous lesion in the left PZ (red arrow). The bottom of the coronal ARFI image is saturated due to the longer water path at this region resulting in larger applied radiation force not compensated for by the DDG.
Figure 7 shows another coronal ARFI image (left) of BPH with the matched histological slide (right). The data were acquired from specimen H. Again, in the ARFI image, the TZ is surrounded by a stiff boundary (dashed green line), with heterogeneous structures that correspond to BPH nodules (masked blue in the histological slide). In the histological slide, in addition to the BPH nodules, a few cancerous foci (less than 0.5 mm) were identified and masked red (red arrow, Gleason's score 3+3), and atrophy was masked black.
Calcifications and atrophy
Figure 8 shows the typical appearance of calcifications (prostate stones) and atrophied tissue in ARFI images. The data were taken from specimen E. The calcified tissue is indicated by the green arrows, which are seen as bright hyperechoic spots in the B-mode image, and bright spots (large displacement amplitudes) in the ARFI images. Some shadowing effects are observed in the regions below calcifications in the axial and sagittal ARFI images. In the third row, the histological slide corresponds to the left half of the coronal imaging plane. Atrophied regions are colored in orange, which appear stiff in ARFI images and hypoechoic in the B-mode images. Seen from the axial and sagittal ARFI views, the coronal section was taken at a shallow depth inside the PZ where a uniform ARFI image stiffness would be expected in a healthy prostate. However, the presence of atrophy (circled in yellow) appears to stiffen the prostate glands. In addition, a small cluster of cancerous cells (less than 0.5 mm, Gleason's score 3+3) was identified in the histology slide and colored in blue.
Figure 8.
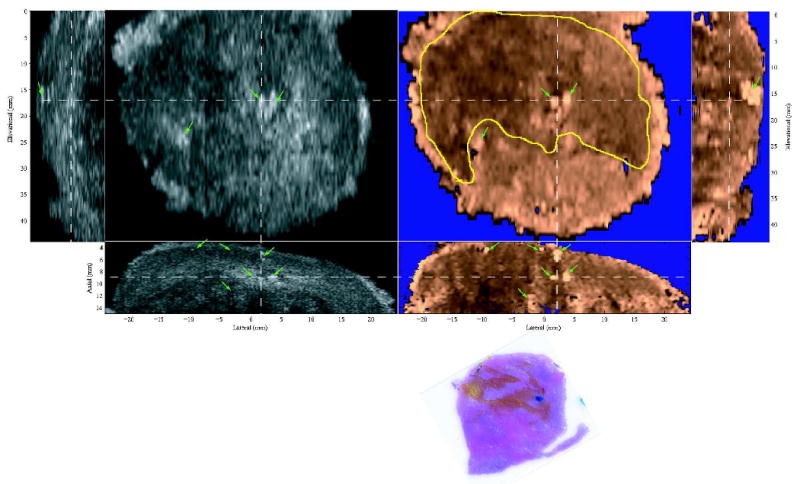
Typical appearance of prostatic calcifications and atrophies in orthogonal B-mode (left) and ARFI (right) images. White dashed lines indicate the relative alignment of the three orthogonal planes. On the third row, the histological slide is a coronal section and corresponding to the left half of the coronal images. The atrophies are colored in orange. A cancerous focus is masked blue. Green arrows point to calcified regions, which are shown hyperechoic in the B-images and bright spots in the ARFI images. The atrophied tissues (circled in yellow) look hypoechoic in the B-mode images and stiff in the ARFI images.
Discussion
This paper presents the initial data obtained using ARFI imaging techniques to visualize anatomic structures and abnormalities inside human prostates. In the nine excised human prostate specimens imaged in this study, structural details such as anatomic zones, BPH, cancerous lesions, calcifications and atrophy were visualized in the volumetric ARFI data, and their characteristic appearances in ARFI images were summarized. Although this ex vivo study was performed with a linear array which cannot be used during in vivo imaging, relative positions between the probe and the prostate were similar to that used in vivo. Based upon the promising results reported here, we have implemented 3D ARFI imaging on a transrectal curvilinear array with a mechanical wobbler (EV9F4, Siemens Medical Solutions) and have initiated a study of 3D ARFI prostate imaging in vivo. We have observed similar appearances of prostate zonal anatomy and pathologies in the in vivo data obtained to date (Zhai, 2009). The study reported here provides the foundation for in vivo implementation, and investigated the potential of prostate ARFI imaging for improving current prostatic disease detection and management. Specifically, ARFI imaging may provide imaging guidance of prostate needle biopsy to allow targeting suspicious regions, which would potentially increase the diagnostic accuracy and reduce the required number of biopsy cores.
Figure 3 demonstrated the effect of the DDG algorithm. As seen in Figure 3b, the spatially varying radiation force amplitude can confound the structural stiffness contrast in the axial ARFI images, and make it difficult to interpret the relative stiffness at different depths. This effect has been discussed previously by Nightingale et al.(Nightingale et al, 2006). Accurate compensation for the varying force amplitude requires a comprehensive knowledge of the acoustic attenuation and spatial distribution of the acoustic energy in the imaging plane, both of which are not readily available under clinical conditions. During this study, an assumption of a constant acoustic attenuation coefficient for each specimen was made. Each specimen was carefully positioned to maintain a parallel orientation between the transducer face and the specimen surface, so that the acoustic power coupled through the posterior surface of each specimen was similar at every excitation location. Therefore, the acoustic power at a given depth would be equal assuming a constant attenuation of the tissue. Under this condition, the coronal ARFI image taken at a fixed axial depth reflects the relative tissue stiffness without the influence of the acoustic radiation force focal gains. Although this assumption is oversimplified and can introduce artifact in general, the DDG algorithm improves the overall structural visualization in all axial and sagittal ARFI images, and provides a reasonable solution to compensate for the effect of the spatially non-uniform force amplitudes in a 3D volume of ARFI data.
Figure 4 demonstrates the normal zonal anatomy of a human prostate in ARFI images, which is in good agreement with McNeal's zonal prostate model(Figure 1). The images portray the CZ to be stiffer than the PZ. Based on the inverse of the displacement ratio, the SR is computed to be 1.8, which is in good agreement with the shear moduli ratios measured by magnetic resonance elastography (Dresner et al, 1999). We hypothesize that this stiffness difference may be explained by the different morphological structures between the CZ and PZ. In contrast to the small and simple acini in the PZ, the acini in the CZ are large and complex and have more infolding structures (McNeal, 1981). This may provide extra support when central zone tissues are under stress. The increased stiffness of the CZ may contribute to the lower cancer detection rates in the basal area reported in elastography studies (Tsutsumi et al, 2007; Salomon et al, 2008; Pallwein et al, 2008b). In ARFI images, the TZ is heterogeneous, with a mean stiffness that is similar to the PZ; and the verumontanum looks softer. Interestingly, elastography studies have reported the CZ to be softer than the PZ; and the TZ to be stiffer than the PZ; and that the verumontanum is a stiff structure (Kallel et al, 1999; Souchon et al, 2003). These discrepancies may due to the different excitation methods and physiologic conditions of the prostate during imaging.
Identifying anatomic zones is clinically important. Around 70-85% of prostate carcinoma is located in the PZ, 20-25% in the TZ (McNeal et al, 1986; Oesterling, 1991),and roughly 2.5% in the CZ (Cohen et al, 2008). However, due to the enlargement of the TZ, the shapes and distribution of these glands change with a man's age, which can confound imaging findings. In the nine specimens in this study, only one specimen (Figure 4) from the youngest patient (in his early 40's) exhibited a regular distribution of the glandular structures. In older patients (Figures 6 and 7), the TZ is significantly larger and changes the zonal distribution. Despite the morphological changes, basic characteristics in ARFI images remained the same. The zonal structures were well visualized in ARFI images for all specimens. The ability of ARFI imaging to define these anatomic zones may help with decision-making when used to guide prostate needle biopsy.
During this study, the coronal view was found to be the best orientation to view both the anatomic structures and overall symmetry of the gland in ARFI images. The same finding was reported in an MR imaging study of the prostate gland (Hricak et al, 1987). Besides the geometric symmetry and relatively larger area in this view, the contrast between different structures in this plane seems better preserved than in the other views. Therefore, CNRs and SRs of prostate lesions were computed in this view, and all prostate lesions were first identified in this view during data evaluation. However, this does not exclude the utility of the other views, which contain the depth information and can also help identify different structures.
All focal cancerous lesions were found to be stiffer than the surrounding PZ tissue with definable boundaries, and to disrupt the bilateral symmetry of the gland with the contra-lateral stiffness ratios ranging from 1.3 to 3.5 (Table 2) in ARFI images. These stiffness ratios are in good agreement with those reported in the literature (Krouskop et al, 1998; Zhang et al, 2008). The increased stiffness has been attributed to the increased cellular densities in the cancerous regions (Phipps, 2006; Jalkanen et al, 2006). The stiffness of prostate cancer may be correlated to its Gleason's score, which quantifies the aggressiveness of prostate cancer. As seen in Table 2, all focal lesions that were visualized in ARFI images had a Gleason sum greater than 6. This result suggests ARFI imaging may help increase the diagnosis accuracy in detecting clinically significant cancers when used to guide prostate needle biopsy. Similar results were reported in elastography studies in that higher detection rates were associated with tumors with higher Gleason's scores (Sumura et al, 2007; Salomon et al, 2008). However, due to the limited number of specimens in this study, a definitive conclusion on the relationship between the Gleason's scores and visualization in ARFI images could not be determined.
Figures 6 and 7 show the typical appearance of BPH in ARFI images. Two distinguishing features of BPH in the TZ were observed. First, the fibromuscular tissue separating the TZ from the PZ and CZ forms a mostly closed stiff band in the ARFI coronal images, which is also visible as a hypoechoic layer in the B-mode images in most cases. Second, the verumontanum is usually shown as a soft ‘V’ shape in ARFI coronal images, which can be used to locate the TZ. The enlarged TZ can displace the PZ and CZ and distort the anatomical structures. In ARFI images, BPH nodules appear highly heterogeneous and have nodular textures. Some BPH nodules can be much stiffer than others. Multiple groups evaluating elastography for guiding prostate needle biopsy reported difficulties of differentiating prostate lesions from BPH nodules, both of which are shown as hard inclusions (Pallwein et al, 2008b; Sumura et al, 2007; Salomon et al, 2008). However, the shapes of BPH nodules in ARFI images seem to be more regular (spherical) than the cancerous lesions. Both the location (TZ) and nodule textures can help differentiate BPH from cancerous lesions in ARFI images. In this study, no specimen had prostate cancers in the TZ. Thus, further studies are needed to evaluate ARFI imaging of cancerous TZ lesions.
Figure 8 shows the typical appearance of prostate calcifications or prostate stones and atrophy in ARFI images. Regions of calcification were shown with higher displacement amplitudes as compared to surrounding tissues. However, prostate stones have been reported to stiffen prostate tissue (Jalkanen et al, 2006) and appeared as stiff inclusions in elastography (Lorenz et al, 1999). This apparent disparity is likely due to the fact that prostate stones are highly scattering of acoustic waves (hyperechoic in B-mode) and may be more attenuating, both of which will result in greater radiation forces applied to these calcifications/prostate stones than to the surrounding tissue. In addition, because of their high stiffness, calcifications act as small rigid bodies, whose displacement are dictated by the force and the surrounding supportive tissue rather than their material stiffness. These factors can lead to great displacements in spite of the fact that they are stiffer than the surrounding tissue. The bright appearance of prostate stones in ARFI images makes them easily differentiable from both BPH and prostate cancer.
There are some limitations of this study. First, the ex vivo setup cannot be translated to perform in vivo studies directly. Typically, in vivo prostate imaging is performed with a curvilinear, end-firing array transrectally instead of a linear array. However, this initial study is necessary to characterize the typical appearances of different prostatic tissues. We have subsequently implemented ARFI imaging on a 3D wobbler transrectal probe. Similar stiffness contrast among zonal structures and prostate pathologies have been observed in our preliminary in vivo prostate ARFI data (Zhai, 2009). Second, correlation between ARFI images and histological slides was challenging for several reasons: 1)the shapes and sizes of specimens usually change after tissue fixation prior to histological sectioning; 2)histological sectioning was performed manually every 3-5 mm and the sectioning plane can differ from the imaging plane. These challenges can result in misalignment between ARFI images and histological slides. In this study, anatomic landmarks and locations of the histological slides based on the sectioning notes were carefully inspected to ensure the registration was within 3 mm. Finally, the penetration of ARFI excitation pulses in the prostate was limited to 15-18 mm, which can miss some prostate lesions in depth. ARFI sequences using multi-focal pushing pulses or lowering the frequency of excitation beams may be beneficial.
Conclusion
A 3D ARFI imaging system has been implemented for ex vivo prostate studies. A DDG method was introduced to overcome artifacts from the depth dependent radiation force amplitude in ARFI images. Based on nine prostate specimens, the characteristic appearances of anatomic zones, prostate cancer, BPH and calcifications were determined in the ARFI images. The study provides a foundation for in vivo prostate ARFI imaging, and suggests that ARFI imaging has the potential to provide an accurate method of visualizing different prostatic structures and pathologies and for guiding targeted prostate needle biopsy.
Acknowledgments
The authors would like to thank Dr. Gregg Trahey and Dr. Jeremy Dahl for their valuable insights in this project, in addition to Siemens Medical Ultrasound for their technical support. This work is supported by NIH 1R01 CA-114075 and US ARMY Prostate Cancer Research Program (W81XWH-08-1-0132).
Footnotes
Publisher's Disclaimer: This is a PDF file of an unedited manuscript that has been accepted for publication. As a service to our customers we are providing this early version of the manuscript. The manuscript will undergo copyediting, typesetting, and review of the resulting proof before it is published in its final citable form. Please note that during the production process errors may be discovered which could affect the content, and all legal disclaimers that apply to the journal pertain.
References
- ACS. Cancer facts & figures 2008. Atlanta: American Cancer Society; 2008. [Google Scholar]
- Akin O, Hricak H. Imaging of prostate cancer. Radiologic Clinics of North America. 2007;45(1):207–222. doi: 10.1016/j.rcl.2006.10.008. [DOI] [PubMed] [Google Scholar]
- Augustin H, Erbersdobler A, Hammerer P, Graefen M, Huland H. Prostate cancers in the transition zone: Part 2; clinical aspects. BJU international. 2004;94(9):1226–9. doi: 10.1111/j.1464-410X.2004.05147.x. [DOI] [PubMed] [Google Scholar]
- Carter H, Coffey D. The prostate: an increasing medical problem. Prostate. 1990;16:39–48. doi: 10.1002/pros.2990160105. [DOI] [PubMed] [Google Scholar]
- Cohen R, Shannon B, Phillips M, Moorin R, Wheeler T, Garrett K. Central zone carcinoma of the prostate gland: a distinct tumor type with poor prognostic features. The Journal of Urology. 2008;179(5):1762–7. doi: 10.1016/j.juro.2008.01.017. [DOI] [PubMed] [Google Scholar]
- Dahl J, Palmeri M, Agrawal V, Nightingale K, Trahey G. A parallel tracking method for acoustic radiation force impulse imaging. IEEE Trans Ultrason Ferroelec, Freq Contr. 2007;54(2):301–12. doi: 10.1109/tuffc.2007.244. [DOI] [PMC free article] [PubMed] [Google Scholar]
- Dresner M, Rossman P, Ehman R. MR elastography of the prostate. Proceedings of International Society for Magnetic Resonance in Medicine. 1999 [Google Scholar]
- Elabbady A, Khedr M. Extended 12-core prostate biopsy increases both the detection of prostate cancer and the accuracy of gleason score. European Urology. 2006;49:49–53. doi: 10.1016/j.eururo.2005.08.013. [DOI] [PubMed] [Google Scholar]
- Halpern E, Cochlin D, Goldberg B. Imaging of the Prostate. Informa Healthcare. 2002 September 19, 2002. [Google Scholar]
- Hernden P, Naylor B, SHelley MD, Clements H, Coles B, Mason MD. The clinical management of patients with a small volume ofprostatic cancer on biopsy: what are the risks of progression? Cancer. 2008;112(5):971–981. doi: 10.1002/cncr.23277. [DOI] [PubMed] [Google Scholar]
- Hricak H, Dooms GC, McNeal JE, Mark AS, Marotti M, Avallone A, Pelzer M, Proctor EC, Tanagho EA. MR imaging of the prostate gland: normal anatomy. American Journal of Roentgenology. 1987;148(1):51–58. doi: 10.2214/ajr.148.1.51. [DOI] [PubMed] [Google Scholar]
- Jalkanen V, Andersson B, Bergh A, Ljungberg B, Lindahl O. Resonance sensor measurements of stiffness variations in prostate tissue in vitro–a weighted tissue proportion model. Physiol Meas. 2006;27(12):1373–86. doi: 10.1088/0967-3334/27/12/009. [DOI] [PubMed] [Google Scholar]
- Kallel F, Price R, Konofagou E, Ophir J. Elastographic imaging of the normal canine prostate in vitro. Ultrason Imaging. 1999;21(3):201–15. doi: 10.1177/016173469902100304. [DOI] [PubMed] [Google Scholar]
- Konig K, Scheipers U, Pesavento A, Lorenz A, Ermert H, Senge T. Initial experiences with real-time elastography guided biopsies of the prostate. J Urol. 2005;174(1):115–117. doi: 10.1097/01.ju.0000162043.72294.4a. [DOI] [PubMed] [Google Scholar]
- Krouskop T, Wheeler T, Kallel F, Garra B, Hall T. Elastic moduli of breast and prostate tissues under compression. Ultrason Imaging. 1998;20:260–274. doi: 10.1177/016173469802000403. [DOI] [PubMed] [Google Scholar]
- Lorenz A, Sommerfeld H, Garcia-Schurmann M, Philippou S, Senge T, Ermert H. A new system for the acquisition of ultrasonic multicompression strain images of the human prostate in vivo. Ieee Transactions on Ultrasonics Ferroelectrics and Frequency Control. 1999;46(5):1147–54. doi: 10.1109/58.796120. [DOI] [PubMed] [Google Scholar]
- Loupas T, Peterson R, Gill R. Experimental evaluation of velocity and power estimation for ultrasound blood flow imaging, by means of a two-dimensional blood flow imaging using autocorrelation technique. IEEE Trans Ultrason, Ferroelec, Freq Contr. 1995;42:689–699. [Google Scholar]
- McNeal J. The zonal anatomy of the prostate. Prostate. 1981 doi: 10.1002/pros.2990020105. [DOI] [PubMed] [Google Scholar]
- McNeal J, Bostwick D, Kindrachuk R, Redwine E, Freiha F, Stamey T. Patterns of progression in prostate cancer. Lancet. 1986;1:60–3. doi: 10.1016/s0140-6736(86)90715-4. [DOI] [PubMed] [Google Scholar]
- Nightingale K, Nightingale R, Palmeri M, Trahey G. A finite element model of remote palpation of breast lesions using radiation force: Factors affecting tissue displacement. Ultrasonic Imaging. 2000;22(1):35–54. doi: 10.1177/016173460002200103. [DOI] [PubMed] [Google Scholar]
- Nightingale K, Palmeri M, Nightingale R, Trahey G. On the feasibility of remote palpation using acoustic radiation force. JASA. 2001;110(1):625–634. doi: 10.1121/1.1378344. [DOI] [PubMed] [Google Scholar]
- Nightingale K, Palmeri M, Nightingale R, Trahey G. Analysis of Contrast in Images Generated with Transient Acoustic Radiation Force. Ultrasound Med Biol. 2006;32(1):61–72. doi: 10.1016/j.ultrasmedbio.2005.08.008. [DOI] [PubMed] [Google Scholar]
- Nyborg W. Acoustic streaming. In: Mason W, editor. Physical Acoustics. IIB. Academic Press Inc; New York: 1965. pp. 265–331. Ch. 11. [Google Scholar]
- Oesterling J. The origin and development of benign prostatic hyperplasia. an age-dependent process. J Androl. 1991;12(6):348–55. [PubMed] [Google Scholar]
- Pallwein L, Aigner F, Faschingbauer R, Pallwein E, Pinggera G, Bartsch G, Schaefer G, Struve P, Frauscher F. Prostate cancer diagnosis: value of real-time elastography. Abdominal Imaging. 2008a;33(6):729–35. doi: 10.1007/s00261-007-9345-7. [DOI] [PubMed] [Google Scholar]
- Pallwein L, Mitterberger M, Pinggera G, Aigner F, Pedross F, Gradl J, Pelzer A, Bartsch G, Frauscher F. Sonoelastography of prostate: Comparison with systematic biopsy findings in 492 patients. European Journal of Radiology. 2008b;65(5):304–10. doi: 10.1016/j.ejrad.2007.03.032. [DOI] [PubMed] [Google Scholar]
- Palmeri M. PhD thesis. Duke University; 2005. Imaging the mechanical properties of tissue with ultrasound: an investigation of the response of soft tissue to acoustic radiation force. [Google Scholar]
- Parker K, Huang S, Musulin R, Lerner R. Tissue response to mechanical vibrations for sonoelasticity imaging. Ultrasound Med Biol. 1990;16(3):241–6. doi: 10.1016/0301-5629(90)90003-u. [DOI] [PubMed] [Google Scholar]
- Phipps S. Prostate tissue stiffness as measured with a resonance sensor system: a study on silicone and human prostate tissue in vitro. Med Biol Eng Comput. 2006;44(7):593–603. doi: 10.1007/s11517-006-0069-6. [DOI] [PubMed] [Google Scholar]
- Salomon G, Kollerman J, Thederan I, Chun F, Budaus L, Schlomm T, Isbarn H, Heinzer H, Huland H, Graefen M. Evaluation of prostate cancer detection with ultrasound real-time elastography: A comparison with step section pathological analysis after radical prostatectomy. European Urology. 2008;54(6):1354–62. doi: 10.1016/j.eururo.2008.02.035. [DOI] [PubMed] [Google Scholar]
- Shinohara K, Scardino P, Carter S, Wheeler T. Pathologic basis of the sonographic appearance of the normal and malignant prostate. Urol Clin North Am. 1989;16(4):675–691. [PubMed] [Google Scholar]
- Souchon R, Hervieu V, Gelet A, Ophir J, Chapelon J. Human prostate elastography: in vivtro study. Proceedings of IEEE Ultrasonic Symposium. 2003 [Google Scholar]
- Stamey T, Freiha F, McNeal J, Redwine E, Whittemore A, Schmid H. Localized prostate cancer. relationship of tumor volume to clinical significance for treatment of prostate cancer. Cancer. 1993;71:933–8. doi: 10.1002/1097-0142(19930201)71:3+<933::aid-cncr2820711408>3.0.co;2-l. [DOI] [PubMed] [Google Scholar]
- Sumura M, Shigeno K, Hyuga T, Shiina H, Igawa M. Initial evaluation of prostate cancer with real-time elastography based on step-section pathologic analysis after radical prostatectomy: a preliminary study. Int J Urol. 2007;14:811–6. doi: 10.1111/j.1442-2042.2007.01829.x. [DOI] [PubMed] [Google Scholar]
- Taneja S. Prostate biopsy: Targeting cancer for detection and therapy. Rev Urol. 2006;8(4):173–182. [PMC free article] [PubMed] [Google Scholar]
- Tsutsumi M, Miyagawa T, Matsumura T, Kawazoe N, Ishikawa S, Shimokama T, Shiina T, Miyanaga N, Akaza H. The impact of real-time tissue elasticity imaging (elastography) on the detection of prostate cancer: clinicopathological analysis. The Japan Society of Clinical Oncology. 2007;12(4):250–5. doi: 10.1007/s10147-007-0669-7. [DOI] [PubMed] [Google Scholar]
- Zhang M, Nigwekar P, Castaneda B, Hoyt K, Joseph J, Agnese A, Messing E, Strang J, Rubens D, Parker K. Quantitative characterization of viscoelastic properties of human prostate correlated with histology. Ultrasound in Medicine and Biology. 2008;34(7):1033–42. doi: 10.1016/j.ultrasmedbio.2007.11.024. [DOI] [PubMed] [Google Scholar]
- Zhai L. Imaging and characterizing human prostates using acoustic radiation force. Duke University; 2009. [DOI] [PMC free article] [PubMed] [Google Scholar]


