

Abstract
Objective
The purpose of this review is to describe the principles of MRI cell tracking with superparamagnetic iron oxides and the four clinical trials that have been performed.
Conclusion
Clinical MRI cell tracking is likely to become an important tool at the bedside once (stem) cell therapy becomes mainstream. The most prominent role of this technique probably will be verification of accurate cell delivery with MRI-guided injection, in which interventional radiologists will play a role in the near future. All clinical studies described as of this writing have been performed outside the United States.
Keywords: cell tracking, immunotherapy, molecular imaging, stem cell therapy, superparamagnetic iron oxide
Molecular and cellular MRI has rapidly become a field of intense research effort. Although there is overlap, molecular MRI is aimed at specific visualization of molecular structures, most commonly proteins expressed on the cell surface that can be indicative of disease. Cellular MRI is aimed at visualization of the cell in its entirety, without differentiation of subcellular structures and molecules. Metallic MRI contrast agents are used in both techniques, but an experimental technique has been introduced that relies on endogenous bioorganic contrast enhancement [1].
Gadopentetate dimeglumine was the first MRI contrast agent approved by the U.S. Food and Drug Administration and is without question the most widely used compound. It is clinically safe because more than 99% of the dose is rapidly cleared and excreted along the renal pathway. It would therefore seem logical to use gadopentetate dimeglumine off label for clinical MRI cell tracking, but it has not for various reasons and will likely not be anytime soon.
The first reason for not labeling cells with gadopentetate dimeglumine is that doing so would result in long-term retention of gadopentetate dimeglumine in the body; the clearing mechanism is uncertain and may not be renal. Although the pH of blood plasma is nearly neutral, assuring sufficient stability of the chelate complex gadopentetate dimeglumine for its current clinical applications, the low pH in the lysosomes and endosomes of cells may lead to rapid dechelation once cells are labeled with paramagnetic agents. A potential toxicity concern about the existence of free Gd3+ ions does exist and has been further emphasized by the recognition of the occasional manifestation of nephrogenic systemic fibrosis [2], possibly as a result of contact between fibrocytes and the agent [3–7].
The second reason for not labeling cells with gadopentetate dimeglumine is that on the basis of the inherent physical principles of MR relaxation, intracellular gadopentetate dimeglumine has much reduced T1 relaxivity owing to differential water exchange and inner sphere relaxation. In addition, compartmentalization leads to local magnetic susceptibility effects that can produce ambiguous (e.g., positive vs negative) contrast enhancement, particularly at higher field strengths.
Superparamagnetic iron oxide (SPIO) particles are a different class of MRI contrast agent that endow the cells of interest with straightforward hypointense contrast enhancement after proper labeling [8]. One SPIO formulation, ferumoxides (Feridex, Bayer HealthCare), was approved by the U.S. Food and Drug Administration in 1996 and is sold in Europe under the name Endorem (Guerbet). It was originally developed as a liver contrast agent because it is taken up by Kupffer cells but did not live up to its promise and has been taken off the market because of lack of sales. Nevertheless, ferumoxides is the only pharmaceutical-grade MRI contrast agent that has been used for clinical cell tracking and is featured in this review.
Strategies for SPIO Labeling of Cells
Several strategies exist for SPIO labeling of cells. The easiest and safest method is spontaneous uptake of particles by phagocytic cells such as macrophages, microglia, and immature dendritic cells. This uptake usually depends more on the net surface charge than on the size of the particles. Both negatively charged (anionic) SPIO and positively charged SPIO can be taken up by nonphagocytic cells. Much smaller, neutral particles, such as monocrystalline iron oxide nanoparticles and ultrasmall superparamagnetic iron oxide, are designed for longer blood half-life applications, such as lymph node imaging, and are much less efficient than SPIO in being taken up by cells after simple incubation.
For nonphagocytic cells that do not spontaneously imbibe ferumoxides, several tricks can be used to ensure intracellular uptake and magnetic labeling. The most widely used strategy is use of cationic (positively charged) transfection agents to coat the anionic (negatively charged) ferumoxides particles through electrostatic interactions [9]. Transfection agents have been widely used to shuttle DNA molecules into cells, and this method has been adapted to do the same for ferumoxides. One transfection agent, protamine sulfate, exists as a clinical formulation [10], so both compounds can be used clinically off label. Depending on the relative ratio of transfection agent to ferumoxides, oligomers or precipitates form, and at the appropriate dilutions, macropinocytosis occurs (Fig. 1).
Fig. 1.
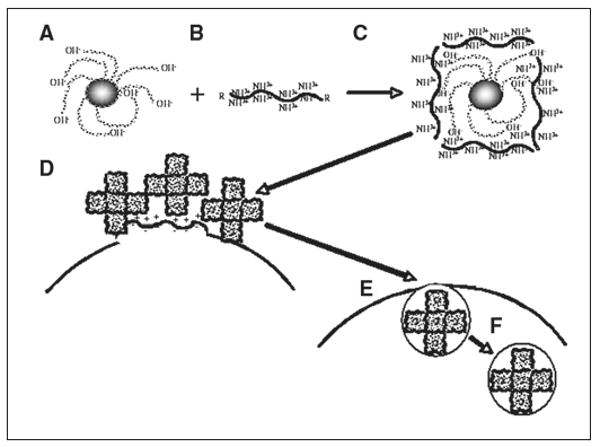
Schematic shows intracellular magnetic labeling with ferumoxides and polycationic transfection agent. Ferumoxides solution is supplied as formulation containing dextran as stabilizer (A). This bacterial polysaccharide has many terminal hydroxyl groups, which endow particles with negative surface charge (zeta potential, approximately −41 mV [54]). Commonly used (commercial) cationic transfection agents have zeta potential of +25 to +65 mV (B) and often contain multiple lysine or arginine residues and, as single agents, are known as cell-penetrating peptides. When mixed at correct concentration and incubated for approximately 60 minutes, A and B form complexes through electrostatic interactions, or van der Waals forces (C). Bond is not covalent but strong enough to hold two compounds together. Depending on ratio of ferumoxides to transfection agent, different sizes of oligomers form. Excess of either one results in formation of precipitable aggregates unsuitable for labeling. In this hypothetic example, oligomers consist of five individual ferumoxides particles, but there can be fewer or more. When added to cell cultures, ferumoxides–transfection agent complexes, which have net cationic charge due to outer coating of transfection agent, bind to anionic outer cell membrane (D), again as result of electrostatic interactions. As in macropinocytosis (big drinkers), membrane destabilization occurs through multiple membrane bends and invaginations (E). Membrane bending and cell-penetrating peptide properties of transfection agent ensure that ferumoxides complexes enter cells, eventually ending up in endosomes (F), which can fuse with secondary lysosomes.
Other methods of magnetic labeling have been described but are not widely used. One strategy, also translated from DNA transfection, is electroporation. The advantage is that electroporation is an instant method. Because the electrical pulses used enable temporary membrane permeability without an additional compound, off-label approval for use in transfection is not required [11, 12].
Is SPIO Labeling Safe?
Unlike gadolinium, iron is a naturally occurring metal present in the human body, at a dose of approximately 4 g in the average adult. Studies have shown that in Kupffer cells (professional macrophages or scavenger cells), ferumoxides is completely biodegraded in approximately 2–4 weeks, the iron being recycled into the normal blood pool, including hemoglobin [13]. The total dose that would be introduced into the human body in MRI cell tracking would be approximately 1 mg, or 0.025% of total body iron, calculated for a dose of 1 × 10⁸ cells and 10 pg Fe/cell. Because iron has been central to the emergence of life in terms of mitochondrial assimilation through reversible oxidation and reduction of Fe2+ and Fe3+, respectively, mammalian cells are well adapted to regulation of iron homeostasis. Thus the use of ferumoxides appears clinically safe. Many studies of potential cytotoxicity and cell function have shown no adverse effects at doses of approximately 10 pg Fe/cell. Results of a few studies indicate that for specific scenarios, caution still must be exercised. Although no effect on cell viability, growth, or downstream differentiation into other cells was found, for unknown reasons chondrogenesis was blocked when mesenchymal stem cells were induced into the chondrogenetic pathway after labeling with ferumoxides [14]. A second study showed immunomodulatory effects of SPIO on labeled macrophages that interact with T cells [15]. Finally, after ferumoxides labeling of glia-restricted precursor cells and intraspinal transplantation of these cells, marked macrophage–microglia influx was observed that was absent when cells were transplanted but not labeled with ferumoxides [16].
Toxicity studies have been focused on the effect of ferumoxides labeling on the labeled cell of interest. Few if any studies have been conducted to investigate the potentially toxic effects on host tissue. What effects do biodegraded iron or released free intact ferumoxides particles have on the surrounding host tissue? Which adjacent host cells are in first contact with the particles and at risk? Do the host cells take up these intact particles? If they do, how do the host cells cope with excess iron? Although this hypothesis is difficult to model and investigate in detail (live individual cells would have to be isolated from host tissue), the issue of taking up and coping with excess iron will eventually be of paramount importance for widespread safe clinical implementation of ferumoxides-based MRI cell tracking.
Proof-of-Concept Preclinical Studies
The first preclinical studies and the concept of MRI cell tracking were introduced in the early 1990s [17–19]. Several studies were conducted over the years, mostly on the use of SPIO-labeled immune cells in immunotherapy. It was not until the results of the first serial in vivo studies of cell migration were reported [20] and the use of transfection agents for efficient intracellular labeling was introduced [20–22] that the growth of MRI cell tracking exploded when results of preclinical studies showed proof of concept in many cell migration and homing scenarios [23, 24]. Because of the emergence of stem cell therapy and the need for high-resolution noninvasive tracking methods of clinical translation, MRI cell tracking became a robust method and entered the clinic.
Initial Clinical Studies
It is remarkable that the first four clinical studies of ferumoxides were performed outside the United States (two in Europe, one in Asia, and one in South America) [25–28]. In the first study [25], performed in The Netherlands, investigators examined the use of ferumoxides-labeled dendritic cells. The first injection into a patient was performed on April 26, 2004. The following specific aspects of the study facilitated fast approval by the local institutional review board to initiate the first clinical studies. First, a clinically approved contrast agent (ferumoxides) was used, albeit off label. Second, no secondary (transfection) agent was needed because immature dendritic cells are phagocytic by nature. Third, immature dendritic cells had always been isolated from peripheral blood mononuclear cells with Miltenyi superparamagnetic beads (Miltenyi Biotec) conjugated to specific antibodies for immunomagnetoisolation. Unlike in the United States, removal of these beads from the surface of the cell was not required. The dextran-coated beads are an excellent SPIO MRI contrast agent [29, 30] and resemble ferumoxides in many ways. Because clinical studies with these beads had already been performed, the argument was made that rather than SPIO beads on the outside of the cell, SPIO inside these cells would be studied. Fourth, studies of 111In-oxine radionuclide cell tracking [31] had been performed with the same dendritic cells and melanoma patient population. Fifth, the participants in the study were patients with advanced stage III melanoma, which has a poor prognosis and no other effective therapy. Sixth, the entire draining lymph node bed into which the ferumoxides-labeled cells were injected was resected after 2 weeks.
Two key findings were reported in that first study [25]. The first was that it is feasible with a routine clinical setup to detect ferumoxides-labeled cells not only in the injected lymph node but also in nearby lymph nodes to which they migrate (Fig. 2). This phenomenon occurred when cells containing approximately 30 pg Fe/cell [32] were used in 3-T MRI performed with conventional pulse sequences. With labeling with 111In-oxine in parallel, it was estimated that the sensitivity with the coil setup used at a resolution of 0.5 × 0.5 × 3.5 mm was approximately 15,000 cells [25]. It also became evident that because of its flexible 3D multiplanar nature, MRI was superior to radionuclide imaging with regard to accurate detection of the number of nodes that contained injected dendritic cells.
Fig. 2.
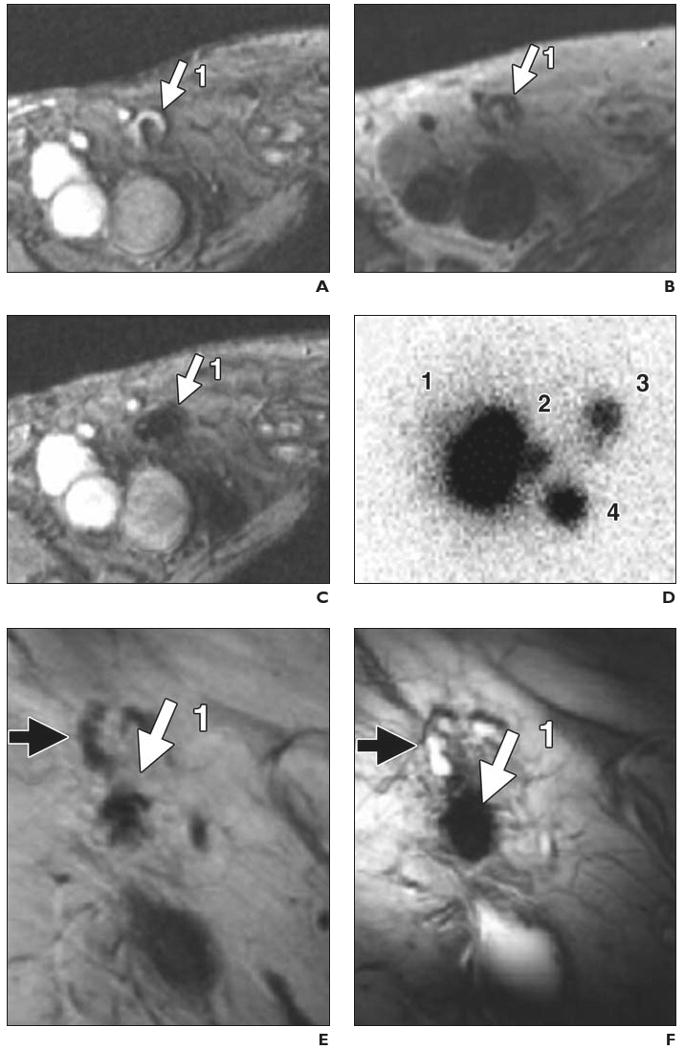
74-year-old man with stage III melanoma who had undergone intranodal injection of autologous dendritic cells primed with synthetic melanoma antigens and labeled with ferumoxides and 111In-oxine. In vivo migration of superparamagnetic iron oxide and 111In-labeled dendritic cells was monitored (D–N) with MRI and scintigraphy after injection into right inguinal lymph node. Overall, MRI had better accuracy for determining number and location of lymph nodes that contained injected or migrating labeled dendritic cells. (Reprinted with permission from [25])
A, Gradient-echo MR image before vaccination shows right inguinal lymph node (1, arrow) with area of high signal intensity.
B, Spin-echo MR image shows lymph node (1, arrow) after vaccination.
C, Gradient-echo MR image shows decreased signal intensity of lymph node (1, arrow) after vaccination.
D, Scintigram obtained 2 days after vaccination shows migration of dendritic cells from injection lymph node (1) to three nearby lymph nodes (2–4). Lymph node identified at scintigraphy as injection lymph node (1) was found at MRI to consist of two distinct lymph nodes (1 and 5, G–J).
E and F, Spin-echo (E) and gradient-echo (F) MR images show injection lymph node (1, solid arrow) 2 days after vaccination. Open arrow indicates lymph node that does not contain ferumoxides-labeled dendritic cells.
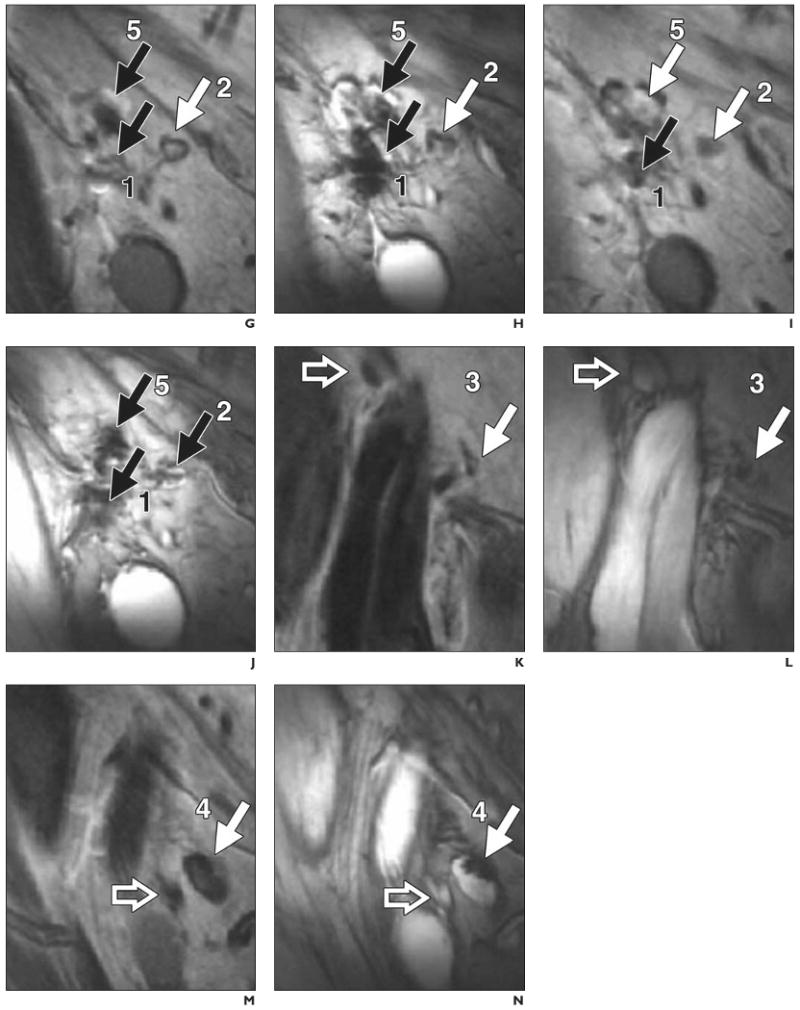
G–N, Paired spin-echo (G, I, K, and M) and gradient-echo (H, J, L, and N) MR images show migration of dendritic cells from injection lymph node (1) to four nearby lymph nodes (2–5, solid arrows). Open arrows (K–N) indicate lymph nodes that do not contain ferumoxides-labeled dendritic cells; black solid arrows, lymph nodes positive for ferumoxides-labeled cells that have lower signal intensity on gradient-echo than on spin-echo images.
The second finding was surprising. Cells had been accidentally misinjected in four of the eight patients who satisfied the end point criteria among the 10 patients enrolled in the study [25]. This poor injection rate for procedures performed by experienced radiologists was not known until the results of MRI cell tracking became available. On the radionuclide scans, only a cloud of radioactivity was visible in the area of the draining lymph node bed. When the radionuclide scans were cross-referenced with the MR images containing anatomic information, it became clear that the cells had been injected into either surrounding muscle or subcutaneous fat (Fig. 3). An important factor is that the cells were injected under ultrasound guidance. Compared with MRI, ultrasound imaging has poor resolution, and anatomic features sometimes are difficult to interpret. In the case of a particular lymph node, it is common that the tip of the injection catheter pushes the node into the fatty bed without puncture and that once the needle is in the node, it is relatively easy to puncture all the way through.
Fig. 3.
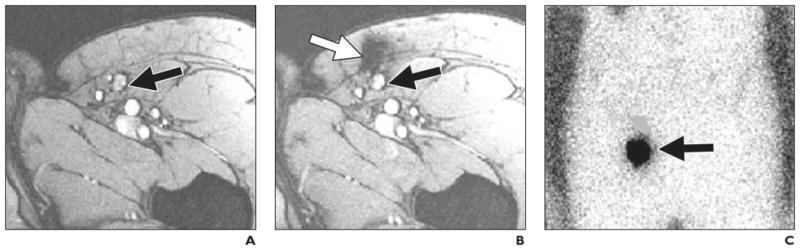
35-year-old woman with stage III melanoma. Accuracy of delivery of ferumoxides and 111In-oxine-labeled dendritic cells. (Adapted with permission from [25])
A, MR image obtained before vaccination shows inguinal lymph node (arrow) as target for injection.
B, MR image obtained after injection shows site of accidental misinjection of labeled dendritic cells into subcutaneous fat (white arrow). Black arrow indicates lymph node that was intended target.
C, Scintigraphic image, because of lack of anatomic information, does not show accurate injection (arrow).
In general, the clinical benefit of cancer vaccine therapy varies widely. Some patients respond well and some not at all, according to immunostimulatory outcome measures [33]. When cells are misinjected, there is no response because intrafollicular T cells must form rosettes with dendritic cells to become activated. The results of this first clinical MRI cell-tracking study are testimony to the absolute need for a noninvasive technique that can be used to assess the accuracy of cell injections and preferably to guide the injection itself in real time. MRI-guided cell injections conform to this requirement.
A different approach to monitoring the efficacy of cancer vaccine therapy is to label the tumor vaccine itself with ferumoxides rather than labeling the dendritic cells of interest. This approach, called magnetovaccination [34], can be used to obtain serial images of sentinel dendritic cells that have homed to draining lymph nodes and have activated T cells. The difference is that the MR images depict dendritic cells that have captured antigen, and are thus the specific immunostimulatory cells of interest, in the course of engulfing both the tumor antigens and the ferumoxides inside the irradiated dying tumor cells used as vaccine [34]. This process is illustrated in Figure 4. A gene-transduced autologous tumor vaccine (GVAX, Cell-Genesys) is a clinical investigational cancer vaccine developed at my institution [35]. In the spring of 2009, discussions began about initiating clinical trials of the vaccine with magnetovaccination.
Fig. 4.
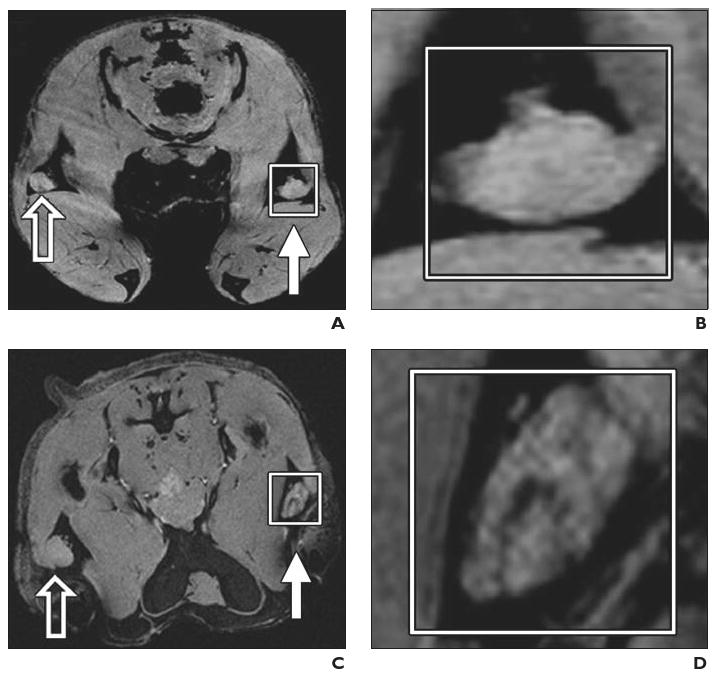
Experimental mouse model. Preclinical example of magnetovaccination for MRI tracking of injected dendritic cells. Dendritic cells were labeled in vivo (in situ) after phagocytosis of granulocyte–macrophage colony-stimulating factor (GM-CSF) tumor cell vaccine injected into footpad of mouse. Open arrows indicate draining popliteal lymph nodes from footpads with unlabeled GM-CSF vaccine; white arrows, draining popliteal lymph nodes from footpads with ferumoxides-labeled GM-CSF vaccine. (Reprinted with permission from [34])
A and B, Gradient-echo MR image (A) and magnification of inset (B) on day 1 show neither popliteal lymph node exhibits evidence of low signal intensity or dendritic cell homing to lymph nodes.
C and D, Gradient-echo MR image (C) and magnification of inset (D) on day 3 show decreased signal intensity in lymph nodes that corresponds to arrival of sentinel dendritic cells that have captured antigen from ferumoxides-labeled vaccine.
E and F, Gradient-echo MR image (E) and magnification of inset (F) show low signal intensity of lymph nodes persists on day 4.
G and H, Gradient-echo MR image (G) and magnification of inset (H) on day 8 show increase in signal intensity with dynamic anatomic change suggesting redistribution of dendritic cells from lymph node cortex to medulla.
The second clinical MRI study, performed in Shanghai, China, is a report of two patients with traumatic brain injury [26]. Autologous neural stem cells, isolated after removal of brain tissue during emergency surgery, were labeled with ferumoxides and a nonclinical-grade unapproved lipofection transfection agent (Effectene, Qiagen). Cells were stereotactically injected near the area of brain injury in one patient (Figs. 5A–5F), and gradient-echo MR images were obtained at 3 T. Over time, dynamic changes in the hypointensity were encountered that were attributed to movement of neural stem cells from the injection site to the border zone of the lesion. The signal intensity had disappeared completely 7 weeks after injection, possibly as a result of cell proliferation and dilution of ferumoxides toward undetectable levels. A control case of a patient with brain trauma who received unlabeled cells (Figs. 5G–5L) showed an absence of hypointense voids. This study clearly showed that it is feasible, at higher field strength, to detect magnetically labeled stem cells in the human brain.
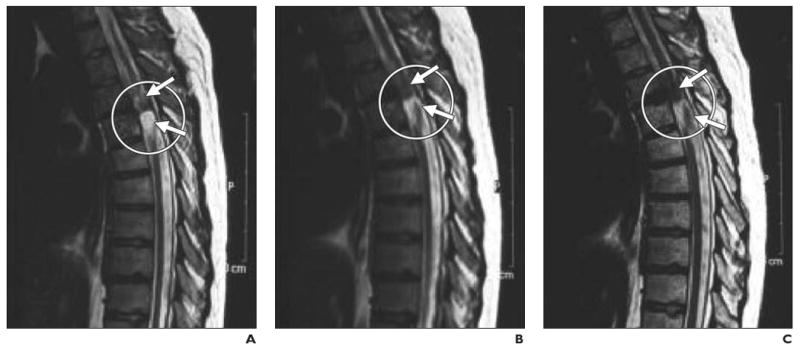
Fig. 5.
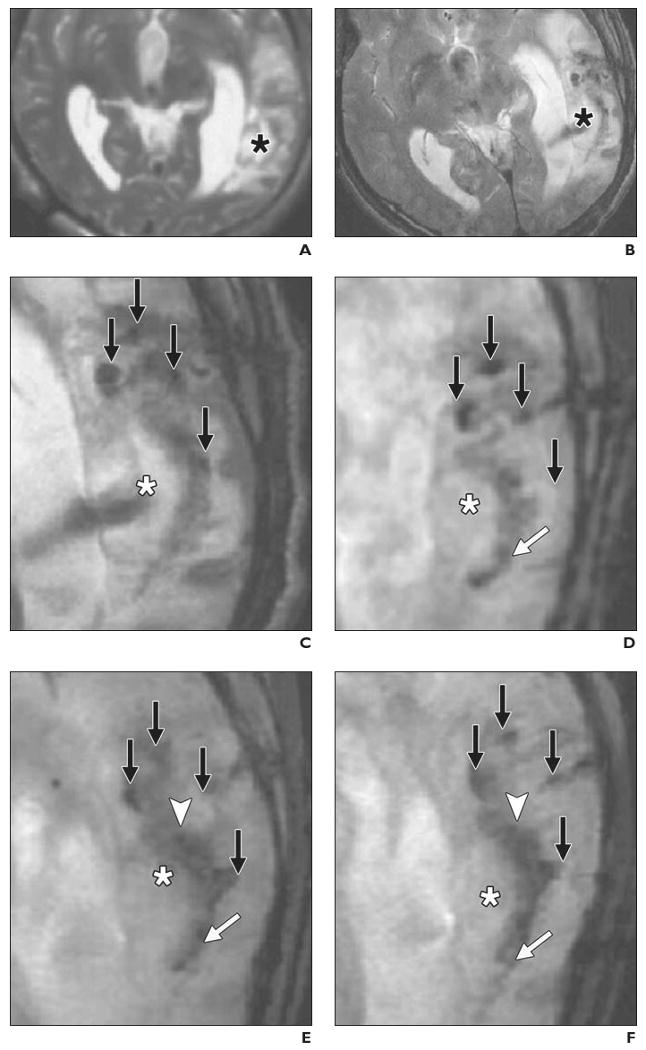
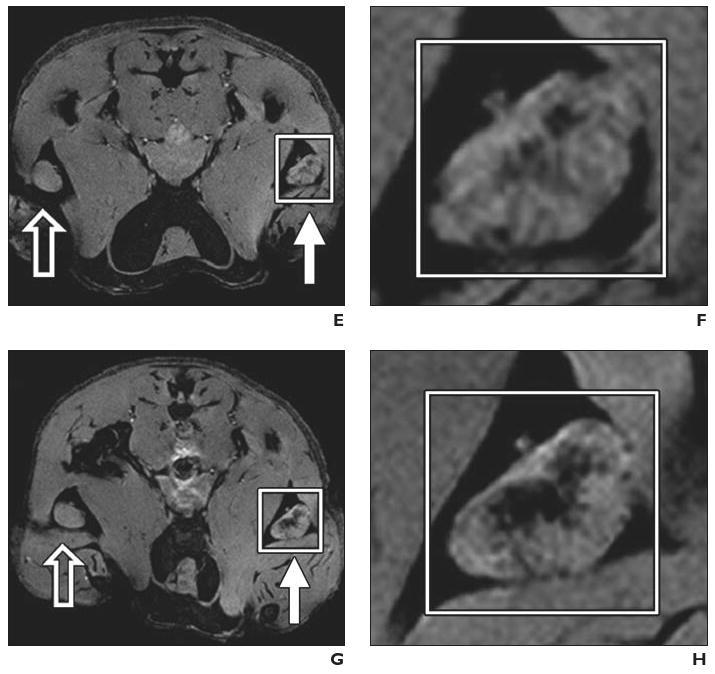
34-year-old man with traumatic brain injury (A–F) who received stereotactic injection of ferumoxides-labeled neural stem cells and 42-year-old man with traumatic brain injury (G–L) who received unlabeled autologous neural stem cells. MRI performed at 3 T. (Reprinted with permission from [26])
A, MR image obtained before injection of labeled cells shows absence of low signal intensity around lesion (asterisk) in left temporal lobe.
B, MR image obtained 1 day after implantation of stem cells shows circular areas of low signal intensity at injection sites. Asterisk indicates lesion.
C, Magnified MR image obtained 1 day after injection shows four areas of low signal intensity (arrows) at injection sites around lesion (asterisk).
D, Magnified MR image obtained 7 days after injection shows area of low signal intensity (white arrow) posterior to lesion, indicating presence of ferumoxides-labeled neural stem cells. Asterisk indicates lesion; black arrows, injection sites.
E, Magnified MR image obtained 14 days after injection shows fading of low signal intensity at injection sites (black arrows) and emergence of new area of low signal intensity (arrowhead) that spreads along border of injured brain tissue (asterisk). White arrow indicates area of low signal intensity that emerged on day 7.
F, Magnified MR image obtained 21 days after injection shows areas of low signal intensity have expanded and extend farther along lesion (white arrow). Asterisk indicates lesion; black arrows, injection sites; arrowhead, area of low signal intensity that emerged on day 14.
G, MR image shows findings before injection of unlabeled neural stem cells.
H, MR image shows findings 1 day after injection.
I–L, Magnified MR images obtained 1 (I), 7 (J), 14 (K), and 21 (L) days after injection show slightly hypointense areas around injection sites (arrows). Asterisk indicates lesion.
The third clinical study [27] was performed in São Paulo, Brazil, and stands out from the others in terms of the substance used as the MRI contrast agent: it was not designed as a contrast agent. The magnetic particles used to label CD34+ bone marrow stem cells were nonclinical, nonbiodegradable larger microspheres (Dynal Magnetic Beads, Invitrogen) developed solely for magnetic cell separation and bone marrow stem cell purging of tumor cells. Ten patients with chronic spinal cord injury received magnetic bead–labeled bone marrow stem cells, and six patients acting as controls received beads without cells. All injections were into the spinal cord by lumbar puncture.
Serial MR images were obtained at 1 T before and 20 and 35 days after injection (Fig. 6). As in the patient with traumatic brain injury in the study performed in China, migration of labeled cells toward the site of injury was observed over time, and the pattern was absent in the images of the patients who received injections of unlabeled beads. Although these results are significant in terms of ability to visualize cell migration noninvasively over time, there is considerable concern about patient safety with use of unapproved non-clinical-grade, nonbiodegradable contrast agents.
Fig. 6.
21-year-old man with chronic spinal cord injury. (Reprinted with permission from [27])
A–C, Serial MR images obtained before (A) and 20 (B) and 35 (C) days after injection of dynamagnetic bead–labeled CD34+ bone marrow stem cells show site of injury at T4–T5 level (circle). Hypointense areas (arrows) near site of injury expanded at later time points, presumably as result of targeted migration of bone marrow stem cells.
The fourth and last MRI clinical study [28] of cell tracking as of this writing was performed in Geneva, Switzerland. In that study, human cadaveric islet cells were labeled with ferucarbotran and transplanted intraportally according to the Edmonton protocol [36, 37]. T2*-weighted MRI was performed before and at various times after transplantation (Fig. 7). The viability and in vitro and in vivo functions of labeled islet cells were similar to those of control islet cells. All patients became insulin-independent after transplantation. The liver exhibited normal signal intensity on pre-transplantation images, and iron-loaded islet cells were identified after transplantation as hypointense spots within the liver. Many diabetic patients, however, experience spontaneous iron overload that interferes with detection of labeled islets (Fig. 7A).
Fig. 7.
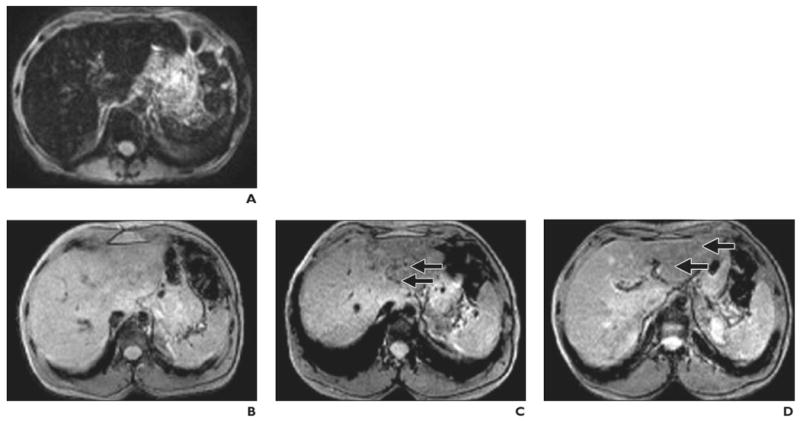
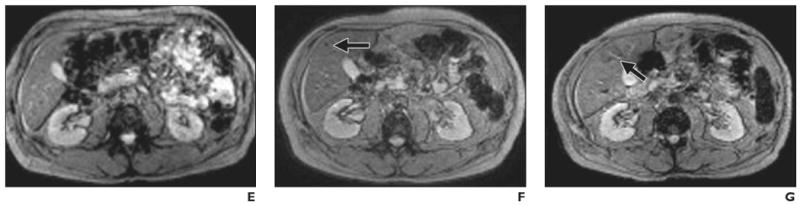
Findings before and after intraportal transplantation of ferucarbotran-labeled human cadaveric islet cells. (Reprinted with permission from [28])
A, 56-year-old woman with type 1 diabetes. MR image obtained before transplantation shows spontaneous iron overload, which is common in patients with type 1 diabetes and prevents visualization of hypointense islet cells.
B–D, 42-year-old man with type 1 diabetes. MR images show appearance before (B) and 5 days (C) and 6 weeks (D) after transplantation. Arrows indicate areas of low signal intensity induced by engrafted islets. Hepatic signal intensity is normal.
E–G, 62-year-old man with type 1 diabetes. MR images show appearance before (E) and 5 days (F) and 6 months (G) after transplantation. Arrows indicate areas of low signal intensity induced by engrafted islets. Hepatic signal intensity is normal.
In the study performed in Geneva [28], all patients who received ferucarbotran-labeled islet cells achieved insulin independence, confirming that SPIO labeling of islet cells appears to have no harmful effects on islet cell function. In that study, islet cell–induced spots continued to be identified 6 months after transplantation, but no correlation was found between the number of transplanted islets and the number of spots within the liver. The total number of hypointense spots was low in relation to the number of transplanted islet cells, even though 300,000–600,000 islet cells were transplanted. It was postulated that the sensitivity of detection may be too low for visualization of individual islet cells and that actual visible spots represented multiple islets grouped together. One way to increase sensitivity is to immunoprotect islet cells in semipermeable alginate capsules labeled with ferumoxides. These magnetocapsules, each containing a single islet cell and approximately 80 ng of iron, can be detected at the level of a single capsule [38].
Limitations
No technique is without limitations, and MRI cell tracking is no exception. The current approach of prelabeling of cells with SPIO has several limitations. First, it is not possible to discriminate live from dead cells. Once cells die, the SPIO particles remain in and around dead cells until cleared away, primarily by cells of the macrophage lineages. Occasional misinterpretation is possible. If macrophages or microglial cells phagocytize dying SPIO-labeled cells and actively move away from the site of cell implantation, these host macrophages can be mistaken for transplanted cells. Second, when cells divide rapidly after transplantation, the SPIO label quickly is divided among daughter cells to undetectable levels. The situation worsens in the case of stem cells that exhibit asymmetric cell division [39]. There can be a sharp boundary of MRI-visible and non-MRI-visible cells that are below the detection threshold.
The third limitation is that MRI cell tracking is difficult to perform in cases of traumatic injury in which hemorrhage is present. The endogenous blood derivatives, including methemoglobin, exhibit significant hypointensity, making detection of further SPIO-induced loss of signal intensity difficult. These cases include, but are not limited to, spinal cord (crush) injury, traumatic brain injury, stroke, and iron overload in the liver (Fig. 7A). The fourth limitation is that areas of SPIO-induced hypointensity sometimes are difficult to interpret because they obscure the normal anatomic features of underlying tissue. It is believed, but not yet proved, that alternative positive contrast imaging techniques, such as inversion recovery on-resonance, may be beneficial for MRI cell tracking [40, 41].
An MR reporter gene that can serve as a beacon of cell survival and produce an even signal from cells regardless of the number of divisions is currently the holy grail in molecular and cellular MRI research. As of yet, no robust MR reporter system, that is, a transfected gene product that has been widely used for cell tracking and independently verified by different laboratories, has been developed. A few prototype candidates exist, and there is much activity in the field [1, 42–44]. One important feature is that MR reporter genes be used to report on downstream lineage differentiation of stem cells when the actual reporter gene is placed under a promoter specific for the cell type of interest [45].
As of this writing and to the best of my knowledge, only one clinical study has been performed with a reporter gene. The resulting case report [46] described a glioma patient who received autologous cytotoxic T cells transfected with the PET reporter gene herpes simplex virus thymidine kinase [47].
Future Importance of Image-Guided Cell Injection
The accidental misinjections in four of eight patients in the first clinical MRI cell tracking study [25] have set a precedent for the absolute necessity for monitoring in real time the actual anatomic accuracy of cell depositions. MRI-compatible catheters have been developed [48, 49] that allow MRI-guided intramyocardial injection of stem cells [50–53] and intraportal injection of encapsulated pancreatic islet cells [38], ensuring that the person performing the procedure can feel confident about the outcome. An example is shown in Figure 8.
Fig. 8.
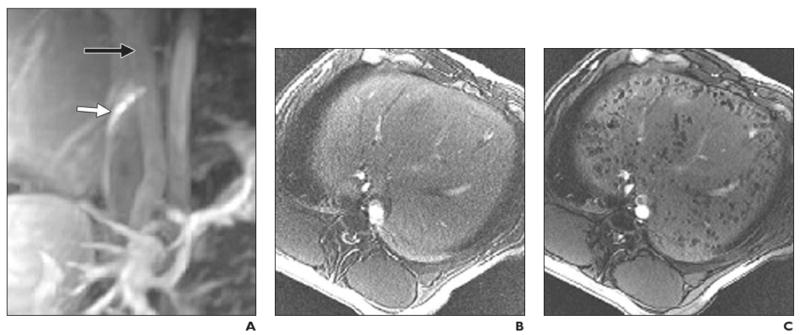
Intraportal injection of cellular therapeutic agent into healthy pig. MRI-guided transplantation of cadaveric human pancreatic islets encapsulated into ferumoxides-labeled semipermeable alginate capsules, or magnetocapsules. (Reprinted with permission from [38])
A, Conventional MR angiogram–venogram of mesenteric venous system obtained with 30 mL saline solution containing 0.1 mM gadopentetate dimeglumine before intraportal injection. Needle (white arrow) is in inferior vena cava with proper orientation for portacaval puncture. Black arrow indicates portal vein.
B and C, In vivo MR images obtained before (B) and 5 minutes after (C) intraportal infusion of magnetocapsules shows capsules as hypointense voids throughout liver.
Most cell injection procedures are performed with ultrasound imaging, and the poor anatomic interpretation together with the lower spatial resolution is far from optimal. MRI is likely to become the technique of choice for image-guided injections. In the medical device industry, there is a growing interest in developing MRI-compatible catheters specifically designed for cell therapeutic applications.
Summary
It is anticipated that MRI cell tracking will be an integral part of future clinical cell therapy, defining a new role and opportunity for interventional radiologists. One key aspect of successful cell therapy is accurate injection into the target tissue. Without precise injection, any therapy, no matter how sophisticated the approach, is guaranteed to fail. MRI-guided real-time cell injection with SPIO-labeled cells is the technique of choice for precise injection. However, because MRI does not yield information on cell survival and cell differentiation, follow-up imaging studies, whether PET or MRI, with reporter genes as beacons are needed. Reporter genes may be combined, producing a double or triple reporter gene, and use of the genes may be combined with SPIO labeling. Molecular imaging scientists and interventional radiologists must strive to make successful cell therapy, including stem cells, a clinical reality.
Acknowledgments
J. W. M. Bulte is supported by NMSS RG3630, the TEDCO Maryland Stem Cell Fund ESC 06-29-01, RO1 NS045062, RO1 EB007825, EUREKA RO1 DA02699, and Roadmap R21 EB005252. He is also a paid consultant for Surgivision LLC, a medical device company.
References
- 1.Gilad AA, McMahon MT, Walczak P, et al. Artificial reporter gene providing MRI contrast based on proton exchange. Nat Biotechnol. 2007;25:217–219. doi: 10.1038/nbt1277. [DOI] [PubMed] [Google Scholar]
- 2.Thomsen HS. Nephrogenic systemic fibrosis: a serious late adverse reaction to gadodiamide. Eur Radiol. 2006;16:2619–2621. doi: 10.1007/s00330-006-0495-8. [DOI] [PMC free article] [PubMed] [Google Scholar]
- 3.Cowper SE. Nephrogenic systemic fibrosis: a review and exploration of the role of gadolinium. Adv Dermatol. 2007;23:131–154. doi: 10.1016/j.yadr.2007.07.002. [DOI] [PubMed] [Google Scholar]
- 4.Morcos SK, Thomsen HS. Nephrogenic systemic fibrosis: more questions and some answers. Nephron Clin Pract. 2008;110:c24–c31. doi: 10.1159/000151228. [DOI] [PubMed] [Google Scholar]
- 5.Abraham JL, Thakral C. Tissue distribution and kinetics of gadolinium and nephrogenic systemic fibrosis. Eur J Radiol. 2008;66:200–207. doi: 10.1016/j.ejrad.2008.01.026. [DOI] [PubMed] [Google Scholar]
- 6.Edward M, Quinn JA, Mukherjee S, et al. Gadodiamide contrast agent “activates” fibroblasts: a possible cause of nephrogenic systemic fibrosis. J Pathol. 2008;214:584–593. doi: 10.1002/path.2311. [DOI] [PubMed] [Google Scholar]
- 7.Varani J, DaSilva M, Warner RL, et al. Effects of gadolinium-based magnetic resonance imaging contrast agents on human skin in organ culture and human skin fibroblasts. Invest Radiol. 2009;44:74–81. doi: 10.1097/RLI.0b013e31818f76b5. [DOI] [PubMed] [Google Scholar]
- 8.Bulte JW, Kraitchman DL. Iron oxide MR contrast agents for molecular and cellular imaging. NMR Biomed. 2004;17:484–499. doi: 10.1002/nbm.924. [DOI] [PubMed] [Google Scholar]
- 9.Frank JA, Miller BR, Arbab AS, et al. Clinically applicable labeling of mammalian and stem cells by combining superparamagnetic iron oxides and transfection agents. Radiology. 2003;228:480–487. doi: 10.1148/radiol.2281020638. [DOI] [PubMed] [Google Scholar]
- 10.Arbab AS, Yocum GT, Kalish H, et al. Efficient magnetic cell labeling with protamine sulfate complexed to ferumoxides for cellular MRI. Blood. 2004;104:1217–1223. doi: 10.1182/blood-2004-02-0655. [DOI] [PubMed] [Google Scholar]
- 11.Walczak P, Kedziorek DA, Gilad AA, Lin S, Bulte JW. Instant MR labeling of stem cells using magnetoelectroporation. Magn Reson Med. 2005;54:769–774. doi: 10.1002/mrm.20701. [DOI] [PubMed] [Google Scholar]
- 12.Gilad AA, Walczak P, McMahon MT, et al. MR tracking of transplanted cells with “positive contrast” using manganese oxide nanoparticles. Magn Reson Med. 2008;60:1–7. doi: 10.1002/mrm.21622. [DOI] [PMC free article] [PubMed] [Google Scholar]
- 13.Weissleder R, Stark DD, Engelstad BL, et al. Superparamagnetic iron oxide: pharmacokinetics and toxicity. AJR. 1989;152:167–173. doi: 10.2214/ajr.152.1.167. [DOI] [PubMed] [Google Scholar]
- 14.Kostura L, Kraitchman DL, Mackay AM, Pittenger MF, Bulte JW. Feridex labeling of mesen-chymal stem cells inhibits chondrogenesis but not adipogenesis or osteogenesis. NMR Biomed. 2004;17:513–517. doi: 10.1002/nbm.925. [DOI] [PubMed] [Google Scholar]
- 15.Siglienti I, Bendszus M, Kleinschnitz C, Stoll G. Cytokine profile of iron-laden macrophages: implications for cellular magnetic resonance imaging. J Neuroimmunol. 2006;173:166–173. doi: 10.1016/j.jneuroim.2005.11.011. [DOI] [PubMed] [Google Scholar]
- 16.Lepore AC, Walczak P, Rao MS, Fischer I, Bulte JW. MR imaging of lineage-restricted neural precursors following transplantation into the adult spinal cord. Exp Neurol. 2006;201:49–59. doi: 10.1016/j.expneurol.2006.03.032. [DOI] [PubMed] [Google Scholar]
- 17.Bulte JWM, Ma LD, Magin RL, et al. Selective MR imaging of labeled human peripheral blood mononuclear cells by liposome mediated incorporation of dextran-magnetite particles. Magn Reson Med. 1993;29:32–37. doi: 10.1002/mrm.1910290108. [DOI] [PubMed] [Google Scholar]
- 18.Hawrylak N, Ghosh P, Broadus J, Schlueter C, Greenough WT, Lauterbur PC. Nuclear magnetic resonance (NMR) imaging of iron oxide-labeled neural transplants. Exp Neurol. 1993;121:181–192. doi: 10.1006/exnr.1993.1085. [DOI] [PubMed] [Google Scholar]
- 19.Yeh TC, Zhang W, Ildstad ST, Ho C. Intracellular labeling of T-cells with superparamagnetic contrast agents. Magn Reson Med. 1993;30:617–625. doi: 10.1002/mrm.1910300513. [DOI] [PubMed] [Google Scholar]
- 20.Bulte JWM, Douglas T, Witwer B, et al. Magnetodendrimers allow endosomal magnetic labeling and in vivo tracking of stem cells. Nat Biotechnol. 2001;19:1141–1147. doi: 10.1038/nbt1201-1141. [DOI] [PubMed] [Google Scholar]
- 21.Hoehn M, Kustermann E, Blunk J, et al. Monitoring of implanted stem cell migration in vivo: a highly resolved in vivo magnetic resonance imaging investigation of experimental stroke in rat. Proc Natl Acad Sci USA. 2002;99:16267–16272. doi: 10.1073/pnas.242435499. [DOI] [PMC free article] [PubMed] [Google Scholar]
- 22.Frank JA, Zywicke H, Jordan EK, et al. Magnetic intracellular labeling of mammalian cells by combining (FDA-approved) superparamagnetic iron oxide MR contrast agents and commonly used transfection agents. Acad Radiol. 2002;9(suppl 2):S484–S487. doi: 10.1016/s1076-6332(03)80271-4. [DOI] [PubMed] [Google Scholar]
- 23.Long CM, Bulte JW. In vivo tracking of cellular therapeutics using magnetic resonance imaging. Expert Opin Biol Ther. 2009;9:293–306. doi: 10.1517/14712590802715723. [DOI] [PMC free article] [PubMed] [Google Scholar]
- 24.Muja N, Bulte JW. Magnetic resonance imaging of cells in experimental disease models. Prog Nucl Magn Res Spectrosc. 2009;55:61–77. doi: 10.1016/j.pnmrs.2008.11.002. [DOI] [PMC free article] [PubMed] [Google Scholar]
- 25.de Vries IJ, Lesterhuis WJ, Barentsz JO, et al. Magnetic resonance tracking of dendritic cells in melanoma patients for monitoring of cellular therapy. Nat Biotechnol. 2005;23:1407–1413. doi: 10.1038/nbt1154. [DOI] [PubMed] [Google Scholar]
- 26.Zhu J, Zhou L, XingWu F. Tracking neural stem cells in patients with brain trauma. N Engl J Med. 2006;355:2376–2378. doi: 10.1056/NEJMc055304. [DOI] [PubMed] [Google Scholar]
- 27.Callera F, de Melo CM. Magnetic resonance tracking of magnetically labeled autologous bone marrow CD34+ cells transplanted into the spinal cord via lumbar puncture technique in patients with chronic spinal cord injury: CD34+ cells' migration into the injured site. Stem Cells Dev. 2007;16:461–466. doi: 10.1089/scd.2007.0083. [DOI] [PubMed] [Google Scholar]
- 28.Toso C, Vallee JP, Morel P, et al. Clinical magnetic resonance imaging of pancreatic islet grafts after iron nanoparticle labeling. Am J Transplant. 2008;8:701–706. doi: 10.1111/j.1600-6143.2007.02120.x. [DOI] [PubMed] [Google Scholar]
- 29.Bulte JW, Hoekstra Y, Kamman RL, et al. Specific MR imaging of human lymphocytes by monoclonal antibody-guided dextran-magnetite particles. Magn Reson Med. 1992;25:148–157. doi: 10.1002/mrm.1910250115. [DOI] [PubMed] [Google Scholar]
- 30.Bulte JW, Vymazal J, Brooks RA, Pierpaoli C, Frank JA. Frequency dependence of MR relaxation times. Part II. Iron oxides. J Magn Reson Imaging. 1993;3:641–648. doi: 10.1002/jmri.1880030414. [DOI] [PubMed] [Google Scholar]
- 31.De Vries IJ, Krooshoop DJ, Scharenborg NM, et al. Effective migration of antigen-pulsed dendritic cells to lymph nodes in melanoma patients is determined by their maturation state. Cancer Res. 2003;63:12–17. [PubMed] [Google Scholar]
- 32.Verdijk P, Scheenen TW, Lesterhuis WJ, et al. Sensitivity of magnetic resonance imaging of dendritic cells for in vivo tracking of cellular cancer vaccines. Int J Cancer. 2007;120:978–984. doi: 10.1002/ijc.22385. [DOI] [PubMed] [Google Scholar]
- 33.Vieweg J, Dannull J. Technology insight: vaccine therapy for prostate cancer. Nat Clin Pract Urol. 2005;2:44–51. doi: 10.1038/ncpuro0079. [DOI] [PubMed] [Google Scholar]
- 34.Long CM, van Laarhoven HW, Bulte JW, Levitsky HI. Magnetovaccination as a novel method to assess and quantify dendritic cell tumor antigen capture and delivery to lymph nodes. Cancer Res. 2009;69:3180–3187. doi: 10.1158/0008-5472.CAN-08-3691. [DOI] [PMC free article] [PubMed] [Google Scholar]
- 35.Dranoff G, Jaffee E, Lazenby A, et al. Vaccination with irradiated tumor cells engineered to secrete murine granulocyte-macrophage colony-stimulating factor stimulates potent, specific, and long-lasting anti-tumor immunity. Proc Natl Acad Sci USA. 1993;90:3539–3543. doi: 10.1073/pnas.90.8.3539. [DOI] [PMC free article] [PubMed] [Google Scholar]
- 36.Shapiro AM, Lakey JR, Ryan EA, et al. Islet transplantation in seven patients with type 1 diabetes mellitus using a glucocorticoid-free immunosuppressive regimen. N Engl J Med. 2000;343:230–238. doi: 10.1056/NEJM200007273430401. [DOI] [PubMed] [Google Scholar]
- 37.Shapiro AM, Ricordi C, Hering BJ, et al. International trial of the Edmonton protocol for islet transplantation. N Engl J Med. 2006;355:1318–1330. doi: 10.1056/NEJMoa061267. [DOI] [PubMed] [Google Scholar]
- 38.Barnett BP, Arepally A, Karmarkar PV, et al. Magnetic resonance-guided, real-time targeted delivery and imaging of magnetocapsules immunoprotecting pancreatic islet cells. Nat Med. 2007;13:986–991. doi: 10.1038/nm1581. [DOI] [PubMed] [Google Scholar]
- 39.Walczak P, Kedziorek DA, Gilad AA, Barnett BP, Bulte JW. Applicability and limitations of MR tracking of neural stem cells with asymmetric cell division and rapid turnover: the case of the shiverer dysmyelinated mouse brain. Magn Reson Med. 2007;58:261–269. doi: 10.1002/mrm.21280. [DOI] [PubMed] [Google Scholar]
- 40.Cunningham CH, Arai T, Yang PC, McConnell MV, Pauly JM, Conolly SM. Positive contrast magnetic resonance imaging of cells labeled with magnetic nanoparticles. Magn Reson Med. 2005;53:999–1005. doi: 10.1002/mrm.20477. [DOI] [PubMed] [Google Scholar]
- 41.Stuber M, Gilson WD, Schar M, et al. Positive contrast visualization of iron oxide-labeled stem cells using inversion-recovery with ON-resonant water suppression (IRON) Magn Reson Med. 2007;58:1072–1077. doi: 10.1002/mrm.21399. [DOI] [PubMed] [Google Scholar]
- 42.Cohen B, Dafni H, Meir G, Harmelin A, Neeman M. Ferritin as an endogenous MRI reporter for noninvasive imaging of gene expression in C6 glioma tumors. Neoplasia. 2005;7:109–117. doi: 10.1593/neo.04436. [DOI] [PMC free article] [PubMed] [Google Scholar]
- 43.Genove G, DeMarco U, Xu H, Goins WF, Ahrens ET. A new transgene reporter for in vivo magnetic resonance imaging. Nat Med. 2005;11:450–454. doi: 10.1038/nm1208. [DOI] [PubMed] [Google Scholar]
- 44.Deans AE, Wadghiri YZ, Bernas LM, Yu X, Rutt BK, Turnbull DH. Cellular MRI contrast via co-expression of transferrin receptor and ferritin. Magn Reson Med. 2006;56:51–59. doi: 10.1002/mrm.20914. [DOI] [PMC free article] [PubMed] [Google Scholar]
- 45.Gilad AA, Winnard PT, Jr, van Zijl PC, Bulte JW. Developing MR reporter genes: promises and pitfalls. NMR Biomed. 2007;20:275–290. doi: 10.1002/nbm.1134. [DOI] [PubMed] [Google Scholar]
- 46.Yaghoubi SS, Jensen MC, Satyamurthy N, et al. Noninvasive detection of therapeutic cytolytic T cells with 18F-FHBG PET in a patient with glioma. Nat Clin Pract Oncol. 2009;6:53–58. doi: 10.1038/ncponc1278. [DOI] [PMC free article] [PubMed] [Google Scholar]
- 47.Tjuvajev JG, Stockhammer G, Desai R, et al. Imaging the expression of transfected genes in vivo. Cancer Res. 1995;55:6126–6132. [PubMed] [Google Scholar]
- 48.Lederman RJ, Guttman MA, Peters DC, et al. Catheter-based endomyocardial injection with real-time magnetic resonance imaging. Circulation. 2002;105:1282–1284. doi: 10.1161/01.CIR.0000012425.71261.FC. [DOI] [PMC free article] [PubMed] [Google Scholar]
- 49.Karmarkar PV, Kraitchman DL, Izbudak I, et al. MR-trackable intramyocardial injection catheter. Magn Reson Med. 2004;51:1163–1172. doi: 10.1002/mrm.20086. [DOI] [PubMed] [Google Scholar]
- 50.Kraitchman DL, Heldman AW, Atalar E, et al. In vivo magnetic resonance imaging of mesenchymal stem cells in myocardial infarction. Circulation. 2003;107:2290–2293. doi: 10.1161/01.CIR.0000070931.62772.4E. [DOI] [PubMed] [Google Scholar]
- 51.Dick AJ, Guttman MA, Raman VK, et al. Magnetic resonance fluoroscopy allows targeted delivery of mesenchymal stem cells to infarct borders in swine. Circulation. 2003;108:2899–2904. doi: 10.1161/01.CIR.0000095790.28368.F9. [DOI] [PMC free article] [PubMed] [Google Scholar]
- 52.Kraitchman DL, Gilson WD, Lorenz CH. Stem cell therapy: MRI guidance and monitoring. J Magn Reson Imaging. 2008;27:299–310. doi: 10.1002/jmri.21263. [DOI] [PMC free article] [PubMed] [Google Scholar]
- 53.Bulte JW, Kraitchman DL. Monitoring cell therapy using iron oxide MR contrast agents. Curr Pharm Biotechnol. 2004;5:567–584. doi: 10.2174/1389201043376526. [DOI] [PubMed] [Google Scholar]
- 54.Kalish H, Arbab AS, Miller BR, et al. Combination of transfection agents and magnetic resonance contrast agents for cellular imaging: relationship between relaxivities, electrostatic forces, and chemical composition. Magn Reson Med. 2003;50:275–282. doi: 10.1002/mrm.10556. [DOI] [PubMed] [Google Scholar]