

Abstract
Hospital-based studies suggest that hepatitis C virus (HCV) infection causes frequent cirrhosis, hepatocellular carcinoma, and mortality, but epidemiologic studies have shown less morbidity and mortality. The authors performed a retrospective cohort study of 10,259 recombinant immunoblot assay-confirmed, HCV antibody-positive (HCV+), allogeneic blood donors from 1991 to 2002 and 10,259 HCV antibody-negative (HCV−) donors matched for year of donation, age, gender, and Zone Improvement Plan Code (ZIP Code). Vital status through 2003 was obtained from the US National Death Index, and hazard ratios with 95% confidence intervals were calculated by survival analysis. After a mean follow-up of 7.7 years, there were 601 (2.92%) deaths: 453 HCV+ and 148 HCV− (hazard ratio (HR) = 3.13, 95% confidence interval (CI): 2.60, 3.76). Excess mortality in the HCV+ group was greatest in liver-related (HR = 45.99, 95% CI: 11.32, 186.74), drug- or alcohol-related (HR = 10.81, 95% CI: 4.68, 24.96), and trauma/suicide (HR = 2.99, 95% CI: 2.05, 4.36) causes. There was also an unexpected increase in cardiovascular mortality among the HCV+ donors (HR = 2.21, 95% CI: 1.41, 3.46). HCV infection is associated with a significant, threefold increase in overall mortality among former blood donors, including significantly increased mortality from liver and cardiovascular causes. High rates of mortality from drug/alcohol and trauma/suicide causes are likely due to lifestyle factors and may be at least partially preventable.
Keywords: atherosclerosis, blood donors, Hepacivirus, liver diseases, mortality
Hepatitis C virus (HCV) infects an estimated 4.1 million Americans and more than 170 million people worldwide (1). It is transmitted by blood transfusion (before US screening since 1991), injection drug use, and other parenteral exposures; there is little evidence for sexual transmission (2). At least 75 percent of infections are chronic as indicated by persistent detection of HCV RNA (3). Commonly cited statistics from clinic- and hospital-based natural history studies indicate that about 20 percent of infected persons will go on to develop cirrhosis or hepatocellular carcinoma over their lifetimes, suggesting a substantially increased mortality due to HCV infection (1, 3–5). However, these studies may have overestimated HCV-related mortality by enrolling patients who acquired the infection from transfusion, who may have died prematurely from preexisting conditions that necessitated transfusion (6, 7). Others followed patients in tertiary care centers where referral bias may inflate the rates of clinically apparent liver disease (8, 9).
In contrast, a more modest impact of HCV infection on health outcomes has been reported by other investigators. In one study by Seeff et al. (10), involving a 45-year follow-up of a cohort of military recruits who had serum drawn and stored between 1948 and 1955, the mortality rate among 17 confirmed HCV-infected subjects was 41 percent, not significantly different from the 26 percent observed among those who were HCV negative. Only two of seven deaths were due to liver disease. Kenny-Walsh and the Irish Hepatology Research Group (11) studied 376 living women who had positive tests for serum HCV RNA 17 years after injection with HCV-contaminated anti-D immune globulin (RhoGAM; Ortho-Clinical Diagnostics, Inc., Raritan, New Jersey). Results from this study showed only 2 percent of subjects with probable or definite cirrhosis and no cases of liver cancer.
Resolution of these conflicting findings is important for clinicians who must decide whether to observe or treat chronic HCV infection (12) and for those who guide public health policy. We therefore performed a retrospective cohort study of otherwise healthy blood donors screened for HCV antibodies at the time of blood donation.
MATERIALS AND METHODS
Study design and subjects
We used a retrospective cohort study design utilizing records of blood donor infectious disease test results and demographic data collected by 17 blood centers in the Blood Systems, Inc., network of blood banks in the western and southern United States, with annual blood collections comprising about 10 percent of the national total. Over the entire study period, persons with a lifetime history of injection drug use or clinical hepatitis were excluded from blood donation; those with a history of receiving a blood transfusion were not. First, we identified prevalent HCV antibody-positive (HCV+) whole blood donors with an index donation between 1991, when HCV screening of blood donors with second generation antibody assays was introduced, and December 31, 2002. HCV+ status was defined as repeatedly reactive HCV enzyme immunoassay and positive HCV recombinant immunoblot assay (RIBA) results on the index blood donation. We excluded about 1,000 enzyme immunoassay-positive donors with unavailable RIBA data from 1994 and 1995 due to testing at an outside laboratory from which historical data were unavailable. We also excluded donors with missing data on sex, year of birth, and home Zone Improvement Plan Code (ZIP Code), those with index donations other than whole blood (platelet apheresis, plasmapheresis, and autologous), and those who were co-infected with human immunodeficiency virus.
We formed a comparison group of HCV antibody-negative (HCV−) donors who were group-matched to the HCV+ donors in strata defined by year of donation, sex, year of birth, and five-digit ZIP Code of residence. We used ZIP Code as a surrogate for race/ethnicity, socioeconomic status, and other potential confounders because these data were available from only one of the blood banks in the network. First, we identified all potentially eligible HCV−, allogeneic donors who gave blood between the years of 1991 and 2002 and who had valid data on year of donation, sex, year of birth, and home five-digit ZIP Code. Then, we randomly allocated negative donors into strata, as defined above, in a 1:1 ratio to HCV+ donors in each stratum. In strata that remained unfilled, we extended the ZIP Code matching to include the five-digit ZIP Code (within the same three-digit ZIP Code group) that most closely resembled the US census racial distribution of the positive subjects' home ZIP Code. HCV+ subjects remaining in unfilled strata after this process were excluded. The study protocol was approved by the University of California San Francisco Committee on Human Research.
Mortality outcomes
To determine the number and causes of death in each group, we submitted the list of positive subjects and matched negative subjects (90 percent had Social Security numbers) to the US Public Health Service National Death Index in mid-2005. Our National Death Index search covered deaths occurring from January 1, 1991, through December 31, 2003, the last available death data at the time of our 2005 data submission. We used the National Death Index-recommended cutoff score for category 2 matches (those including Social Security numbers) to classify death index matches as true deaths (13, 14). For category 4 matches (those based upon name and other data but not Social Security number), we examined match data for all probabilistic scores above the National Death Index cutoff, eliminating deaths with implausible place or date of death in respect to their blood donation. Underlying causes of death were grouped into nine categories according to the International Classification of Diseases, Ninth Revision, Clinical Modification (ICD-9-CM), and Tenth Revision, Clinical Modification (ICD-10-CM), codes provided by the National Death Index (refer to Web appendix table 1). (This supplementary appendix table is posted on the Journal's website (http://aje/oupjournals.org/).)
Statistical analysis
The primary study endpoint was all-cause mortality, and secondary endpoints included death due to causes grouped into categories. The Kaplan-Meier method was used to generate survival curves, and the log-rank test was used to test for associations with HCV status. Survival of living subjects was censored at the end of follow-up, December 31, 2003. The Cox proportional hazards model was used to examine univariate and multivariate associations among survival, HCV status, and other selected variables on the basis of their univariate associations with death. Results were expressed as hazard ratios with 95 percent confidence intervals. Standardized mortality ratios were calculated separately for the HCV+ and HCV− groups utilizing age- and sex-specific year 2000 US population mortality rates (15). Analyses were performed with SAS, version 9.1, statistical software (SAS Institute, Inc., Cary, North Carolina) and STATA, version 9.2SE, statistical software (StataCorp LP, College Station, Texas).
RESULTS
Study population
We identified 11,304 HCV-confirmed seropositive subjects who donated between 1991 and 2002 and could be linked to identifying information in historical donation data sets. The number of HCV+ subjects per year declined over the study period, consistent with culling of positives from the donor population. We had fewer HCV+ subjects in 1994 and 1995 due to unavailable RIBA data. Of these donors, 1,045 were excluded from the final data set (619 autologous/duplicate donors or invalid ZIP codes, seven dually infected with human immunodeficiency virus and HCV, and 419 unable to be matched to appropriate controls). We successfully matched 10,259 HCV-seropositive subjects with 10,259 HCV-seronegative subjects, 78 percent with exact five-digit and 22 percent with nearby matches within the same three-digit ZIP Code. Consistent with the catchment areas of the participating blood centers, HCV-seropositive subjects and their corresponding seronegative subjects were drawn from a wide geographic area, representing 26 different states and 2,298 ZIP codes, primarily in the southern and western United States (figure 1). Demographic characteristics of the subjects are presented in table 1. Two thirds of subjects were male, and three quarters of subjects were between the ages of 30 and 49 years on the date of their donation. Among the 2,728 subjects at one blood center where reliable race/ethnicity data were available, there were small differences in race/ethnicity distribution between the HCV+ and HCV− groups, indicating that ZIP Code matching was an imperfect proxy for race/ethnicity. In this subgroup, Whites represented 35 percent of cases and 38 percent of controls, while non-White subjects represented 15 percent of cases and 12 percent of controls. We used year 2000 US Census Bureau data to derive median income and distributions of educational attainment for the subjects' home ZIP codes. Attributed median incomes were about $35,000 for both groups. Attributed educational attainment indicated that three quarters of subjects had completed high school and one fifth had at least a bachelor's degree. Slight differences in income and education between groups were due to nearby rather than exact five-digit ZIP Code matches.
FIGURE 1.

Hepatitis C virus-seropositive blood donors included in the cohort, by state of residence, United States, 1991–2003. Each dot represents one donor but does not reflect his/her location within the state. Two-letter abbreviations represent US Postal Service official state abbreviations.
TABLE 1.
Demographic characteristics of the study population, by hepatitis C virus status, United States, 1991–2003
| HCV+* (no.) |
HCV−* (no.) |
All subjects |
||
|---|---|---|---|---|
| No. | % | |||
| All subjects | 10,259 | 10,259 | 20,518 | |
| Sex | ||||
| Male | 6,627 | 6,627 | 13,254 | 65 |
| Female | 3,632 | 3,632 | 7,264 | 35 |
| Age group (years) | ||||
| <30 | 1,435 | 1,435 | 2,870 | 14 |
| 30–39 | 4,051 | 4,051 | 8,102 | 39 |
| 40–49 | 3,548 | 3,548 | 7,096 | 35 |
| 50–59 | 860 | 860 | 1,720 | 8 |
| >59 | 365 | 365 | 730 | 4 |
| Race/ethnicity† | ||||
| White | 960 | 1,029 | 1,989 | 73† |
| Black | 137 | 78 | 215 | 8† |
| Hispanic | 166 | 109 | 275 | 10† |
| Asian | 51 | 113 | 164 | 6† |
| Other/not available | 48 | 33 | 81 | 3† |
|
|
||||
| HCV+ |
HCV− |
All subjects |
||||
|---|---|---|---|---|---|---|
| Median ($) |
Mean (%) |
Median ($) |
Mean (%) |
Median ($) |
Mean (%) |
|
| Income in home ZIP Code*,‡ | 35,699 | 36,301 | 35,917 | |||
| Educational attainment in home ZIP Code‡ |
||||||
| High school or higher | 76.70 | 77.23 | 76.96 | |||
| Bachelor's degree or higher | 20.40 | 21.12 | 20.76 | |||
HCV+, hepatitis C virus antibody positive; HCV−, hepatitis C virus antibody negative; ZIP Code, Zone Improvement Plan Code.
Race/ethnicity data were available from only 1,362 HCV+ and 1,362 HCV− subjects at one blood center. They are included only to indicate the degree of race/ethnicity imbalance in the two groups that remained after ZIP Code matching.
Differences between the two groups were attributable to three-digit instead of five-digit ZIP Code matches in a minority of subjects.
Mortality outcomes
With a mean follow-up of 7.7 years since blood donation, we identified a total of 601 matches between our study population and deaths in the National Death Index. These included 550 “class 2” matches and, after eliminating 11 matches with death dates before donation dates (10 matches) and wrong birth date and phonetic match of last name (one match), 51 “class 4” matches. Of the 601 deaths (2.92 percent of enrolled subjects), 453 (4.41 percent) were among the 10,259 HCV+, and 148 (1.44 percent) were among the 10,259 HCV−. Overall mortality was significantly increased in the HCV+ group (log-rank p < 0.00001; figure 2). Univariate survival analysis yielded an unadjusted hazard ratio = 3.13 (95 percent confidence interval (CI): 2.60, 3.76). The average age of death was 50 years among the HCV+ and 48 years among the HCV− groups.
FIGURE 2.
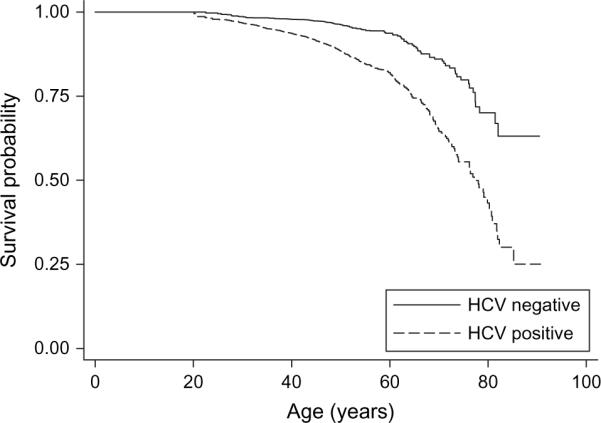
Age-specific survival by hepatitis C virus (HCV) status, all causes of death, United States, 1991–2003. Log-rank p < 0.0001 for lower survival in the hepatitis C virus-positive group.
Causes of death by category and HCV status, with unadjusted hazard ratios, are shown in table 2. Excess mortality in the HCV+ group was concentrated in deaths from liver-, drug/alcohol-, trauma/suicide-, and infection-related causes. Among the HCV+ subjects, there were 47 (0.5 percent of all HCV subjects) cases of “liver disease” (cirrhosis, variceal disease, and so on) and 16 cases (0.2 percent of all HCV subjects) of primary liver carcinoma. Based upon the observed deaths among 10,259 HCV+ subjects over 7.7 years, our data estimated the annual risk of death due to liver disease (including liver cancer) to be about 1 per 1,000 or, cumulatively, about 2 percent over 20 years of life following infection. Liver cancer accounted for about one fifth of these deaths, for a 0.4 percent cumulative risk over 20 years.
TABLE 2.
Cause of death by HCV* status, with hazard ratios and 95% confidence intervals for the association between mortality and HCV status, United States, 1991–2003
| Cause of death | HCV+* (no.) |
HCV−* (no.) |
Hazard ratio |
95% confidence interval |
|---|---|---|---|---|
| All liver deaths | 90 | 2 | 45.99 | 11.33, 186.74 |
| HCV | 14 | 0 | ∞ | |
| Other viral hepatitis | 13 | 0 | ∞ | |
| Liver disease | 47 | 1 | 50.92 | 7.03, 368.61 |
| Liver cancer | 16 | 1 | 16.64 | 2.21, 125.48 |
| Cancer (excluding liver) | 56 | 53 | 1.09 | 0.75, 1.58 |
| Cardiovascular | 60 | 28 | 2.21 | 1.41, 3.46 |
| Pulmonary | 8 | 7 | 1.18 | 0.43, 3.26 |
| Trauma/suicide | 106 | 36 | 2.99 | 2.05, 4.36 |
| Drugs/alcohol | 64 | 6 | 10.81 | 4.68, 24.96 |
| Stroke | 13 | 6 | 2.20 | 0.84, 5.79 |
| Infection | 23 | 2 | 11.73 | 2.77, 49.77 |
| Other/unknown | 33 | 8 | 4.23 | 1.95, 9.15 |
| All deaths | 453 | 148 | 3.13 | 2.60, 3.76 |
HCV, hepatitis C virus; HCV+, hepatitis C virus antibody positive; HCV−, hepatitis C virus antibody negative.
As seen in table 2 and figure 3, HCV was strongly associated with liver-related deaths (hazard ratio (HR) = 45.99, 95 percent CI: 11.32, 186.74), drug/alcohol-related deaths (HR = 10.81, 95 percent CI: 4.68, 24.96), and infectious deaths (HR = 11.73, 95 percent CI: 2.77, 49.77) and less strongly with trauma/suicide-related deaths (HR = 2.99, 95 percent CI: 2.05, 4.36) and cardiovascular deaths (HR = 2.21, 95 percent CI: 1.41, 3.46). There was no significant association with cancer deaths excluding liver cancer (figure 3, part D). Multivariate analyses did not significantly change the association between HCV and all-cause mortality. In a proportional hazards model including HCV status, age, sex, and median income of home ZIP Code, HCV (HR = 3.13), younger age (HR = 4.60 for ages 16–29 years and HR = 3.87 for ages 30–39 years, both vs. age over 60 years), sex (HR = 2.07 for males), and low-income ZIP Code (HR = 1.28 vs. high-income ZIP Code) were significantly associated with all-cause mortality. We found no evidence for interaction between age and gender. Because of concern regarding confounding by race/ethnicity, we constructed a separate multivariate model for the subset of 2,724 subjects from the San Francisco blood center with available race/ethnicity data. In this subset of the cohort, the effect of HCV status (HR = 2.00) was smaller than in the complete data set, but none of the other demographic variables including race/ethnicity was a significant predictor itself, nor did its addition change the HCV estimate.
FIGURE 3.

Age-specific survival by hepatitis C virus (HCV) status and cause-specific mortality: liver disease (including liver cancer) (A), cardiovascular causes (B), trauma and suicide (C), and cancer (excluding liver cancer) (D), United States, 1991–2003.
Because of the finding of associations between HCV status and trauma/suicide and drug/alcohol causes of death, we examined deaths according to age at blood donation and age at death. Although these causes of death were seen predominantly in younger subjects, there was no apparent difference in the interval between donation and death according to HCV status. We also examined deaths due to liver-related causes, and we saw no evidence that such deaths increased with a longer interval between blood donation and death. Finally, we calculated standardized mortality ratios to compare mortality rates in our HCV+ and HCV− groups with those of the US population. The standardized mortality ratio for the HCV+ group relative to the year 2000 US population mortality was 2.13 (95 percent CI: 1.81, 2.50), and the standardized mortality ratio for the HCV− group compared with the US population was 0.71 (95 percent CI: 0.58, 0.88).
DISCUSSION
Overall, our results indicate that HCV+ is associated with a significant, moderately increased risk of death in a prevalent cohort of blood donors who were presumably unaware of their HCV infection and in good apparent health at the time of their blood donation. Plausibly, the association between HCV and mortality was strongest for liver-related causes, but the absolute risk of liver death was still lower than that reported in hospital-based studies. However, deaths due to drug and alcohol abuse and trauma/suicide were also significantly associated with HCV+ and, together, accounted for more excess mortality than liver-related causes. We also noted an unexpected association between HCV and cardiovascular deaths, an intriguing finding in light of recent literature suggesting links between HCV and coronary or carotid artery atherosclerosis (16–19).
We were somewhat surprised to find an approximately threefold hazard ratio estimate for all-cause mortality. On the basis of the two studies described previously and several other prospective studies of HCV mortality in the literature, we had originally favored the null hypothesis that HCV would not be associated with mortality in an initially healthy blood donor population. Two other studies of transfusion recipients followed for 15–20 years failed to demonstrate any increased mortality in HCV-infected patients, including one with 924 HCV+ patients in the United Kingdom with a hazard ratio = 1.17 (95 percent CI: 0.92, 1.49) (20) and another with 222 HCV+ patients from several US cohorts (21). Studies of predominantly injection drug user populations have yielded consistent estimates of increased mortality ranging from 1.4 to 1.7, which failed to reach statistical significance (22, 23). A clinic-based study of 838 German patients with HCV infection, including 271 transfusion recipients and 134 injection drug users, was the one study to find a significant, albeit moderately increased all-cause mortality after more than 4 years of follow-up (standardized mortality ratio = 1.6, 95 percent CI: 1.3, 2.0) (24).
One possible explanation for our higher HCV hazard ratio than those of other epidemiologic studies is suggested by our calculation of standardized mortality ratios relative to the US population. Our comparison group of HCV− blood donors had only 70 percent of the population mortality after standardizing for age and sex, no doubt because of exclusion of unhealthy persons from blood donation. Our HCV+ subjects had a standardized mortality ratio of 2.13, indicating twofold increased mortality relative to the general population, instead of the threefold hazard ratio relative to our blood donor comparison group. In other words, it is possible that a “healthy blood donor” effect may have slightly inflated our mortality estimate. On the other hand, because our HCV+ subjects did pass blood donor medical selection criteria albeit with likely underreporting of HCV risk factors such as injection drug use, the general population may not be the appropriate comparison, so the “true” effect size may be between two and three.
On the other hand, our study found lower rates of liver-related mortality than did previous hospital- and clinic-based studies that may have been subject to selection bias (6–9). The annual incidence of liver-related death was only about 1/1,000, or 2 percent over 20 years, in the HCV+ group, with liver cancer accounting for one fifth of these deaths. At least 10–15 years of HCV infection may precede serious disease and death, but we do not expect a substantial increase in liver mortality with follow-up of the cohort beyond 7.7 years post donation. From our earlier studies of blood donors, we found that most were infected during the epidemic of injection drug use in the 1960s and 1970s (2, 25), so our subjects had probably been infected for 20–30 years at the time of their index blood donation. Also, our cohort included a broad range of ages at enrollment, and we saw no trend toward increasing liver deaths with a longer interval between donation and death.
How did our HCV+ blood donors compare with their counterparts in the general population? We suspect that about half of our HCV+ blood donors were probably exposed during past injection drug use and that the remainder were exposed via blood transfusion or other parenteral exposures (2, 26, 27). A survey of risky behavior among randomly selected blood donors found 0.5 percent lifetime injection drug use but only 0.04 percent injection drug use within the past 3 months (28). That we still saw large excesses of deaths due to drug and alcohol abuse in a cohort with more remote injection drug use speaks to the chronic and recurrent nature of these addictions. Our finding of a threefold higher mortality due to trauma and suicide among HCV+ subjects could also be related to current or past substance abuse, which is known to be associated with trauma and psychiatric disease (5, 29–31). These premature deaths probably accounted for the association of younger age at donation with mortality in our multivariate model. After controlling for age at donation, we saw no evidence that suicide deaths clustered around the time of donation, suggesting that notification of HCV infection was not responsible for this excess. Without person-specific data on treatment for HCV infection, we could not test the hypothesis that interferon treatment for HCV may have contributed to the excess in suicide deaths, although another study found this to be unlikely (23). Whatever the reason for the HCV association with deaths due to substance abuse, trauma, and suicide, some of these deaths may be preventable if primary care physicians address these issues in the counseling and treatment of HCV+ patients.
Our unanticipated finding of an association between HCV seropositivity and cardiovascular mortality may have at least two explanations and deserves additional research. First, there may have been potential confounding by unmeasured or inadequately controlled variables. We had incomplete racial data and did not have individual data for socioeconomic status, smoking, cholesterol, diet, or other risk factors among study subjects, which could have confounded our cardiovascular death association. Chronic cocaine injection has been linked to an increased risk of coronary artery calcification and could also confound our association with HCV (32). Second, there may be a causal link between HCV infection and coronary disease. Accelerated coronary stenosis has been reported among patients who received HCV-infected cardiac allografts (16, 17) and among HCV-infected kidney transplant recipients (33). Two other epidemiologic studies found associations between HCV and documented carotid artery (18) and coronary (19) atherosclerosis, while a third found positive associations with myocardial infection, stroke, and carotid atherosclerosis that were no longer significant after adjustment for age and other risk factors (34). There have also been negative studies: HCV antibody status was not associated with first myocardial infarction in active duty military men (35) nor was it among several chronic infections associated with the onset of carotid artery sclerosis (36). HCV infection is often accompanied by an inflammatory response including cryoglobulinemia and vasculitis (37, 38), which could affect the coronary arteries, and has also been associated with a metabolic syndrome consisting of insulin resistance and type 2 diabetes, which may in turn predispose patients to accelerated coronary disease (39).
The major strength of this study is that our data represent mortality in a relatively healthy population of blood donors among whom ongoing injection drug use is probably uncommon (28). We had access to excellent data on standardized HCV antibody testing, name, address, and Social Security number. Finally, we believe that our ascertainment of vital status was accurate and complete in most cases, since National Death Index matching has been found to be highly sensitive and specific (40).
There are several potential limitations of our study. First, our approach to controlling for confounding by race/ethnicity and socioeconomic status (i.e., matching by ZIP Code) is supported by other studies but is not a substitute for individual-level data (41, 42). Second, we could not analyze HCV viremia, because nucleic acid testing was done only on the fraction of donors enrolled since 1999. Third, high rates of competing mortality due to traumatic and substance abuse causes may have obscured some cases of liver disease that were present but unrecognized at death, or that would have developed if the HCV-infected deceased had lived longer. Conversely, unmeasured antiviral treatment or liver transplantation could have lowered liver disease mortality, especially in the later years of our study. Finally, our outcome data were derived from International Classification of Diseases-coded death certificate data reported to the National Death Index, and we did not have access to original death certificates or medical records of subjects to better determine pathologic diagnoses.
In conclusion, these data suggest that overall mortality is moderately increased among HCV+ individuals and that much of the increase is due to trauma/suicide and drug/alcohol deaths, underscoring the need for evaluation and treatment for drug and alcohol abuse, depression, and trauma/suicide risk in such patients. Future research should measure morbidity, disability, and medical care associated with HCV infection by surveying a sample of living cohort members. We also hope that other cohorts of HCV-seropositive individuals will be studied in an effort to replicate our findings, particularly the cardiovascular mortality association.
Supplementary Material
ACKNOWLEDGMENTS
Funding was provided by the Blood Systems Foundation and the National Heart, Lung, and Blood Institute (grants RO1-HL-076902 and K24-HL-75036).
Glossary
Abbreviations
- CI
confidence interval
- HCV
hepatitis C virus
- HCV−
HCV antibody negative
- HCV+
HCV antibody positive
- HR
hazard ratio
- RIBA
recombinant immunoblot assay
- ZIP Code
Zone Improvement Plan Code
Footnotes
Conflict of interest: none declared.
REFERENCES
- 1.Armstrong GL, Wasley A, Simard EP, et al. The prevalence of hepatitis C virus infection in the United States, 1999 through 2002. Ann Intern Med. 2006;144:705–14. doi: 10.7326/0003-4819-144-10-200605160-00004. [DOI] [PubMed] [Google Scholar]
- 2.Murphy EL, Bryzman SM, Glynn SA, et al. Risk factors for hepatitis C virus infection in United States blood donors. NHLBI Retrovirus Epidemiology Donor Study (REDS) Hepatology. 2000;31:756–62. doi: 10.1002/hep.510310329. [DOI] [PubMed] [Google Scholar]
- 3.Alter MJ, Margolis HS, Krawczynski K, et al. The natural history of community-acquired hepatitis C in the United States. The Sentinel Counties Chronic non-A, non-B Hepatitis Study Team. N Engl J Med. 1992;327:1899–905. doi: 10.1056/NEJM199212313272702. [DOI] [PubMed] [Google Scholar]
- 4.Alter HJ, Seeff LB. Recovery, persistence, and sequelae in hepatitis C virus infection: a perspective on long-term outcome. Semin Liver Dis. 2000;20:17–35. doi: 10.1055/s-2000-9505. [DOI] [PubMed] [Google Scholar]
- 5.Briggs ME, Baker C, Hall R, et al. Prevalence and risk factors for hepatitis C virus infection at an urban Veterans Administration medical center. Hepatology. 2001;34:1200–5. doi: 10.1053/jhep.2001.29303. [DOI] [PubMed] [Google Scholar]
- 6.Di Bisceglie AM, Goodman ZD, Ishak KG, et al. Long-term clinical and histopathological follow-up of chronic posttrans-fusion hepatitis. Hepatology. 1991;14:969–74. doi: 10.1016/0270-9139(91)90113-a. [DOI] [PubMed] [Google Scholar]
- 7.Koretz RL, Abbey H, Coleman E, et al. Non-A, non-B post-transfusion hepatitis. Looking back in the second decade. Ann Intern Med. 1993;119:110–15. doi: 10.7326/0003-4819-119-2-199307150-00003. [DOI] [PubMed] [Google Scholar]
- 8.Gordon SC, Elloway RS, Long JC, et al. The pathology of hepatitis C as a function of mode of transmission: blood transfusion vs. intravenous drug use. Hepatology. 1993;18:1338–43. [PubMed] [Google Scholar]
- 9.Tong MJ, el-Farra NS, Reikes AR, et al. Clinical outcomes after transfusion-associated hepatitis C. N Engl J Med. 1995;332:1463–6. doi: 10.1056/NEJM199506013322202. [DOI] [PubMed] [Google Scholar]
- 10.Seeff LB, Miller RN, Rabkin CS, et al. 45-year follow-up of hepatitis C virus infection in healthy young adults. Ann Intern Med. 2000;132:105–11. doi: 10.7326/0003-4819-132-2-200001180-00003. [DOI] [PubMed] [Google Scholar]
- 11.Kenny-Walsh E. Clinical outcomes after hepatitis C infection from contaminated anti-D immune globulin. Irish Hepatology Research Group. N Engl J Med. 1999;340:1228–33. doi: 10.1056/NEJM199904223401602. [DOI] [PubMed] [Google Scholar]
- 12.National Institutes of Health Consensus Development Conference Panel statement: management of hepatitis C. Hepatology. 1997;26(suppl):2S–10S. doi: 10.1002/hep.510260701. [DOI] [PubMed] [Google Scholar]
- 13.Fellgi I, Sunter A. A theory for record linkage. J Am Stat Assoc. 1969;64:1183–210. [Google Scholar]
- 14.Rogot E, Sorlie P, Johnson N. Probabilistic methods in matching census samples to the National Death Index. J Chronic Dis. 1986;39:719–34. doi: 10.1016/0021-9681(86)90155-4. [DOI] [PubMed] [Google Scholar]
- 15.National Center for Health Statistics . Death rates for 358 selected causes, by 10-year age groups, race, and sex: United States, 1999–2004. National Center for Health Statistics; Hyattsville, MD: 2005. GMWK12. ( www.cdc.gov/nchs/datawh/statab/unpubd/mortabs/gmwk12_10.htm) [Google Scholar]
- 16.Marelli D, Bresson J, Laks H, et al. Hepatitis C-positive donors in heart transplantation. Am J Transplant. 2002;2:443–7. doi: 10.1034/j.1600-6143.2002.20508.x. [DOI] [PubMed] [Google Scholar]
- 17.Haji SA, Starling RC, Avery RK, et al. Donor hepatitis-C seropositivity is an independent risk factor for the development of accelerated coronary vasculopathy and predicts outcome after cardiac transplantation. J Heart Lung Transplant. 2004;23:277–83. doi: 10.1016/S1053-2498(03)00148-7. [DOI] [PubMed] [Google Scholar]
- 18.Ishizaka N, Ishizaka Y, Takahashi E, et al. Association between hepatitis C virus seropositivity, carotid-artery plaque, and intima-media thickening. Lancet. 2002;359:133–5. doi: 10.1016/s0140-6736(02)07339-7. [DOI] [PubMed] [Google Scholar]
- 19.Vassalle C, Masini S, Bianchi F, et al. Evidence for association between hepatitis C virus seropositivity and coronary artery disease. Heart. 2004;90:565–6. doi: 10.1136/hrt.2003.018937. [DOI] [PMC free article] [PubMed] [Google Scholar]
- 20.Harris HE, Ramsay ME, Andrews NJ. Survival of a national cohort of hepatitis C virus infected patients, 16 years after exposure. Epidemiol Infect. 2006;134:472–7. doi: 10.1017/S0950268805005340. [DOI] [PMC free article] [PubMed] [Google Scholar]
- 21.Seeff LB, Hollinger FB, Alter HJ, et al. Long-term mortality and morbidity of transfusion-associated non-A, non-B, and type C hepatitis: a National Heart, Lung, and Blood Institute collaborative study. Hepatology. 2001;33:455–63. doi: 10.1053/jhep.2001.21905. [DOI] [PubMed] [Google Scholar]
- 22.Lumbreras B, Jarrin I, del Amo J, et al. Impact of hepatitis C infection on long-term mortality of injecting drug users from 1990 to 2002: differences before and after HAART. AIDS. 2006;20:111–16. doi: 10.1097/01.aids.0000196164.71388.3b. [DOI] [PubMed] [Google Scholar]
- 23.Rodger AJ, Roberts S, Lanigan A, et al. Assessment of long-term outcomes of community-acquired hepatitis C infection in a cohort with sera stored from 1971 to 1975. Hepatology. 2000;32:582–7. doi: 10.1053/jhep.2000.9714. [DOI] [PubMed] [Google Scholar]
- 24.Niederau C, Lange S, Heintges T, et al. Prognosis of chronic hepatitis C: results of a large, prospective cohort study. Hepatology. 1998;28:1687–95. doi: 10.1002/hep.510280632. [DOI] [PubMed] [Google Scholar]
- 25.Murphy EL, Bryzman S, Williams AE, et al. Demographic determinants of hepatitis C virus seroprevalence among blood donors. JAMA. 1996;275:995–1000. [PubMed] [Google Scholar]
- 26.Delage G, Infante-Rivard C, Chiavetta JA, et al. Risk factors for acquisition of hepatitis C virus infection in blood donors: results of a case-control study. Gastroenterology. 1999;116:893–9. doi: 10.1016/s0016-5085(99)70072-7. [DOI] [PubMed] [Google Scholar]
- 27.Brandao AB, Fuchs SC. Risk factors for hepatitis C virus infection among blood donors in southern Brazil: a case-control study. (e-publication) BMC Gastroenterol. 2002;2:18. doi: 10.1186/1471-230X-2-18. [DOI] [PMC free article] [PubMed] [Google Scholar]
- 28.Williams AE, Thomson RA, Schreiber GB, et al. Estimates of infectious disease risk factors in US blood donors. Retrovirus Epidemiology Donor Study. JAMA. 1997;277:967–72. [PubMed] [Google Scholar]
- 29.el-Serag HB, Kunik M, Richardson P, et al. Psychiatric disorders among veterans with hepatitis C infection. Gastroenterology. 2002;123:476–82. doi: 10.1053/gast.2002.34750. [DOI] [PubMed] [Google Scholar]
- 30.Schoener EP, Hopper JA, Pierre JD. Injection drug use in North America. Infect Dis Clin North Am. 2002;16:535–51. vii. doi: 10.1016/s0891-5520(02)00010-7. [DOI] [PubMed] [Google Scholar]
- 31.Nguyen HA, Miller AI, Dieperink E, et al. Spectrum of disease in U.S. veteran patients with hepatitis C. Am J Gastroenterol. 2002;97:1813–20. doi: 10.1111/j.1572-0241.2002.05800.x. [DOI] [PubMed] [Google Scholar]
- 32.Lai S, Lai H, Meng Q, et al. Effect of cocaine use on coronary calcium among black adults in Baltimore, Maryland. Am J Cardiol. 2002;90:326–8. doi: 10.1016/s0002-9149(02)02475-x. [DOI] [PubMed] [Google Scholar]
- 33.Younossi ZM, Braun WE, Protiva DA, et al. Chronic viral hepatitis in renal transplant recipients with allografts functioning for more than 20 years. Transplantation. 1999;67:272–5. doi: 10.1097/00007890-199901270-00015. [DOI] [PubMed] [Google Scholar]
- 34.Volzke H, Schwahn C, Wolff B, et al. Hepatitis B and C virus infection and the risk of atherosclerosis in a general population. Atherosclerosis. 2004;174:99–103. doi: 10.1016/j.atherosclerosis.2004.01.010. [DOI] [PubMed] [Google Scholar]
- 35.Arcari CM, Nelson KE, Netski DM, et al. No association between hepatitis C virus seropositivity and acute myocardial infarction. Clin Infect Dis. 2006;43:e53–6. doi: 10.1086/507031. [DOI] [PubMed] [Google Scholar]
- 36.Kiechl S, Egger G, Mayr M, et al. Chronic infections and the risk of carotid atherosclerosis: prospective results from a large population study. Circulation. 2001;103:1064–70. doi: 10.1161/01.cir.103.8.1064. [DOI] [PubMed] [Google Scholar]
- 37.Sansonno D, Dammacco F. Hepatitis C virus, cryoglobulinaemia, and vasculitis: immune complex relations. Lancet Infect Dis. 2005;5:227–36. doi: 10.1016/S1473-3099(05)70053-0. [DOI] [PubMed] [Google Scholar]
- 38.Mayo MJ. Extrahepatic manifestations of hepatitis C infection. Am J Med Sci. 2003;325:135–48. doi: 10.1097/00000441-200303000-00006. [DOI] [PubMed] [Google Scholar]
- 39.Koike K. Steatosis in chronic hepatitis C: fuel for overproduction of oxidative stress? J Gastroenterol. 2005;40:664–5. doi: 10.1007/s00535-005-1626-8. [DOI] [PubMed] [Google Scholar]
- 40.Cowper DC, Kubal JD, Maynard C, et al. A primer and comparative review of major US mortality databases. Ann Epidemiol. 2002;12:462–8. doi: 10.1016/s1047-2797(01)00285-x. [DOI] [PubMed] [Google Scholar]
- 41.Cantwell MF, McKenna MT, McCray E, et al. Tuberculosis and race/ethnicity in the United States: impact of socioeconomic status. Am J Respir Crit Care Med. 1998;157:1016–20. doi: 10.1164/ajrccm.157.4.9704036. [DOI] [PubMed] [Google Scholar]
- 42.Fiscella K, Franks P. Impact of patient socioeconomic status on physician profiles: a comparison of census-derived and individual measures. Med Care. 2001;39:8–14. doi: 10.1097/00005650-200101000-00003. [DOI] [PubMed] [Google Scholar]
Associated Data
This section collects any data citations, data availability statements, or supplementary materials included in this article.