Abstract
Voxel-based prescriptions of deliberately non-uniform dose distributions based on molecular imaging, so-called dose painting or theragnostic radiation therapy, require specification of a transformation that maps the image data intensities to prescribed doses. However, the functional form of this transformation is currently unknown. An investigation into the sensitivity of optimized dose distributions resulting from several possible prescription functions was conducted. Transformations between the radiotracer activity concentrations from Cu-ATSM PET images, as a surrogate of tumour hypoxia, and dose prescriptions were implemented to yield weighted distributions of prescribed dose boosts in high uptake regions. Dose escalation was constrained to reflect clinically realistic whole tumour doses and constant normal tissue doses. Optimized heterogeneous dose distributions were found by minimizing a voxel-by-voxel quadratic objective function in which all tumour voxels were given equal weight. Prescriptions based on a polynomial mapping function were found to be least constraining on their optimized plans, while prescriptions based on a sigmoid mapping function were the most demanding to deliver. A prescription formalism that fixed integral dose was less sensitive to errors in the choice of mapping function than one that boosted integral dose. Integral doses to normal tissue and critical structures were insensitive to the shape of the prescription function. Planned target dose conformity improved with smaller beamlet dimensions until the inherent spatial resolution of the functional image was matched. Clinical implementation of dose painting rests on advances in absolute quantification of functional images and improvements in delivery techniques over smaller spatial scales.
Keywords: IMRT, helical tomotherapy, dose painting, Cu-ATSM, hypoxia, theragnostic radiation therapy
1. Introduction
Tumours are phenotypically heterogeneous in general, exhibiting an array of expressed characteristics that are rooted both in their origin and environment (Foulds 1954). Solid tumour phenotypes include but are not limited to elevated rates of cellular proliferation, regions of hypoxia as well as necrosis, and increased neovascular density (Veikkola and Alitalo 1999, Hanahan and Weinberg 2000). The plethora of combinations arising from these characteristics leads to a high degree of heterogeneity both between and within individual tumours.
Homogeneous local control of such heterogeneous tumours via treatment from x-ray radiation should be maximized by prescribing and delivering physical dose in a manner that accounts for intratumoural variation in radiosensitivity (Brahme and Ågren 1987, Levin-Plotnik and Hamilton 2004). Physical delivery of this non-uniform dose has become feasible with the advent of intensity-modulated radiation therapy (IMRT), which offers improved target conformity via the dynamic modulation of spatial and temporal beam intensity profiles (Källman et al 1988, Convery and Rosenbloom 1995, Yu et al 1995, Brahme 2000). Clinical studies of various disease sites have concluded that IMRT is capable of delivering higher target doses than 3D-conformal therapy for fixed critical tissue integral dose (Portelance et al 2001, Zelefsky et al 2002). Similarly, it has been shown that non-uniform dose distributions can be delivered to biological target volumes using IMRT with little theoretical increase in normal tissue complications relative to conventional, uniform dose distributions (Brahme et al 2001, Xing et al 2002, Yang and Xing 2005, Søvik et al 2007b).
Practical implementation of deliberately prescribing non-uniform dose, termed dose painting or theragnostic radiation therapy, hinges on the establishment of a mathematical link between a given phenotypic level of expression and the dose prescription that optimizes complication-free tumour control (Ling et al 2000, Bentzen 2005). Expression can be quantified and localized using molecular markers through in vivo assays, which include highly specific imaging modalities such as positron emission tomography (PET) (Apisarnthanarax and Chao 2005). However, the function that maps quantitative biological information to an optimized dose prescription remains unknown, due in principle to its poorly understood shape for each of many observable phenotypes. In the absence of direct evidence on its explicit functional dependence, studies have assumed the relative prescribed doses to depend linearly on image intensities (Alber et al 2003, Das et al 2004, Vanderstraeten et al 2006). Others have modified conventional radiobiological models (Stewart and Li 2007), most notably the linear quadratic model of cell survival, to include radiosensitivity parameters which are functionally dependent on phenotypic expression to optimize tumour control probability (Søvik et al 2007a, Thorwarth et al 2007).
The biologically-based optimization utilized in this work minimizes a function with physical objectives, in which the prescribed dose is functionally dependent on the unique uptake distribution of a given PET radiotracer across all tumour voxels in the patient. Hypoxia imaging with [61Cu]Cu-ATSM radiotracer is arbitrarily chosen as one of several possible inputs on which a prescription function acts. The PET radiotracer Cu(II)-diacetyl-bis-N4-methyliosemicarbazone (Cu-ATSM) has been shown to be a surrogate for cellular hypoxia, due to its high lipophilicity which allows rapid uptake in cell mitochondria, as well as its low redox potential which permits selective retention in hypoxic cells (Fujibayashi et al 1997, Lewis et al 2001, Obata et al 2001). Negative correlation between tracer retention and local oxygen tension (Chao et al 2001), coupled with clinical studies of local pO2 distributions correlated to outcome in head and neck cancers (Nordsmark et al 1996, Nordsmark et al 2005), have led to investigations on the relationship between Cu-ATSM retention and poor clinical outcome (Dehdashti et al 2003a, Dehdashti et al 2003b, Dehdashti et al 2008). Other potential PET radiotracer inputs include the glucose metabolism surrogate fluorodeoxyglugose ([18F]FDG), cellular proliferation surrogate fluorothymidine ([18F]FLT), and hypoxia surrogate fluoromisonidazole ([18F]FMISO) uptake distributions. In principle, each tracer could have an associated prescription function that is either completely unique or merely a superposition of underlying biological functions.
The aim of the present study is not to ascertain the exact shape of such a biologically-based prescription function for a given tracer uptake, but instead to investigate the sensitivity of IMRT planned dose conformity to variations in its functional shape. A simple set of transformations serve to parameterize the prescription function in a manner that facilitates physical and biological interpretation. The sensitivity to these parameters is measured by variations in the planned dose conformity to each target prescription, as well as by the integral dose to normal tissues and proximal critical structures. The spatial resolution with which dose can be painted is altered to determine practical limits for prospective clinical implementation.
2. Materials and methods
2.1. Patients
Three head and neck squamous cell carcinoma (HNSCC) patients with non-uniform [61Cu]Cu-ATSM uptake distributions were used in the study. Detailed analysis is shown for the most complex HNSCC patient that included a base of tongue primary and regional lymph node involvement. Results along with discussion of the remaining sample set are reported. In all cases, the left and right parotids, larynx, oral cavity, and spinal cord were treated as organs at risk (OARs). Computed tomography (CT) voxels were downsampled from the native spatial resolution of 0.098 cm to match the PET voxel size of 0.391 cm in the transverse plane and longitudinal axis. The fusion of imaging modalities compelled either the interpolation of PET voxels by upsampling to the CT grid dimensions, or vice-versa. The ramifications of each choice are discussed in conjunction with the dose painting spatial resolution results of section 3.5.
2.2. Biologically-based prescription
The prescribed dose to voxel i (i=1,…,N) in the PTV was set to 70 Gy plus a hypoxia surrogate uptake (hi) dependent boost dose. The hi-dependence was assigned the form of either an nth-order polynomial function or a sigmoid function, in order to distinguish between continuous and threshold functional dependence. Sigmoid curves have been used previously as dose-response functions (Brahme and Lind 1999) that attempt to capture the biological and clinical effects of local dose deposition as stochastic and deterministic in nature, depending on the magnitude of the physical dose delivered.
Two methods were developed to specify the polynomial- and sigmoid-based boost prescriptions. For the first method, a constant integral boost dose of VPTVΔDmean was prescribed, where VPTV was the PTV volume, for all polynomial and sigmoid parameters. These cases will be referred to as the and cases, for the polynomial and sigmoid boosts, respectively. For the second method, the maximum boost dose in the PTV was set to ΔDmax. These cases will be referred to as the and cases, for the polynomial and sigmoid boosts, respectively. The functional forms of all of the prescription cases are the following:
| (1) |
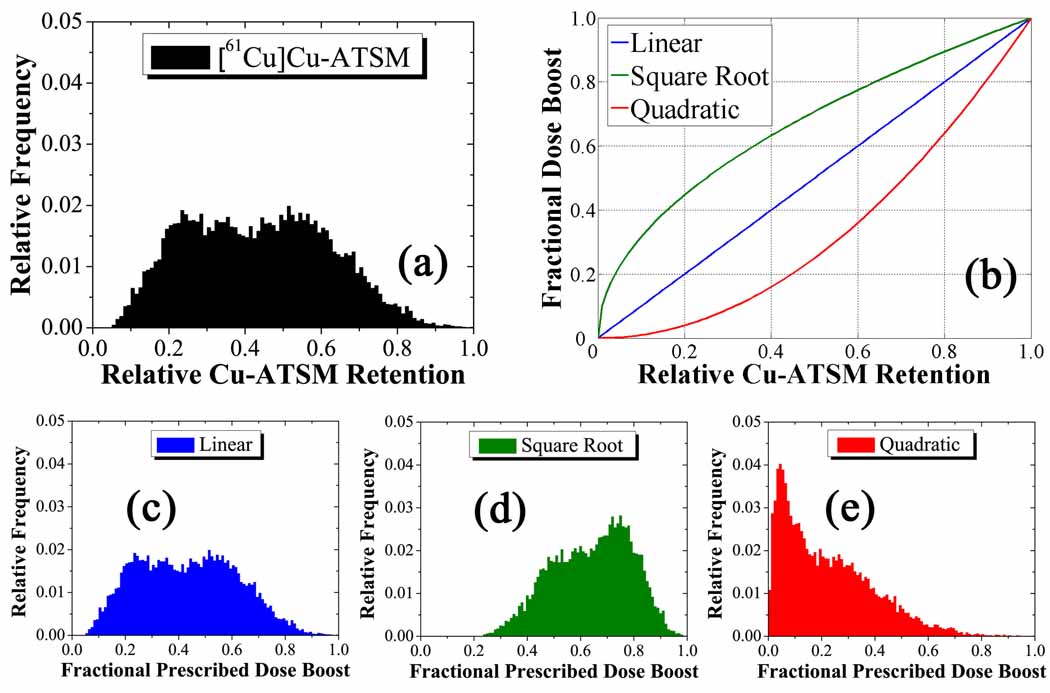
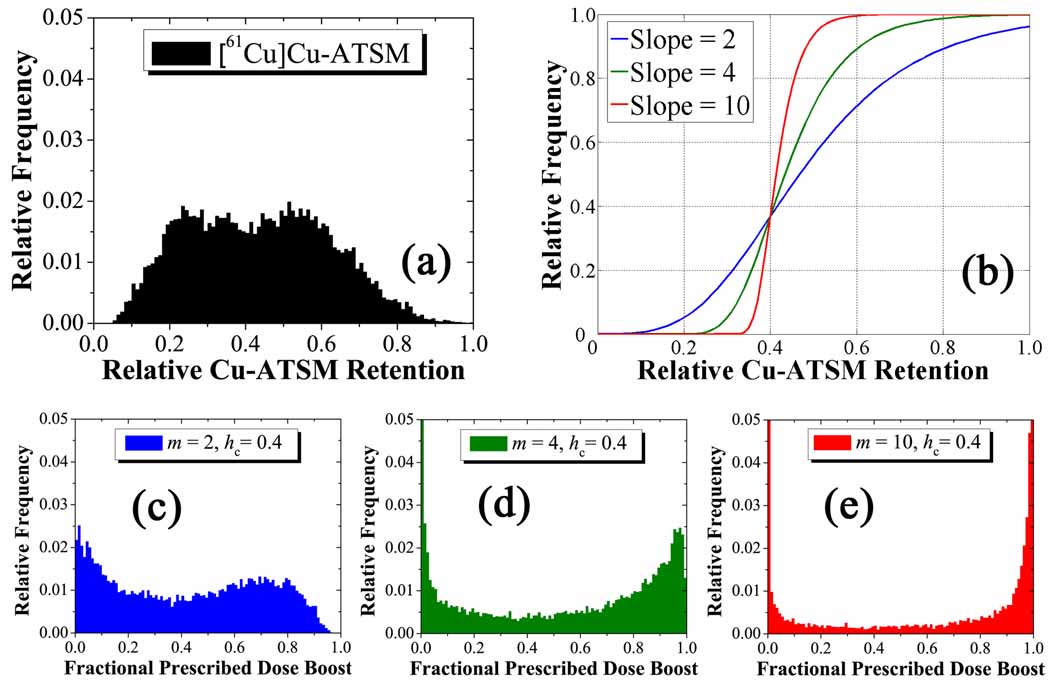
where is the nth moment of the tracer uptake distribution in the PTV. Sigmoid function parameters included the instantaneous slope of the sigmoid function m and the central position of the sigmoid hc, both evaluated at a fractional dose boost 1/e. The ΔDmean and ΔDmax parameters were set to 10 Gy and 20 Gy, respectively. These limits arise from the consideration of acute and latent effects in surrounding normal tissue, as well as central nervous system necrosis (Rabin et al 1996). Integrated boost doses of up to 30 Gy in PET-guided radiotherapy have been well-tolerated in head and neck cases (Madani et al 2007). Optimized treatment plans were created for three values of n for the and cases: 1, ½, and 2, which represent linear, square-root, and quadratic mappings from tracer uptake to boost dose, respectively. Figure 1 shows a histogram of the relative Cu-ATSM uptake distribution in the PTV (a), the three mapping functions (b), and histograms of the fractional prescribed dose boost distributions in the PTV for the linear (c), square root (d), and quadratic (e) cases. Combinations of the parameters m and hc generated prescriptions for the and cases, representing varying sloped and threshold sigmoid mappings from uptake to boost dose. Figure 2 shows a histogram of the relative Cu-ATSM uptake distribution in the PTV (a), three arbitrary mapping functions (b), and histograms of the fractional prescribed dose boost distributions in the PTV for these cases (c–e).
Figure 1.
Generation of prescriptions for the complex HNSCC patient. The input distribution of the relative tracer retention (a) is mapped to the output of relative prescribed dose escalation (c–e) by three unitless polynomial transformations (b). These operate on the magnitude of the tracer retention in each voxel without spatial bias to give weighted output distributions . The unperturbed linear fractional prescribed dose boost distribution gives way to a tighter dose distribution about a higher mean in the square root case, as opposed to a more widespread dose distribution about a lower mean in the quadratic case.
Figure 2.
Generation of prescriptions for the complex HNSCC patient. The input distribution of the relative tracer retention (a) is mapped to the output of relative prescribed dose (c–e) by three unitless sigmoid transformations (b). These operate on the magnitude of the tracer retention in each voxel without bias to spatial position to give weighted output distributions . At fixed threshold and higher slope, the fractional prescribed dose boost distributions become increasingly bimodal with peaks at the minimum and maximum boost doses.
Physically, each polynomial case affects the magnitude of the prescription dose gradients: the linear prescription preserves the magnitude of the input gradients; the square root prescription increases the dose gradients at lower prescribed dose boosts and decreases them at higher prescribed dose boosts; the quadratic prescription decreases the dose gradients at lower dose boosts and increases the gradients at higher dose boosts. On the other hand, each sigmoid case modulates both the steepness and location of prescription dose gradients.
2.3. Treatment planning
Photon dose calculations with helical tomotherapy delivery (Mackie et al 1993, Mackie 2006) were carried out via a convolution/superposition algorithm that employs a dose catcher method (Mackie et al 1988, Ahnesjo 1989, Hoban et al 1994). This delivery modality was shown to deliver conformal dose distributions to boost regions of varying size and magnitude while reducing normal tissue integral dose in a superior manner to step-and-shoot IMRT (Flynn et al 2007). Planning on an in-house system that simulated delivery from the Hi-Art™ treatment geometry (TomoTherapy Inc., Madison, WI) allowed for the variation of several parameters to alter the mode of overlapping the photon beamlets and opening time for each of 64 binary MLC leaves measuring 0.625 cm wide. The pitch p, defined as the ratio of the distance travelled by the table in a single gantry rotation yrot to the width of the fan beam at isocentre ybeam, was fixed at an integer fraction of 0.860 in order to minimize the thread artefact from helical delivery (Kissick et al 2005). The projected jaw width was also reduced from its typical size of 2.450 cm at isocentre. The delivery parameters are listed in table 1.
Table 1.
Helical tomotherapy delivery and iterative linear least-squares optimization parameters for an in-house treatment planning system.
| Variable | Definition | Value | |
|---|---|---|---|
| p | Pitch | 0.860, 0.430, 0.215 | |
| ybeam | Jaw Width | 0.250 cm, 0.625 cm, 1.000 cm, 2.450 cm | |
| xbeam | Leaf Width | 0.625 cm | |
| αk | Tissue k Importance Weight | αk= 1, ∀k considered | |
| βk | Penalty Weight |
|
|
| dk | Prescribed Dose |
|
Beamlet fluences were subsequently optimized by an iterative linear least-squares method (Shepard et al 2000) to yield inhomogeneous planned dose distributions from non-uniform target prescriptions. Specifically, a scalar objective function quadratic in dose difference was minimized at each voxel, in which dose penalties were applied to each region of interest (ROI) and normalized to the number of voxels in a given structure.
With many free parameters governing the objective function, no singular set of optimization parameters can be deemed “optimal” in every case encountered. Nonetheless, in order to make a fair comparison between dose distributions optimized from various non-uniform prescriptions, a consistent value for each parameter was used for all optimizations. Based on the patient geometry and relative location of the PTV, certain segmented ROIs were included in the optimization. OARs located remotely from the treatment volume were omitted, while those near and dose-limiting were included. The treatment volume carried identical overdose and underdose penalties to ensure the planned dose approached the prescribed non-uniform dose. Both normal tissue and OARs only carried overdose penalties as well as prescribed doses of zero. The optimization parameters are listed in table 1. Merits in the choice of these fixed optimization parameters are discussed in relation to the OAR integral dose results of section 3.4.
2.4. Treatment plan evaluation
Optimized dose distributions were visualized in Amira 4.0 (Mercury Computer Systems Inc., Chelmsford, MA) and qualitatively compared to their respective prescriptions for effective dose conformity. Dose volume histograms (DVHs) were used to evaluate the doses delivered to OARs. However, contrary to optimizing from uniform prescriptions, dose distributions optimized from inhomogeneous prescriptions will yield DVHs that do not fall off about a single prescribed dose but rather generate curves with gradual falloff in percent volume as the dose rises above a uniform prescribed dose. In order to properly evaluate the conformity of PTV planned dose distributions to their appropriate non-uniform prescriptions, the quality volume histogram (QVH) concept is introduced (Vanderstraeten et al 2006), a normalized version of the effective DVH (EDVH) (Alber et al 2003).
An effective dose deviation in all voxels is defined as the quotient of the heterogeneous planned dose and the non-uniform prescribed dose, which removes any dependence on the prescribed integral dose and places all transformations in the same mathematical space:
| (2) |
This effective dose distribution denotes the extent of the spread around the normalized prescribed dose. Rather than binning over the original planned dose, QVHs cumulatively bin over the effective dose deviation distribution Q, rendering curves with conventional shoulders and tails associated with uniform prescription structure DVHs.
Generated QVH curves can further be condensed by a metric evaluating the overall strength of the planned dose distribution fit to its appropriate prescription within the PTV, referred to henceforth as Q0.95–1.05 plots. Mathematically, this is achieved by summing over all PTV voxels whose planned dose falls within 5 percent of the prescribed dose. While this is a considerable margin over which to bin, the metric emphasizes how poorly or well the PTV planned dose distribution conforms to each prescription in a single data point that facilitates comparison.
2.5. Sensitivity tests
Utilizing the treatment plan evaluation metrics, the conformity to the prescribed dose is assessed for each of the prescription function parameters. To properly discern heterogeneous dose distribution conformity between prescription function parameters, the dependence on the beamlet size is initially removed by fixing the jaw width. The jaw width chosen is found to provide adequate dose painting resolution of the linear prescription dose gradients in section 3.5. Based on the complex HNSCC case, this condition fixes the beamlet dimensions to 0.625 × 0.625 cm2 with a pitch of 0.860 within sections 3.1–3.4. More homogeneous prescriptions in other HNSCC PTVs could be delivered using 1.000 cm jaw widths. In section 3.1, conformal dose to the target is compared for a range of n-order polynomials to investigate its sensitivity to the magnitude of dose gradients. In section 3.2, conformal dose to the target is evaluated for a range of sigmoid slopes m and threshold centres hc to determine its sensitivity to the magnitude and location of dose gradients.
Due to the uncertainty in the exact shape of the prescription function, the arbitrary choice of a mapping function and corresponding prescription formalism is subject to a hypothetically profound error. Errors propagated to optimized dose distributions from such an erroneous prescription function may have severe consequences and likely impact the planned dose conformity. In section 3.3, conformal dose to the target is contrasted for mapping function errors in the polynomial power coefficient n, sigmoid slope m, and sigmoid centre hc to deduce its sensitivity to uncertainties in the magnitude and location of dose gradients.
Normal structure dose and DVH penalties constrain the optimized dose distribution for each prescription function employed, regardless of the nature of the transformation generating a target prescription. In section 3.4, the integral dose to OARs is calculated and compared to examine its sensitivity to the choice of a prescription function.
Dose painting is intrinsically limited by the spatial resolution of the dose calculation and optimization grid, which was set in this case to match the spatial resolution of the PET image. Yet the ability to resolve prescription dose gradients on a fixed grid relies in part on the finite dose deposition profile determined by the beamlet size that is physically manifested as the extent of scattered radiation in both the longitudinal and transverse directions. In section 3.5, conformal dose to the target from linear transformation-based prescriptions is compared for fixed optimization parameters at various beamlet dimensions and pitches.
3. Results and discussion
3.1. Polynomial transformations
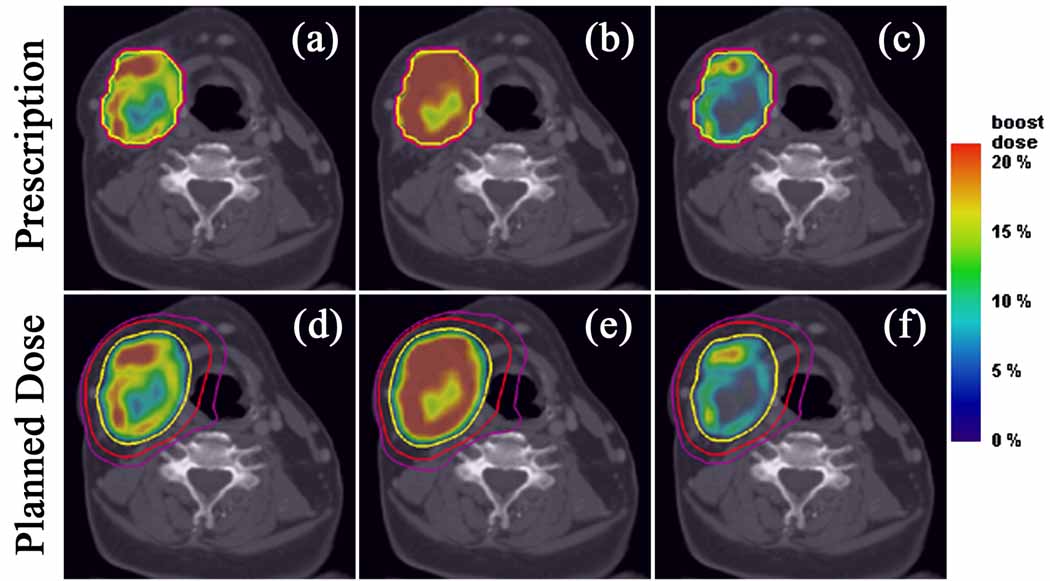
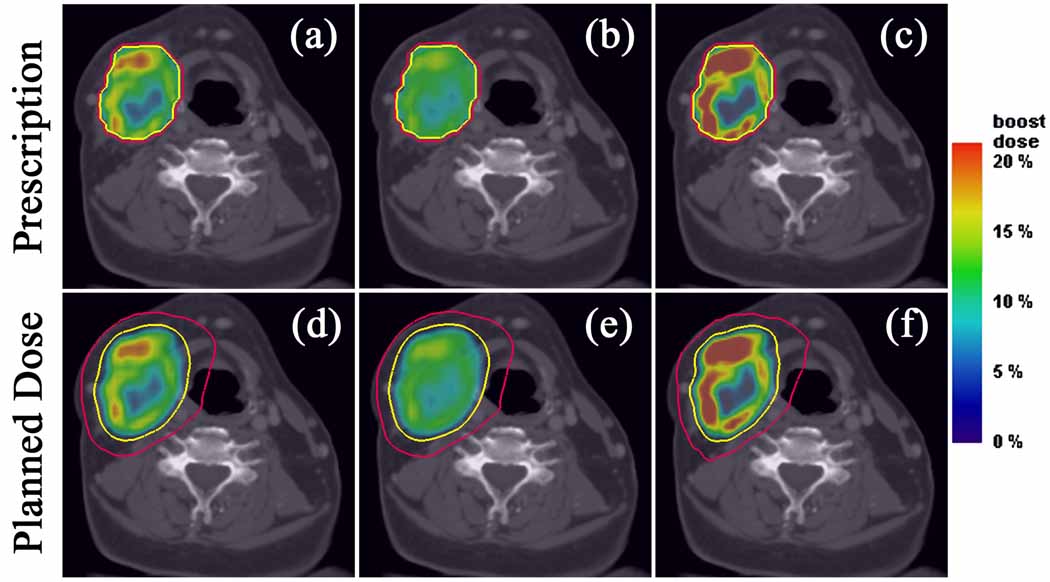
Optimized dose distributions from polynomial function-based prescriptions Pn display variable effective dose conformity, depending on the prescription formalism adopted. In figure 3 where dose is boosted based on , the square root planned dose distribution (figure 3e) most closely resembles its prescription (figure 3b) due to the smoothing of the dose gradients at higher dose boosts and the tighter distribution of prescribed dose about its mean. Contrastingly, the quadratic distribution (figure 3f) least resembles its prescription (figure 3c) due to the sharpening of these same dose gradients at higher dose boosts and larger spread in the distribution of prescribed dose about its mean. From this perspective, it becomes increasingly difficult to deliver conformal dose distributions with photon beamlets of fixed dimensions as the boost region shrinks in size relative to the treatment volume. This echoes an observation made in a previous phantom study on boosting (Flynn et al 2007). When redistributing dose based on as in figure 4, only the prescription dose gradients are altered such that the square root transformation prescribes lower dose escalation to a larger percentage of the PTV, while the quadratic transformation prescribes higher dose to a smaller volume.
Figure 3.
Axial target dose boost distributions from prescriptions for the complex HNSCC patient. Linear (a), square root (b), and quadratic (c) prescriptions and their respective plans (d–f), along with isodose lines of 70 Gy (yellow), 50 Gy (red), and 40 Gy (violet). Note that the dose gradients in the linear case are softened in the square root case by escalating dose to a larger volume and sharpened in the quadratic case by escalating dose to a smaller volume.
Figure 4.
Axial target dose boost distributions from prescriptions for the complex HNSCC patient. Linear (a), square root (b), and quadratic (c) prescriptions and their respective plans (d–f), along with isodose lines of 70 Gy (yellow) and 50 Gy (red). Note that the integral dose to the PTV remains constant but the magnitude of the dose gradients of the linear case decrease in the square root case and increase in the quadratic case.
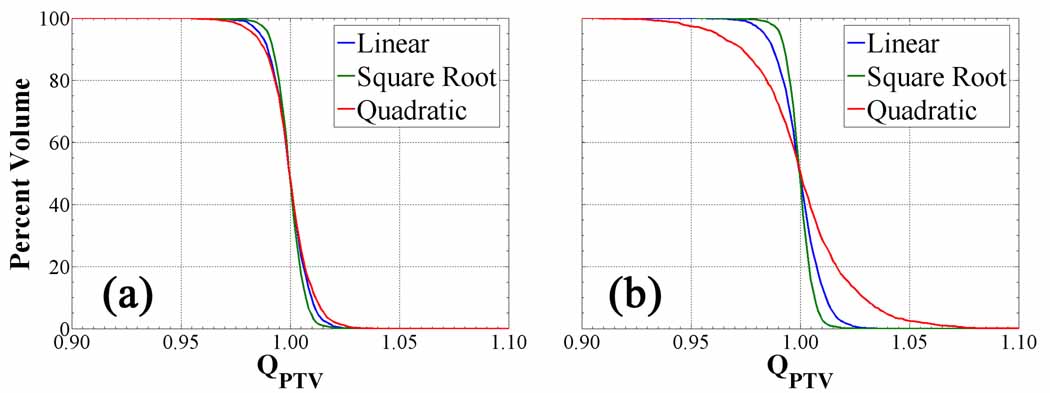
The QVH plots of figure 5 depict the differences in planned dose conformity between polynomial prescriptions. These reiterate the qualitative observation that the steepest gradients imposed by the quadratic transformation result in the greatest loss of PTV coverage. However, the relative deterioration of the quadratic QVH is greater for cases (90 % PTV coverage to QPTV = 0.97) as opposed to the cases (98 % PTV coverage to QPTV = 0.97). While the maximum is held fixed in all polynomial prescriptions, the mean varies in each and is lower in the quadratic transformation relative to the linear transformation. When prescribing about this low mean, the diminutive volumes receiving higher dose will create dose gradients that exceed the achievable dose painting resolution at fixed beamlet dimensions, and consequently larger cold shoulders and hot tails in the corresponding QVH. The linear mapping and to a lesser extent the square root mapping functions are not affected by the formalism, as observed in their respective QVHs. Other HNSCC treatment plans with smaller treatment volumes display little difference in conformity between the polynomial transformations and prescription formalisms, due to the relatively homogeneous uptake and prescribed dose distributions. The steep tracer uptake gradients at the PTV periphery of these small volumes increase under square root transformation and decrease under quadratic transformation, though not to the extent of the complex case. The volume over which the output prescribed dose distribution is altered does not propagate to a significant change in the PTV QVHs.
Figure 5.
Quotient dose volume histograms from Pn prescriptions for the complex HNSCC patient. QVHs of PTV for cases (a) cases (b). The spread in the difference between the QVHs increases for Pint cases compared to Pmax cases.
Polynomial transformations physically determine the rate of conferred radioresistance to cells in each voxel for a given tracer retention, requiring modulated prescription dose gradients to theoretically effect homogeneous local control. The quadratic transformation creates the steepest dose gradients at the surface of volumes with highest tracer uptake, which effectively constrains the achievable planned dose conformity. Planned non-uniform dose distributions readily conform to low order polynomial prescriptions but degrade in target coverage to higher order mapping functions. Increasing the value of the polynomial power coefficient also sensitizes the planned dose conformity to the mathematical formalism of the prescription.
3.2. Sigmoid transformations
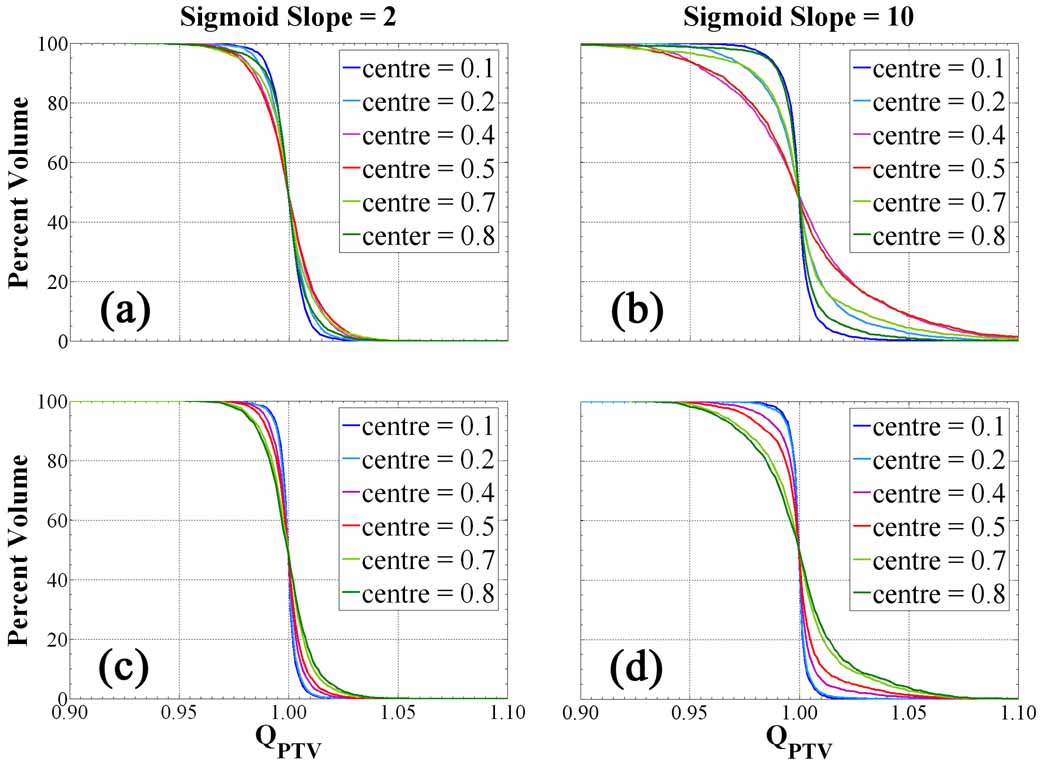
It is apparent that the sensitivity of the QVHs to changes in the slope is drastically altered by the position of the threshold for (figures 6a and 6b). From prescriptions in figure 6a, the treatment volume coverage is insensitive to the threshold position, as minor losses in effective dose conformity arise only from the decreasing size of the boosted subvolume. However, for in figure 6b, loss of tumour coverage is noticeable as hc approaches a value between 0.4 and 0.5. Increasing the prescription sigmoid slope at low threshold position only amounts to boosting an increasing volumetric fraction of the PTV to the maximum dose boost while imposing steep gradients at the edges. This set of dose distributions does not require much modulation and thus facilitates the optimization and delivery feasibility. Shifting the threshold towards a more central position, the dependence on the prescription slope becomes significant, whereby the input tracer distribution has been divided into equal populations. From the histogram of prescribed doses under this condition (figures 2c–e), the equal populations each assume an increasingly singular value of prescribed dose separated by an increasing slope: one approaches zero prescribed dose boost, the other maximal prescribed dose boost. Each fraction of voxels, whether boosted or not, are equally sensitive to the steeper dose gradients, which causes smearing of the delivered dose and severe overdosed regions in the QVH tail coupled with underdosed regions forming in the QVH shoulder. At higher threshold few voxels are boosted, making the distributions completely insensitive to increasing prescription dose gradients. The sigmoid central position explicitly determines the volumetric fraction making up the population of voxels receiving little dose escalation and the population receiving roughly maximum dose escalation. The threshold position strongly couples with the prescription slope to increase the sensitivity of the prescribed dose to changes in tracer retention.
Figure 6.
Quotient volume histograms from Sm,hc prescriptions for the complex HNSCC patient. Cases shown include (a), (b) (c), (d). As the sigmoid slope increases, the QVHs become increasingly sensitive to the sigmoid centre.
cases in figures 6c and 6d confirm the observation that while the QVH curve worsens at a faster rate for large slope and a given threshold as with the previous formalism, this position of maximal loss in plan conformity no longer approaches a central hc of 0.4 but rather a global extreme hc of 0.8. Again, this condition of maximum sensitivity to sigmoid slope arises from the prescription dose histogram and its constraints on the subsequent dose gradients. As the threshold position is increased, the mean of the input tracer retention distribution falls lower on the sigmoid mapping function. Voxels having uptake values below this mean are prescribed minimal dose boosts, meaning that to conserve PTV integral dose voxels with values above the mean must be prescribed an increasingly escalated dose. Thus, the greatest loss in achieving conformal dose distributions from fixed integral dose prescriptions occurs at the highest threshold where dose gradients are steepest. With either formalism, the plans deviate the least from their prescriptions at a threshold position of 0.1, but differ by 5 % over the entire PTV for cases while only by 3 % over the treatment volume for cases.
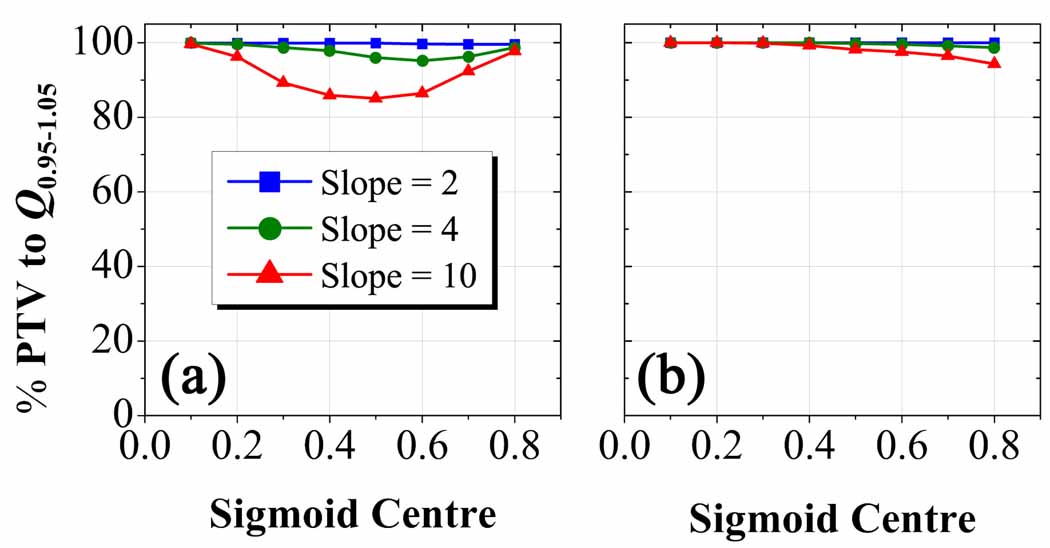
The Q0.95–1.05 plots in figure 7 show that planned dose distributions are more sensitive to prescriptions (a) as compared to prescriptions (b). At a sigmoid slope of 10, Q0.95–1.05 is achieved in at least 85 % of the PTV in figure 7a compared to a minimum of 95 % in figure 7b. The latter plot seems practically independent of sigmoid slope and weakly dependent on sigmoid centre. When these metrics are applied to smaller PTVs with more uniform uptake in other HNSCC cases, discernable differences in planned dose conformity remain only for prescriptions based on functions with the steepest sigmoid slope and centrally-placed threshold position. Under this set of conditions, the dose escalation threshold falls in the centre of the narrow tracer uptake window along the periphery of these small PTVs where gradients are steepest and leads to the least conformal plans.
Figure 7.
Q0.95–1.05 plots for Sm, hc prescription-based dose distributions in the complex HNSCC patient. Percent volume of PTV with voxels having planned dose within 5 percent of their prescribed dose as a function of the parameter hc for cases (a) and cases (b). Note the drastic decrease in sensitivity of the dose conformity to changes in the sigmoid slope and centre for Sint cases as opposed to Smax cases.
Sigmoid transformations expand the parameterization of the prescription function. The dose prescription slope characterizes the sensitivity of dose escalation to relative changes in tracer retention over a relative range of values. The dose prescription threshold centre sets the absolute range over which dose escalation is sensitive to tracer retention values. Planned dose conformity is significantly more sensitive to variations in the sigmoid centre at steeper sigmoid slope and under a formalism that does not preserves integral dose boost by prescribing relative to maximum dose escalation. While the sigmoid mapping function parameters were varied independently, the results indicate moderate coupling between the magnitude of the dose gradients and their location. Since these parameters can not be completely decoupled, sigmoid transformations impose the most demanding constraints on the optimization and generate the lowest achievable planned dose conformity.
3.3. Prescription error
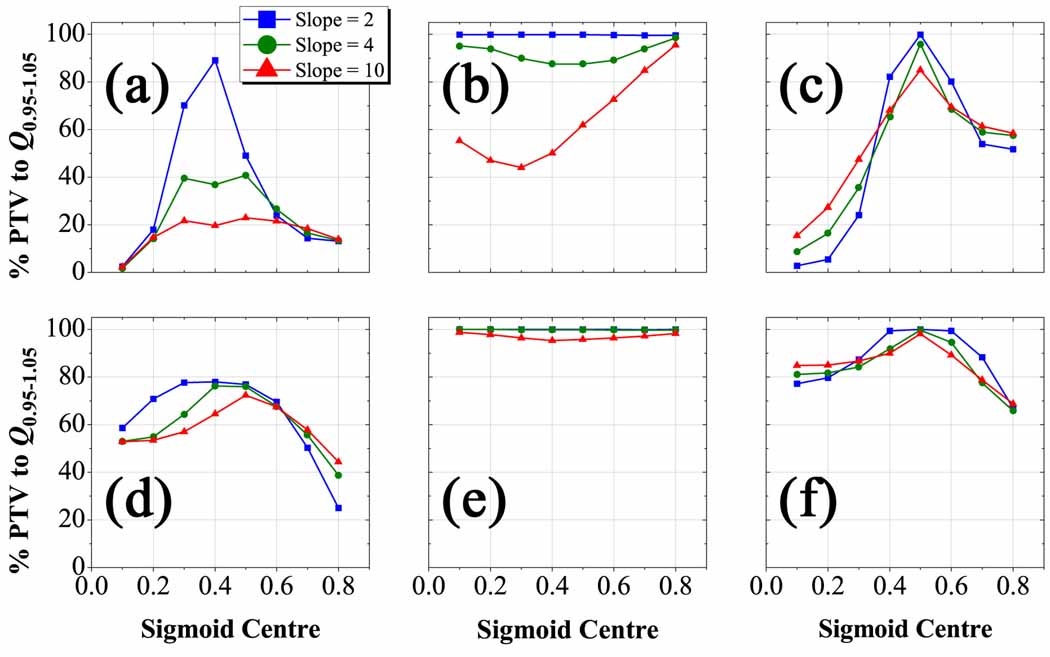
Three tests of planned dose sensitivity to a prescription error were carried out for (figures 8a–c) and (figures 8d–e) cases. The first test (figures 8a and 8d) assumes planned dose distributions based on a linear transformation for different true sigmoid prescriptions. In figure 8a, the behaviour exhibited is reminiscent of a resonance phenomenon, whereby under a narrow window of the sigmoid centre and decreasing sigmoid slope a linear prescription-based plan begins to approximate the true prescription. This observation reaffirms the mathematical limits governing the sigmoid function, namely that at small slope and at the position of linear ascent it is well-approximated by a linear transformation. Q0.95–1.05 peaks at 90 % PTV coverage for , but rapidly falls off with increasing slope, dropping to a mere 20 % PTV coverage for . In figure 8d, linear transformation-based dose distributions for true prescriptions are less sensitive to the same error but do not achieve the same peak, reaching 78 % PTV coverage to Q0.95–1.05 for . For more uniform tracer uptake in less complex HNSCC cases, the resonance peak matching a linear-based plan to a sigmoid based prescription is broadened.
Figure 8.
Q0.95–1.05 plots for S m,hc plans from erroneous prescription functions in the complex HNSCC patient. Percent volume of PTV with voxels having planned dose within 5 % of their prescribed dose as a function of the parameter hc for Smax cases (a–c) and Sint cases (d–f). Conformity of plans was assessed from a presumed linear prescription (a,d), S m=2 prescription (b,e), and S hc =0.5 prescription (c,f). Note that planned dose conformity is more sensitive to changes in the threshold position than the sigmoid slope, but prescriptions that conserve integral dose to the target allow a greater margin of error in the choice of the mapping function.
The second test (figures 8b and 8e) assumes a soft threshold-based planned dose distribution for each true sigmoid prescription over all slopes and centres. The Q0.95–1.05 volume falls from 100 % for to 45 % for , but only diminishes from 100 % for to 95 % for . In other words, when redistributing the dose for fixed integral dose escalation, there is less than 5 percent loss in target coverage no matter the sigmoid slope of the prescription when assuming a soft threshold plan, compared to a 55 percent loss in coverage dose under the same erroneous assumption when prescribing relative to the maximum tracer uptake.
The final test (figures 8c and 8f) plans dose distributions based on a centred sigmoid position of 0.5 for varying true sigmoid prescriptions. A resonance is observed for Smax cases in figure 8c, but unlike the first test is independent of slope and highly dependent on threshold position. The plots peak at 100 % Q0.95–1.05 volume for and fall steeply to 5 % for . As in prior tests, the sensitivity to this error is dampened for Sint cases in figure 8f, in which the Q0.95–1.05 volume drops from 100 % for to 65 % for .
The ability to paint dose is quite sensitive to errors in the presumed shape of the prescription function, particularly when it is assumed to map linearly from the tracer uptake distribution. Planned dose conformity degrades most rapidly in the presence of an error in the sigmoid threshold centre, and degrades the least for an error in the sigmoid slope. Decreasing the uncertainty in the most sensitive parameter, in this case the sigmoid centre hc, amounts to accurately quantifying the absolute range of tracer uptake and retention. Sensitivity to these errors is reduced with decreasing volume and increasing homogeneity in the tracer uptake distribution, making these considerations most crucial in complex cases.
However, a difference in sensitivity to these errors exists between the two prescription formalisms. Under all erroneous assumptions, prescribing about the mean tracer retention appears to permit a greater margin of error in the choice of prescription function. This may be due in large part to the preservation of the integral boost dose which allows the addition as well as subtraction of dose locally to facilitate the creation of steep dose gradients. Optimization based on redistributing dose about a mean voxel boost dose utilizes an additional degree of freedom to shape a given gradient as opposed to simple boosting of dose to a voxel. The less sensitive prescription formalism relaxes the constraints on the precision with which the mapping function parameters must be determined, making it more amenable to practical implementation.
3.4. OAR and normal tissue integral dose
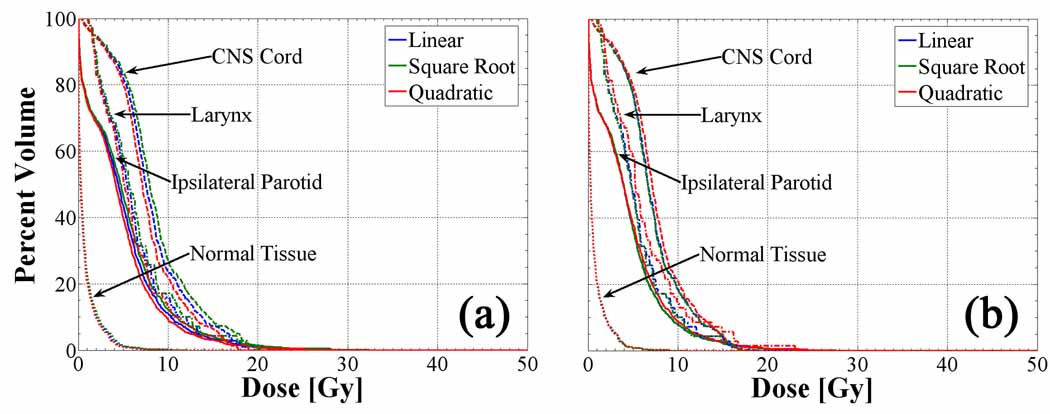
DVHs of three dose-limiting OARs, which included the right parotid, spinal cord and larynx, are plotted for all polynomial transformation-based dose distributions in figure 9. At constant beamlet size, the integral dose to critical structures is quite insensitive to the shape of the polynomial prescription function. Rather, a small divergence between the curves in figure 9a with increasing dose arises from the difference in integral dose to the target volume for cases. As integral dose is added to the treatment volume in the square root-based plan relative to the linear-based plan, the isodose lines are only marginally pushed outward into the surrounding tissue and consequently have little effect on the OAR DVHs. When redistributing the dose to the target for cases in figure 9b, the integral dose to critical structures increases slightly for the quadratic-based plan due to sharper dose gradients at the PTV periphery that push dose into the larynx in particular. The remaining normal tissue DVH imparts little to no observable differences between transformations as a consequence of its vast volume relative to all other ROIs.
Figure 9.
OAR and normal tissue DVHs for cases (a) and cases (b) in the complex HNSCC patient. The integral dose to critical structures varies insignificantly between polynomial transformations as well as for different prescription formalisms.
By utilizing the degrees of freedom afforded by helical tomotherapy delivery of intensity-modulated radiation, conformal avoidance of OARs remains fairly insensitive to various polynomial-based prescriptions in this case. This result would change for cases in which multiple OARs abut and surround the PTV, thereby imposing an increase in integral dose to critical structures for fixed PTV dose conformity or a reduction in conformity for fixed OAR integral dose. One HNSCC case consisting of a centrally-located base of tongue primary does result in an increase of dose to the larynx, but remains within tolerance due to the shallower dose gradients within the PTV. Demanding prescriptions exist that could hypothetically impose infinitely-sloped dose gradients over infinitesimal volumes at the PTV periphery, which would inevitably affect normal tissue integral dose. However, such prescriptions bear no resemblance to those that are deliverable by contemporary technology.
These results also reflect the choice of the optimization parameters fixed in table 1. Dose painting at each PTV voxel requires strict target constraints, which is achieved in this study by eliminating absolute dose and DVH margins in the target objectives while allowing OAR dose to vary without hard penalties. The iterative evolution of the objective function is thus dominated by the conformity of the plan to the non-uniform PTV prescription as opposed to specific critical structure DVH constraints. In cases where proximal OAR DVHs fail to meet well-established physical objectives, such as the absolute dose limit to the spinal cord, stricter OAR penalties must be imposed to the detriment of the PTV QVH.
3.5. Dose painting spatial resolution
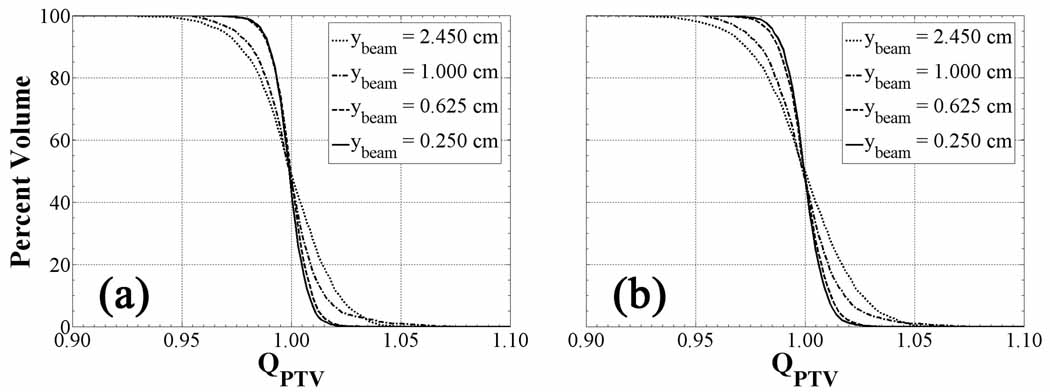
Figure 10 plots QVHs at various jaw widths at a fixed pitch of 0.86 controlling the beamlet longitudinal dimension for (a) and (b). Both plots show increasingly conformal PTV QVH with decreasing beamlet size. The most dramatic improvement occurs between jaw widths of 1.000 cm and 0.625 cm, thereafter quickly converging. Though the dose painting resolution is rather insensitive to a difference in prescription formalism, small variations in the QVH curves are noticeable at the largest jaw width, whereby 99 percent of the PTV achieves a QPTV of 0.95 for as opposed to 97 percent of the volume for .
Figure 10.
Linear transformation QVHs as a function of beamlet size and fixed pitch for the complex HNSCC patient. QVH of the PTV for decreasing jaw width and fixed pitch of 0.86 applied to cases (a) and cases (b). Note that dose plans conform more closely to the prescription and converge as the jaw width approaches longitudinal dimension of the PET voxels (0.391 cm).
The ability of the helical tomotherapy dose distributions to match the dose prescriptions appears to be sensitive to the jaw width for constant pitch. Since the voxel dimension is largest in the longitudinal direction, partial volume effects play a more significant role in producing the steepest dose gradients between adjacent voxels. Smaller jaw widths reduce the longitudinal smearing of dose and result in more conformal non-uniform dose distributions. QVHs from less complex HNSCC plans converge at a larger jaw width than those from more complex plans due to variation in the tracer uptake on a larger spatial scale than individual voxels. Once all dose gradients are resolved, shrinking the beamlet size does not improve the dose painting resolution as it is inherently constrained by the spatial resolution of the functional image from which the dose grid is generated. In all cases, 0.391 cm PET voxel longitudinal dimension require jaw widths on this order or smaller to ensure planned dose distributions conform to the most complex prescribed dose distributions.
A natural extension to this analysis fixes the gantry rotation distance yrot by inversely varying the pitch p and the jaw width ybeam. The expectation would be that similar dose distributions could be delivered using a larger jaw width coupled to a smaller pitch while fixing the treatment time. Pitches of 0.430 and 0.215 were coupled to jaw widths of 1.000 cm and 2.450 cm, respectively, and the Q0.95–1.05 PTV volume percentage for each resulting dose distribution was calculated for comparison to previously implemented values shown in figure 10 (p = 0.860, ybeam = 0.625 cm). Contrary to expectation, the dose conformity drops significantly from 100 % of the PTV for p = 0.860 to 97 % for p = 0.430, and further down to 95 % for p = 0.215. These variations in conformity, despite a constant gantry rotation distance, are attributed to secondary and higher order intensity modulation due to the overlap of successive gantry projections along the longitudinal axis. Primary longitudinal intensity modulation takes place over the gantry rotation distance and thus remains the same for all combinations of pitches and jaw widths chosen here. However, as the pitch is reduced and the jaw width is consequently enlarged, a greater percentage of a given beamlet projected area consists of regions whose intensity modulation is no longer independently varied by a single gantry projection but rather by combinations of several overlapping projections. These overlap regions perturb the dose distribution generated from a small jaw width at large pitch when prescription dose gradients exist on a spatial scale comparable to the beamlet dimensions, specifically on the order of the PET spatial resolution.
Fixing the spatial dimensions of plans from fused multimodal images requires resampling the anatomical and functional images onto a common grid defining the dose prescription spatial resolution. The method of resampling is crucial and depends on the purpose of the image fusion. Utilizing PET images for diagnostic staging emphasizes precise target delineation and contouring on the smallest spatial scale, namely by upsampling the coarser PET image to the finer CT image. On the other hand, the use of PET images for theragnostic planning underscores the preservation of quantitative accuracy in the activity concentration at every PET voxel within the PTV, namely via downsampling as is performed in this study. As PET detectors and reconstruction algorithms augment the detected activity concentration over smaller spatial scales, clinical PET voxel dimensions may eventually match those of clinical CT. Nevertheless, the degree to which plans conform to prescriptions is constrained by the delivery modality spatial resolution. Tomotherapy binary MLCs are commissioned in some centers down to 0.625 cm square-sided beamlets, meaning that grids on the order of 0.098 cm CT voxels could produce highly nonuniform prescriptions whose plans are neither conformal nor deliverable. In this sense, the most logical dose painting spatial resolution for a given treatment planning system is one that matches the prescription dose grid to the beamlet dimensions. Improving the spatial resolution of the PET image until it converges to that of the CT image, both under the minimized constraint of the deliverable spatial resolution, yields the optimal spatial dimensions of the plan.
Variability in the PTV tracer uptake distribution renders each case unique and necessitates improving the dose painting spatial resolution. Regardless of transformation, the prescription dose gradients must be resolved in order to avoid significant loss of target subvolume coverage. This requisite may be addressed in one of two ways: either the beamlet dimensions must be minimized to a fixed size for each case to ensure adequate spatial resolution, or the dimensions may be optimally varied intra-fractionally. The static variation of beamlet size in each case, even with the advent of improved delivery hardware and software, would be severely hampered by uncertainties in patient setup and intra-fraction motion. Tolerable uncertainties due to motion shrink as the beamlet size decreases and hence limit accurate delivery of non-uniform dose distributions. This issue may be resolved with the dynamic variation of the jaw width, whereby larger beamlet widths could adequately deliver more homogeneous doses to motion sensitive areas, while smaller beamlet widths could deliver non-uniform dose with highly modulated intensity fields to motion insensitive regions. Additionally, inter-fraction variation of the tracer uptake distribution in response to radiation therapy shown by mid-therapy PET scans could conceivably alter the dose painting resolution necessary to achieve requisite plan conformity. Thus, as radiotherapy becomes more individualized, it must be adaptable to each of many variables characterizing the treatment course of a given patient.
4. Conclusions
While the exact functional form of the prescription function remains unknown for spatially-variant dose escalation based on given functional imaging tracer retention, the shape of the mapping function directly affects the characteristics of prescription dose gradients within the treatment volume. The location, direction and magnitude of these dose gradients determine the heterogeneity of the prescription and hence the delivery feasibility at fixed beamlet dimensions.
Prescriptions based on a polynomial mapping function are less constraining on their optimized plans, as they modulate only the steepness of dose gradients through the choice of a single parameter. Planned target dose conforms to a greater percentage of the PTV for a low order polynomial transformation-based prescription, as opposed to a smaller percentage of the PTV for a high order polynomial function. In contrast, prescriptions based on a sigmoid mapping function are the most demanding and difficult to deliver, since these modulate both the steepness and location of dose gradients via the coupling of two parameters. Target dose conformity degrades most rapidly for steep-sloped sigmoids, but is more sensitive to the position of the sigmoid function threshold than the magnitude of the sigmoid function slope. Conformity of the planned dose to its prescription thus depends on knowing with greater accuracy and precision the absolute tracer retention range of values over which the prescription dose boost threshold is placed, since this uncertainty has a greater impact on prescription heterogeneity and consequent level of required intensity modulation.
The importance of knowing the shape of the mapping functions for given tracers, whether they follow a polynomial or sigmoid functional dependence, is incontrovertibly affected by the mathematical manner in which the prescription is defined. A prescription formalism that fixes integral dose is less sensitive to errors in the choice of mapping function than one that boosts integral dose, due to an additional degree of freedom in the creation of dose gradients. Via the addition and subtraction of dose about a mean, while maintaining integral dose to the PTV, a greater margin of error in the choice of mapping function is permissible.
The effect of the prescription function shape on target coverage has a reduced influence on integral dose to proximal critical structures, though the results are case-specific. This further exemplifies the tremendous technological advances made in the intensity modulation of radiation, making it possible to safely boost or redistribute the integral dose to the treatment volume from the proper prescription without significantly altering the physical dose to surrounding tissue.
The spatial scale over which dose can be painted to adequately resolve dose gradients imposed is theoretically bound by the resolution of the functional image from which prescriptions are generated. Conformity of planned dose to its prescription in the target improves as the photon beamlet dimensions shrink but saturates on the order of the PET voxel size in this case. Slightly worse conformity can be achieved with larger beamlet dimensions and proportionally smaller pitches at the cost of introducing perturbations in the dose distribution arising from secondary intensity modulation of overlap regions in gantry projections. Ideally, the beamlet dimensions should match the prescription dose grid voxel dimensions to yield conformal dose painting plans.
The sensitivity of IMRT dose optimization to variations in the parameters governing the prescription function depends on the shape of the input tracer uptake distribution. Precise and accurate determination of these parameters is more crucial in complex cases where intratumoural tracer uptake heterogeneity exists on small spatial scales. Yet even the least complex cases require a level of constraint on the shape of the prescription function, albeit with a greater margin for error. Eventual clinical implementation of dose painting via the delivery of biological imaging-based dose distributions rests on successful advances in accurate absolute quantification of functional images, reduction of uncertainties in target definition due to intra-fraction motion and uncertainties in target prescription due to inter-fraction therapeutic response, as well as improvements in delivery techniques over smaller spatial scales.
Acknowledgements
This work was funded by NIH grant R21 CA114259. The authors greatly appreciate the efforts of Tim Bohm, Michael Kissick, and John Vetter who maintained the UW-Medical Physics GLOW computer cluster on which the dose calculations and optimizations were run. Thanks to Jerry Nickles and Miguel Avila-Rodriguez who provided the [61Cu]Cu-ATSM for functional PET imaging. The authors express their gratitude towards Scott Perlman and Chris Jaskowiak for overseeing the PET scans, as well as Paul Harari for the treatment plan contours in the head and neck cases.
Footnotes
Classification Numbers:
87.53.-j (Effects of ionizing radiation on biological systems)
87.55.-x (Treatment strategy: treatment planning, optimization, tissue response factors, and dose-volume analysis)
References
- Ahnesjo A. Collapsed cone convolution of radiant energy for photon dose calculation in heterogeneous media. Med Phys. 1989;16:577–592. doi: 10.1118/1.596360. [DOI] [PubMed] [Google Scholar]
- Alber M, Paulsen F, Eschmann SM, Machulla HJ. On biologically conformal boost dose optimization. Phys Med Biol. 2003;48:N31–N35. doi: 10.1088/0031-9155/48/2/404. [DOI] [PubMed] [Google Scholar]
- Apisarnthanarax S, Chao KS. Current imaging paradigms in radiation oncology. Radiat Res. 2005;163:1–25. doi: 10.1667/rr3279. [DOI] [PubMed] [Google Scholar]
- Bentzen SM. Theragnostic imaging for radiation oncology: dose-painting by numbers. Lancet Oncol. 2005;6:112–117. doi: 10.1016/S1470-2045(05)01737-7. [DOI] [PubMed] [Google Scholar]
- Brahme A. Development of radiation therapy optimization. Acta Oncol. 2000;39:579–595. doi: 10.1080/028418600750013267. [DOI] [PubMed] [Google Scholar]
- Brahme A, Ågren AK. Optimal dose distribution for eradication of heterogeneous tumours. Acta Oncol. 1987;26:377–385. doi: 10.3109/02841868709104364. [DOI] [PubMed] [Google Scholar]
- Brahme A, Lind BK. Quantification of the steepness of the dose response relation. Int J Radiat Oncol Biol Phys. 1999;45:243–245. [PubMed] [Google Scholar]
- Brahme A, Nilsson J, Belkic D. Biologically optimized radiation therapy. Acta Oncol. 2001;40:725–734. doi: 10.1080/02841860152619142. [DOI] [PubMed] [Google Scholar]
- Chao KS, Bosch WR, Mutic S, Lewis JS, Dehdashti F, Mintun MA, Dempsey JF, Perez CA, Purdy JA, Welch MJ. A novel approach to overcome hypoxic tumor resistance: Cu-ATSM-guided intensity-modulated radiation therapy. Int J Radiat Oncol Biol Phys. 2001;49:1171–1182. doi: 10.1016/s0360-3016(00)01433-4. [DOI] [PubMed] [Google Scholar]
- Convery DJ, Rosenbloom ME. Treatment delivery accuracy in intensity-modulated conformal radiotherapy. Phys Med Biol. 1995;40:979–999. doi: 10.1088/0031-9155/40/6/002. [DOI] [PubMed] [Google Scholar]
- Das SK, Miften MM, Zhou S, Bell M, Munley MT, Whiddon CS, Craciunescu O, Baydush AH, Wong T, Rosenman JG, Dewhirst MW, Marks LB. Feasibility of optimizing the dose distribution in lung tumors using fluorine-18-fluorodeoxyglucose positron emission tomography and single photon emission computed tomography guided dose prescriptions. Med Phys. 2004;31:1452–1461. doi: 10.1118/1.1750991. [DOI] [PubMed] [Google Scholar]
- Dehdashti F, Grigsby PW, Lewis JS, Laforest R, Siegel BA, Welch MJ. Assessing tumor hypoxia in cervical cancer by PET with 60Cu-labeled diacetyl-bis(N4-methylthiosemicarbazone) J Nucl Med. 2008;49:201–205. doi: 10.2967/jnumed.107.048520. [DOI] [PubMed] [Google Scholar]
- Dehdashti F, Grigsby PW, Mintun MA, Lewis JS, Siegel BA, Welch MJ. Assessing tumor hypoxia in cervical cancer by positron emission tomography with 60Cu-ATSM: relationship to therapeutic response-a preliminary report. Int J Radiat Oncol Biol Phys. 2003a;55:1233–1238. doi: 10.1016/s0360-3016(02)04477-2. [DOI] [PubMed] [Google Scholar]
- Dehdashti F, Mintun MA, Lewis JS, Bradley J, Govindan R, Laforest R, Welch MJ, Siegel BA. In vivo assessment of tumor hypoxia in lung cancer with 60Cu-ATSM. Eur J Nucl Med Mol Imaging. 2003b;30:844–850. doi: 10.1007/s00259-003-1130-4. [DOI] [PubMed] [Google Scholar]
- Flynn RT, Barbee DL, Mackie TR, Jeraj R. Comparison of intensity modulated x-ray therapy and intensity modulated proton therapy for selective subvolume boosting: a phantom study. Phys Med Biol. 2007;52:1–19. doi: 10.1088/0031-9155/52/20/001. [DOI] [PMC free article] [PubMed] [Google Scholar]
- Foulds L. The experimental study of tumor progression: a review. Cancer Res. 1954;14:327–339. [PubMed] [Google Scholar]
- Fujibayashi Y, Taniuchi H, Yonekura Y, Ohtani H, Konishi J, Yokoyama A. Copper-62-ATSM: a new hypoxia imaging agent with high membrane permeability and low redox potential. J Nucl Med. 1997;38:1155–1160. [PubMed] [Google Scholar]
- Hanahan D, Weinberg RA. The hallmarks of cancer. Cell. 2000;100:57–70. doi: 10.1016/s0092-8674(00)81683-9. [DOI] [PubMed] [Google Scholar]
- Hoban PW, Murray DC, Round WH. Photon beam convolution using polyenergetic energy deposition kernels. Phys Med Biol. 1994;39:669–685. doi: 10.1088/0031-9155/39/4/002. [DOI] [PubMed] [Google Scholar]
- Källman P, Lind B, Eklof A, Brahme A. Shaping of arbitrary dose distributions by dynamic multileaf collimation. Phys Med Biol. 1988;33:1291–1300. doi: 10.1088/0031-9155/33/11/007. [DOI] [PubMed] [Google Scholar]
- Kissick MW, Fenwick J, James JA, Jeraj R, Kapatoes JM, Keller H, Mackie TR, Olivera G, Soisson ET. The helical tomotherapy thread effect. Med Phys. 2005;32:1414–1423. doi: 10.1118/1.1896453. [DOI] [PubMed] [Google Scholar]
- Levin-Plotnik D, Hamilton RJ. Optimization of tumour control probability for heterogeneous tumours in fractionated radiotherapy treatment protocols. Phys Med Biol. 2004;49:407–424. doi: 10.1088/0031-9155/49/3/005. [DOI] [PubMed] [Google Scholar]
- Lewis JS, Sharp TL, Laforest R, Fujibayashi Y, Welch MJ. Tumor uptake of copper-diacetyl-bis(N(4)-methylthiosemicarbazone): effect of changes in tissue oxygenation. J Nucl Med. 2001;42:655–661. [PubMed] [Google Scholar]
- Ling CC, Humm J, Larson S, Amols H, Fuks Z, Leibel S, Koutcher JA. Towards multidimensional radiotherapy (MD-CRT): biological imaging and biological conformality. Int J Radiat Oncol Biol Phys. 2000;47:551–560. doi: 10.1016/s0360-3016(00)00467-3. [DOI] [PubMed] [Google Scholar]
- Mackie TR. History of tomotherapy. Phys Med Biol. 2006;51:R427–R453. doi: 10.1088/0031-9155/51/13/R24. [DOI] [PubMed] [Google Scholar]
- Mackie TR, Bielajew AF, Rogers DW, Battista JJ. Generation of photon energy deposition kernels using the EGS Monte Carlo code. Phys Med Biol. 1988;33:1–20. doi: 10.1088/0031-9155/33/1/001. [DOI] [PubMed] [Google Scholar]
- Mackie TR, Holmes T, Swerdloff S, Reckwerdt P, Deasy JO, Yang J, Paliwal B, Kinsella T. Tomotherapy: a new concept for the delivery of dynamic conformal radiotherapy. Med Phys. 1993;20:1709–1719. doi: 10.1118/1.596958. [DOI] [PubMed] [Google Scholar]
- Madani I, Duthoy W, Derie C, De Gersem W, Boterberg T, Saerens M, Jacobs F, Gregoire V, Lonneux M, Vakaet L, Vanderstraeten B, Bauters W, Bonte K, Thierens H, De Neve W. Positron emission tomography-guided, focal-dose escalation using intensity-modulated radiotherapy for head and neck cancer. Int J Radiat Oncol Biol Phys. 2007;68:126–135. doi: 10.1016/j.ijrobp.2006.12.070. [DOI] [PubMed] [Google Scholar]
- Nordsmark M, Bentzen SM, Rudat V, Brizel D, Lartigau E, Stadler P, Becker A, Adam M, Molls M, Dunst J, Terris DJ, Overgaard J. Prognostic value of tumor oxygenation in 397 head and neck tumors after primary radiation therapy. An international multi-center study. Radiother Oncol. 2005;77:18–24. doi: 10.1016/j.radonc.2005.06.038. [DOI] [PubMed] [Google Scholar]
- Nordsmark M, Overgaard M, Overgaard J. Pretreatment oxygenation predicts radiation response in advanced squamous cell carcinoma of the head and neck. Radiother Oncol. 1996;41:31–39. doi: 10.1016/s0167-8140(96)91811-3. [DOI] [PubMed] [Google Scholar]
- Obata A, Yoshimi E, Waki A, Lewis JS, Oyama N, Welch MJ, Saji H, Yonekura Y, Fujibayashi Y. Retention mechanism of hypoxia selective nuclear imaging/radiotherapeutic agent cu-diacetyl-bis(N4-methylthiosemicarbazone) (Cu-ATSM) in tumor cells. Ann Nucl Med. 2001;15:499–504. doi: 10.1007/BF02988502. [DOI] [PubMed] [Google Scholar]
- Portelance L, Chao KS, Grigsby PW, Bennet H, Low D. Intensity-modulated radiation therapy (IMRT) reduces small bowel, rectum, and bladder doses in patients with cervical cancer receiving pelvic and para-aortic irradiation. Int J Radiat Oncol Biol Phys. 2001;51:261–266. doi: 10.1016/s0360-3016(01)01664-9. [DOI] [PubMed] [Google Scholar]
- Rabin BM, Meyer JR, Berlin JW, Marymount MH, Palka PS, Russell EJ. Radiation-induced changes in the central nervous system and head and neck. Radiographics. 1996;16:1055–1072. doi: 10.1148/radiographics.16.5.8888390. [DOI] [PubMed] [Google Scholar]
- Shepard DM, Olivera GH, Reckwerdt PJ, Mackie TR. Iterative approaches to dose optimization in tomotherapy. Phys Med Biol. 2000;45:69–90. doi: 10.1088/0031-9155/45/1/306. [DOI] [PubMed] [Google Scholar]
- Søvik Å, Malinen E, Bruland OS, Bentzen SM, Olsen DR. Optimization of tumour control probability in hypoxic tumours by radiation dose redistribution: a modelling study. Phys Med Biol. 2007a;52:499–513. doi: 10.1088/0031-9155/52/2/013. [DOI] [PubMed] [Google Scholar]
- Søvik Å, Malinen E, Skogmo HK, Bentzen SM, Bruland OS, Olsen DR. Radiotherapy adapted to spatial and temporal variability in tumor hypoxia. Int J Radiat Oncol Biol Phys. 2007b;68:1496–1504. doi: 10.1016/j.ijrobp.2007.04.027. [DOI] [PubMed] [Google Scholar]
- Stewart RD, Li XA. BGRT: Biologically-guided radiation therapy -- The future is fast approaching! Med Phys. 2007;34:3739–3751. doi: 10.1118/1.2779861. [DOI] [PubMed] [Google Scholar]
- Thorwarth D, Eschmann SM, Paulsen F, Alber M. Hypoxia dose painting by numbers: a planning study. Int J Radiat Oncol Biol Phys. 2007;68:291–300. doi: 10.1016/j.ijrobp.2006.11.061. [DOI] [PubMed] [Google Scholar]
- Vanderstraeten B, De Gersem W, Duthoy W, De Neve W, Thierens H. Implementation of biologically conformal radiation therapy (BCRT) in an algorithmic segmentation-based inverse planning approach. Phys Med Biol. 2006;51:N277–N286. doi: 10.1088/0031-9155/51/16/N02. [DOI] [PubMed] [Google Scholar]
- Veikkola T, Alitalo K. VEGFs, receptors and angiogenesis. Semin Cancer Biol. 1999;9:211–220. doi: 10.1006/scbi.1998.0091. [DOI] [PubMed] [Google Scholar]
- Xing L, Cotrutz C, Hunjan S, Boyer AL, Adalsteinsson E, Spielman D. Inverse planning for functional image-guided intensity-modulated radiation therapy. Phys Med Biol. 2002;47:3567–3578. doi: 10.1088/0031-9155/47/20/301. [DOI] [PubMed] [Google Scholar]
- Yang Y, Xing L. Towards biologically conformal radiation therapy (BCRT): selective IMRT dose escalation under the guidance of spatial biology distribution. Med Phys. 2005;32:1473–1484. doi: 10.1118/1.1924312. [DOI] [PubMed] [Google Scholar]
- Yu CX, Symons MJ, Du MN, Martinez AA, Wong JW. A method for implementing dynamic photon beam intensity modulation using independent jaws and a multileaf collimator. Phys Med Biol. 1995;40:769–787. doi: 10.1088/0031-9155/40/5/005. [DOI] [PubMed] [Google Scholar]
- Zelefsky MJ, Fuks Z, Hunt M, Yamada Y, Marion C, Ling CC, Amols H, Venkatraman ES, Leibel SA. High-dose intensity modulated radiation therapy for prostate cancer: early toxicity and biochemical outcome in 772 patients. Int J Radiat Oncol Biol Phys. 2002;53:1111–1116. doi: 10.1016/s0360-3016(02)02857-2. [DOI] [PubMed] [Google Scholar]


