

Abstract
The reliable detection, sizing and sorting of viruses and nanoparticles is important for biosensing, environmental monitoring, and quality control. Here we introduce an optical detection scheme for the real-time and label-free detection and recognition of single viruses and larger proteins. The method makes use of nanofluidic channels in combination with optical interferometry. Elastically scattered light from single viruses traversing a stationary laser focus is detected with a differential heterodyne interferometer and the resulting signal allows single viruses to be characterized individually. Heterodyne detection eliminates phase variations due to different particle trajectories, thus improving the recognition accuracy as compared to standard optical interferometry. We demonstrate the practicality of our approach by resolving nanoparticles of various sizes, and detecting and recognizing different species of human viruses from a mixture. The detection system can be readily integrated into larger nanofluidic architectures for practical applications.
Keywords: biosensing, virus detection, nanofluidics, nanoparticles, optical interferometry, light scattering
Nanoparticles play a critical role in biomedical diagnostics and treatments,1,2 process control in manufacturing,3 explosives,4 optical microscopy,5 environmental monitoring and climate change,6-8 and various other fields. It has been shown that an increase in the levels of ultra-fine particulates in the air can contribute to an incidence of respiratory and cardiac disease, and there is evidence that nanoparticles within this fraction can penetrate the lung causing inflammation and can spread to other organs within the body.9,10 Detection of nanoparticles on a single particle level provides the ultimate sensitivity, which is of critical importance for early detection of threats and preventive measures.
There is also a strong need to reliably detect harmful nano-sized biological agents, such as viruses. Viruses are responsible for a large number of human diseases, including the flu, chicken-pox, cold sores, and the common cold. In many cases, the human immune system is not able to fight viral pathogens resulting in serious disease or death.11 Examples are SARS, Ebola, AIDS, and the avian flu. There is also evidence that viral agents cause some neurological diseases (multiple sclerosis, chronic fatigue syndrome) or psychiatric illnesses,12 and it is believed that cervical cancer is initiated by papillomavirus.13
There is a growing need to rapidly and accurately quantify viruses, but time-consuming techniques such as the plaque titer method remain the standard.14,15 Most viral load tests are done using PCR and currently are not sensitive to viral loads below 50.16,17 In addition these methods detect only the genetic material of viruses and not the intact infectious particle. Viruses are also employed as biowarfare agents and hence reliable and ultrasensitive virus detection is also important for national security.
In recent years, several studies have focused on developing new and improved optical techniques for particle detection.18-24 Some of the methods are aimed at sensitive detection of viruses and proteins.25-29 It was shown that interferometric detection provides single nanoparticle sensitivity30-34 and the potential for real-time detection.2,35,37,38 A high sensitivity in nanoparticle detection is crucial, but equally important is rapid characterization and identification. For example, a target virus needs to be discriminated from carbon contaminants generated in abundance by combustion.
An important fingerprint in nanoparticle characterization is the particle polarizability
| (1) |
where R is the particle radius, and εp and εm are the dielectric permittivities of the particle and the surrounding medium, respectively. α relates the induced electric dipole p to the exciting electric field E according to p = αE, and defines the scattering and absorption efficiencies.1 Evidently, α bears information on both particle size (R) and composition (εp), and thus the scattered light can be used to extract these physical parameters.
The phase sensitivity of standard interferometric measurements makes it difficult to accurately assess α of a target particle. In real-time monitoring, particles typically travel through a stationary laser focus, and the scattered field is recorded interferometrically. Since slight variations in the particle’s position have a significant influence on the phase of the scattered field, detection should effectively decouple amplitude and phase. Here we accomplish this goal by introducing a variant of optical heterodyne detection.
Heterodyne detection yields two independent measurements of a particle’s scattered field, thereby making it possible to separate amplitude and phase. We demonstrate that by eliminating the phase from the detector signal, we can reliably assess a single particle’s polarizability. Furthermore, combining heterodyning with differential detection allows us to greatly reduce background and laser power noise and achieve high detection sensitivity. In its current configuration, the detection scheme is able to detect and classify viruses in liquids on a single particle basis and within a time window of τ ~ 1 ms.
Results and discussion
Differential Optical Heterodyne Detection
As illustrated in Fig. Figure 1, our detection scheme is based on combining the light scattered by a nanoparticle Es(ω), as it passes through a focused laser beam, with the frequency-shifted reference field Er(ω + Δω), where Δω is the detuning frequency. The interference between the two fields is registered by a split photodetector (Supplementary Information). The detector generates a differential signal S(r), which contains the heterodyne signature of the moving particles. The differential nature of the detector makes the output signal free from non-interferometric contributions. In addition to Er, the scattered field Es also interferes with background light Eb due to reflections from interfaces, such as the nanochannel boundaries. Taking all the terms into account we can write the differential signal from the detector as
| (2) |
where Δφ is the phase difference between the scattered and the reference light, and Δφb is the phase difference between the scattered light and the background light. The stationary interferometric term EbEr is eliminated upon taking the difference between the two halves of the detector (Supplementary Information). The signal S(r) is then processed by a lock-in amplifier with reference Δω, which eliminates the contribution of the background field to the signal. The lock-in amplifier renders the two orthogonal signals
| (3) |
where Eexc(r) is the (complex) focused laser field incident on the particle located at r, and x is the position of the particle in the direction transverse to the focus. In homodyne detection, only one of these phase-sensitive signals would be recorded. Heterodyne interferometry allows us to calculate the modulus, , which reflects the particle polarizability α and is phase-independent. This greatly reduces the sensitivity of the experiment on the particle’s trajectory.
Figure 1.
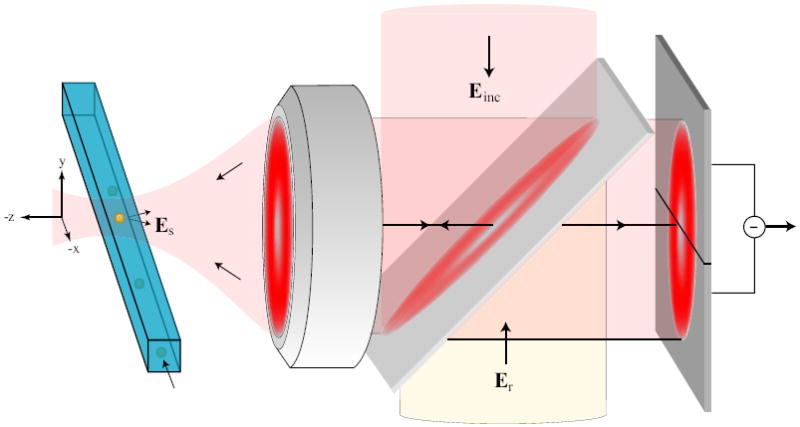
Heterodyne interferometric detection of the light scattered by a nanoparticle or a virus (yellow) as it traverses a laser focus. The scheme employs an excitation laser (Eexc) with frequency ω that is reflected off a beamsplitter and focused via an objective into a nanofluidic channel. The scattered light (Es) is superimposed to a reference beam (Er) with frequency ω + Δω and directed onto a differential detector.
To experimentally verify the predicted signals we use an immobilized 100 nm polystyrene sphere as a test particle. By means of a piezo scan stage, the particle is first positioned in the focus r = (x,y,z) = (0,0,0) of the stationary excitation beam and then periodically scanned in the transverse x direction. The black curve in Fig. Figure 2a shows the raw detector signal according to Eq. (2) and the blue curve is the corresponding demodulated absolute value A. The inset shows the oscillations at the carrier frequency Δω. Because of the presence of the background field Eb, the heterodyne signal exhibits a time-dependent baseline. While the width of the blue curve is associated with the size of the laser focus (~ 0.5μm) and the particle velocity (~ 250μm/s), its height reflects the particle polarizability α.
Figure 2.
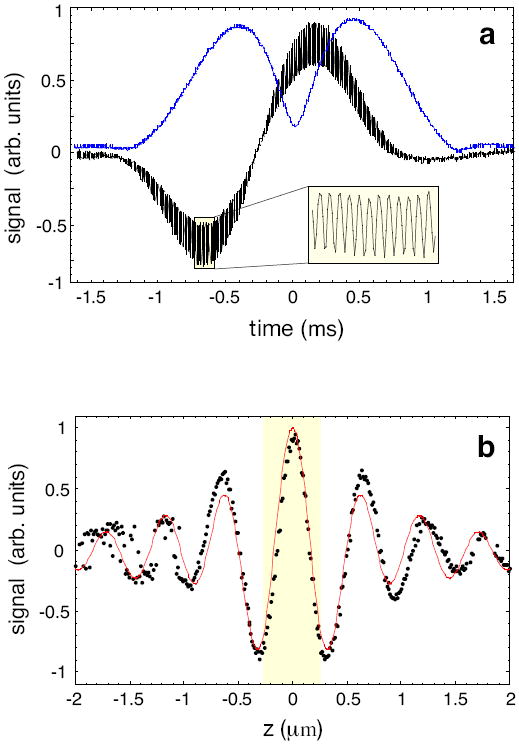
Experimental signals recorded with a test particle scanned through the laser focus. (a) The black curve shows the raw detector signal according Eq. (2) and the blue curve is the demodulated modulus A. The amplitude of A is a measure for the particle polarizability α. (b) Demonstration of the phase sensitivity of homodyne detection. The figure shows the maximum value of Sx recorded by scanning a test particle through the laser focus in different transverse planes z = const. The shaded region corresponds to the width of the nanofluidic channels used in our experiments. Phase variations across the nanochannel dimensions have a strong influence on the signal strength of Sx (homodyne detection). Dots: experimental data; red curve: theoretical curve.
To characterize the influence of the phase on the signal strength Sx we repeated the experiment for different offsets (z=const.) along the optical axis, representing the typical range of particle trajectories. For each z position, we evaluate the maximum value of Sx(x). The result, shown in Fig. Figure 2b, represents the signal variations in a standard homodyne detection scheme. Evidently the phase variations cause the signal to vary rapidly with z. Therefore, different particle trajectories affect the homodyne signal strongly, which diminishes the measurement accuracy and makes it difficult to assess the particle size and polarizability. In heterodyne detection, on the other hand, the phase can be eliminated. The resulting signal no longer varies across the typical range of particle trajectories (highlighted stripe). As will be discussed in the following, the elimination of phase variations leads to improved measurement accuracy.
System Performance
A given set of particle measurements will have a characteristic size distribution, whose width represents the actual particle size distribution as well as the measurement uncertainty. We estimate the width as the standard deviation
| (4) |
which has several contributing terms. Here, σsystem is due to the system response, which is the distribution that would be obtained for a single particle crossing the focus many times on the same trajectory, and σtrajectory represents the signal variation due to the various trajectories a particle may take. The heterodyne system eliminates the phase dependence of this variation, but the modulus A is also affected to a small degree. Finally, σsize represents the actual distribution of particle sizes, which is the quantity we generally wish to determine.
In the following sections, we present experimental results that characterize the system response, σsystem, and the trajectory uncertainty, σtrajectory. Once these quantities are known for a given experimental configuration, it is straightforward to isolate the particle size distribution, σsize.
Response Function
We evaluate the detection sensitivity and the signal-to-noise ratio (SNR) with a single immobilized nanoparticle that is repeatedly scanned through the laser focus. This configuration eliminates the problems associated with particle heterogeneity and different particle trajectories.
Polystyrene nanoparticles are deposited on a clean glass cover slip by spin-coating the solution containing the particles. Upon evaporation of the liquid, the particles are firmly attached to the surface of the cover slip by Van-der-Waals forces. The particles are then covered by a drop of water to mimic detection in solution. The sample is then placed on a piezoelectric positioning stage and the focusing objective (NA=1.4) is brought in focus with the glass-water interface. To eliminate back-reflected light due to total internal reflection from the glass-water interface we artificially reduce the NA to 1.3 using an iris in the beam path. A single nanoparticle is then positioned in the focus. A sinusoidal voltage is then applied to the scan-stage to periodically translate the particle through the laser focus. The positioning stage translates the particle periodically through the focus, keeping the transit time constant at τ ~ 2 ms. Each detection event, corresponding to the particle passing through the laser focus, renders the signals Sx(t) and Sy(t) as described by Eq. (3), from which we calculate the modulus (c.f. Fig. Figure 2a).
As shown by the blue curve in Fig. Figure 2a, the signal A(t) has a characteristic double-peak structure. This information is used to distinguish detection events from system noise. For each detection event we evaluate the maximum peak amplitude of A(t) and use the resulting value as a data point in a histogram. A sufficiently large number of detection events generates a characteristic signal distribution. The signal can be calibrated to the particle’s size because the signal magnitude scales linearly with the polarizability α (c.f. Eq. 1)37 and hence with the third power of particle size R. Fig. Figure 3a shows a size histogram obtained for an immobilized 75 nm polystyrene particle. In essence, this size distribution represents the system response function, and the width of the distribution, 0.7 nm, defines the resolving power of the measurement approach.
Figure 3.
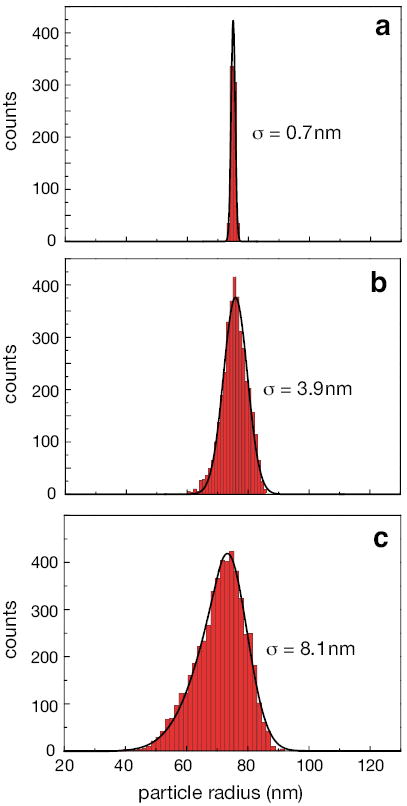
Experimental particle size distributions measured with the heterodyne approach for (a) a single immobilized 75 nm polystyrene particle that is repeatedly scanned through the laser focus, (b) a single 75 nm polystyrene particle electroosmotically trapped in a nanochannel, and (c) an ensemble of 75 nm polystyrene particles freely flowing through a nanochannel. The standard deviations for the respective size measurements (reflecting the size resolutions in the measurements) are indicated by the σ values.
Homodyne detection yields a size distribution that is significantly wider, which can be demonstrated by plotting a histogram of sizes obtained from the signal Sx(t) [or Sy(t)] by itself. This increase in width originates from the fact that the homodyne signal is affected by phase variations due to interferometer instabilities and by small deviations in particle trajectories.
Particle Trajectories
Having quantified the system’s response with a single immobilized particle, we next characterize the influence of different particle trajectories and Brownian motion. As shown in Fig. Figure 1, we use a flow-through scheme that employs a nanofluidic channel to direct single nanoparticles through a stationary laser beam. The characterization of particle trajectories requires that the particle size does not vary between measurements. However, commercial nanoparticle solutions come with a finite size distribution. In order to eliminate this ambiguity we implemented an electroosmotic recycling scheme, which allows us to interrogate the same single particle over and over again.
The nanofluidic channels used in our experiments are fabricated in fused silica wafers using UV lithography (c.f. Supplementary Fig. 4). The nanochannels are 15 μm long, have a 500 × 500 nm square cross-section, and are connected to two reservoirs.35 A single nanochannel is positioned in the laser focus by means of the scan stage. A nanoparticle solution is introduced into one of the reservoirs and a particle flow is established using the electroosmotic effect.38
To repeatedly interrogate the same nanoparticle, the electroosmotic voltage is controlled by a feedback loop. The signal from a single particle traversing the laser focus is used to flip the electroosmotic voltage immediately after the passage, causing the nanoparticle to reverse its direction of motion and pass through the laser focus again. In order for the trap to be stable, the particle’s passage time τ through the laser focus (size Δx ≈ 300 nm) needs to be shorter than the timescale associated with Brownian motion, i.e. τ < Δx2/2D, where D is the diffusion coefficient. In water D ≈ 10-11m2/s and hence τ < 5 ms. In our experiments τ ≈ 1 ms, which typically allows us to detect a single nanoparticle more than 104 times before it escapes due to Brownian motion.
A characteristic time trace for a single electroosmotically trapped nanoparticle is depicted in Fig. Figure 4. All curves have been recorded simultaneously and correspond to a snapshot of a longer time-trace of 30 seconds. The top curve (red) shows the periodic switching of the electroosmotic potential, the center curve (blue) is the homodyne signal Sx(t), and the bottom curve (black) is the heterodyne signal A(t). As discussed earlier, the phase variations due to different particle trajectories are fully contained in Sx(t) but are eliminated in A(t). Therefore, as shown in Fig. Figure 4, the variations between individual detection events are considerably larger in the homodyne signal than in the heterodyne signal, supporting our hypothesis that the phase should be eliminated for accurate particle characterization.
Figure 4.
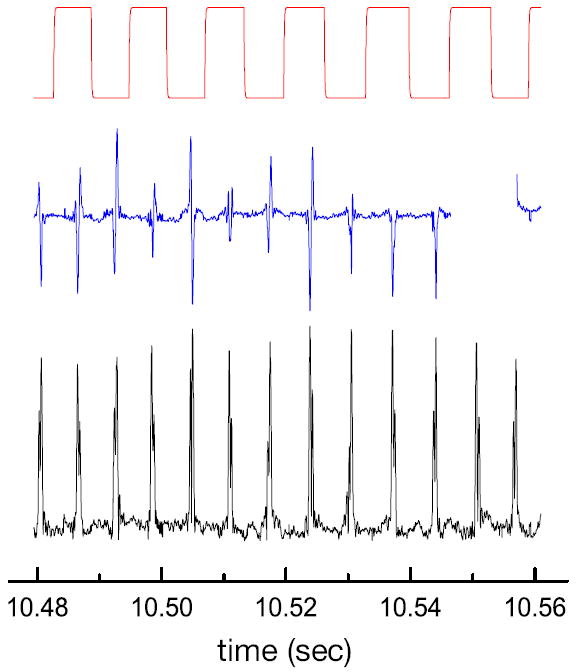
Time trace for a single 75 nm polystyrene particle repeatedly passing through the laser focus. The figure shows the periodic switching of the electroosmotic potential (top), the homodyne signal Sx(t) (center), and the heterodyne signal A(t) bottom. It is evident that the signal variations between detection events are lower for A(t) than for Sx(t), proving that the elimination of phase variations due to different particle trajectories improves the detection accuracy.
We next evaluate the maximum value of A(t) for each particle passage and establish a distribution of the values. The resulting histogram is shown in Fig. Figure 3b. Since we detect the same particle repeatedly, the factors contributing to signal variations are system noise and variations in particle trajectories. The latter gives rise to a broadened size distribution as compared to the immobilized particle case shown in Fig. Figure 3a. The width of the distribution is evaluated to be σ = 4.2 nm. Homodyne detection (Sx or Sy) yields considerably wider distributions (c.f. Supplementary Fig. 5) because of phase variations due to different particle trajectories.
Similar experiments were performed for polystyrene particles of different sizes and for gold nanoparticles. In all cases the elimination of the phase improves the detection accuracy. Notice that the residual variations in heterodyne detection are mostly due to the fact that the size of the laser focus is smaller than the transverse size of the nanochannel. Thus, the particle trajectory still affects the signal amplitude in the heterodyne case, however this influence is much weaker than the phase variations. By using a larger focus (or narrower nanochannels), the distribution can be narrowed. However, better accuracy in this case comes at the expense of lower sensitivity since the signal-to-noise ratio for a single detection event is reduced as the NA is decreased.
Ensembles of Single Nanoparticles
The particle distributions further broaden if different nanoparticles from particle solutions are used. Having characterized the detector response and the influence of varying particle trajectories we now concentrate on the size distribution of particles in a solution.
To detect different particles from solutions we open the feedback loop controlling the electroosmotic trapping. Under this condition, a constant electroosmotic potential propels single nanoparticles through the nanochannel. Fig. Figure 3c shows the recorded size distribution for ~5000 different 75 nm polystyrene spheres. The distribution is slightly asymmetric with a standard deviation of σtotal = 8.1 nm, from which we determine the particle size uncertainty σsize according to Eq. (4). Now, σsystem = 0.7 nm is the contribution of the system response to the width (Fig. Figure 3 a), and is the width associated with the variations in particle trajectories (Figs. Figure 3 a,b). The size uncertainty is found to be σsize = 6.9 nm. By comparison, homodyne detection yields much larger signal variations (c.f. Fig. Figure 4) and precludes accurate particle size determination.
The optical detection scheme introduced here can be employed for measuring the homogeneity of particle samples and for testing the specifications of commercially available particle solutions. Most particle sizing methods make use of surface immobilization, which is generally less effective for small particles as compared to larger ones. The variation in binding strength affects the measured particle size distributions and hence the specified standard deviations. On the other hand, our detection scheme does not rely on immobilization, which makes the measured distributions more reliable. For example, the asymmetry of the measured distribution in Fig. Figure 3c is likely the result of the manufacturer’s filtering process, which is effective for the removal of large particles but less effective for the smaller ones.
The accuracy of a single measurement (or the accuracy of size discrimination in a single measurement) of our method is given by the width of the size distribution for a monodisperse sample. Because it is not possible to obtain a truly monodisperse sample, we implemented multiple measurements of a single oscillating particle in fluid (Figure 3b). The width of this distribution defines the confidence interval for a single size measurement. The confidence interval can however change depending on the material composition of the particles. The latter constitutes an important limitation of our method - using different material particles requires proper recalibration of the system.
Characterization of Nanoparticle Mixtures
Using the above method, it is possible to distinguish between nanoparticles of different sizes or materials in the same solution. In this section we present results obtained with mixtures of gold and polystyrene particles of different sizes.
Fig. Figure 5a shows the particle size distribution recorded for a mixture of polystyrene particles with mean radii of 50 nm and 75 nm. The concentration of 50 nm particles is about twice the concentration of 75 nm particles. Using heterodyne detection we clearly resolve the two particle sizes. The sorting and classification of nanoparticles could proceed, for example, by introducing a threshold at R = 62 nm, which corresponds to the minimum in the histogram in Fig. Figure 5a. Detection events that yield larger signals are then classified as 75 nm particles whereas lower amplitude signals are assigned to be 50 nm particles.
Figure 5.
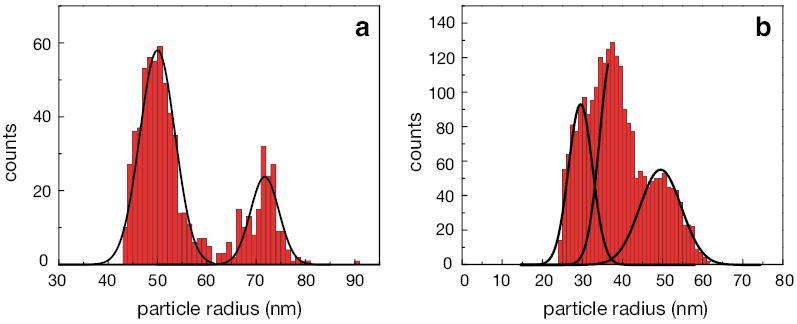
Particle size distributions for mixtures of particles flowing through a nanochannel. (a) Size distribution for a mixture of 50 nm and 75 nm polystyrene nanoparticles. (b) Size distribution for a mixture of 30 nm, 40 nm, and 50 nm gold nanoparticles.Functions, containing two and three Gaussians, are numerically fitted to the distributions in a) and b) respectively, with the correlation coefficients above 0.95.
Similar experiments were repeated with gold nanoparticles. Fig. Figure 5b shows the size distributions recorded for a mixture of gold nanoparticles with mean radii of 30 nm, 40 nm, and 50 nm. Our heterodyne detection scheme resolves the particles although the individual distributions are largely overlapping. Notice that the widths of the individual distributions are dominated by true particle size variations and that more monodisperse particle solutions would yield better detection accuracy.For the homodyne detection scheme, however, the joint particle distribution is too broad to identify individual particle peaks (c.f. Supplementary Fig.6).
Detection and Classification of Viruses
The size of most human viruses is in the range of 20 – 200 nm,40 which is well suited to the capabilities of the heterodyne detection scheme. We have successfully detected HIV, Influenza, Sindbis, Vaccinia, Parainfluenza(Sendai), and Baculovirus in separate samples on the single virus level. For virus detection, we use pressure-driven flow instead of electroosmotic flow (see Methods). The velocity profile and flow-speed control of the two methods are similar, but electroosmotic flow tends to heat the buffer solution of the viruses.41 When added to heating due to the light focus, this can cause the formation of vapor bubbles42 and decomposition of the sample, which clogs the nanofluidic channels and disrupts the measurement process. Pressure-driven flow does not heat the buffer solution.
Fig. Figure 6a shows the size distribution recorded for a sample of HIV virus (ADA strain). The viruses are initially suspended in TNE buffer (0.01 M Tris pH 7.2, 0.1 M NaCl, 1 mM EDTA), which makes them positively charged. To avoid sticking to the negatively-charged glass surfaces of the nanochannels, the virus sample was diluted with a 2% solution of Polyvinylpyrrolidone (PVP) in TNE buffer, which forms a protein-repellent layer in the nanofluidic channel. To calibrate the HIV size distributions, the mean radius of HIV particles is taken to be 50 nm, as determined from TEM measurements.43
Figure 6.
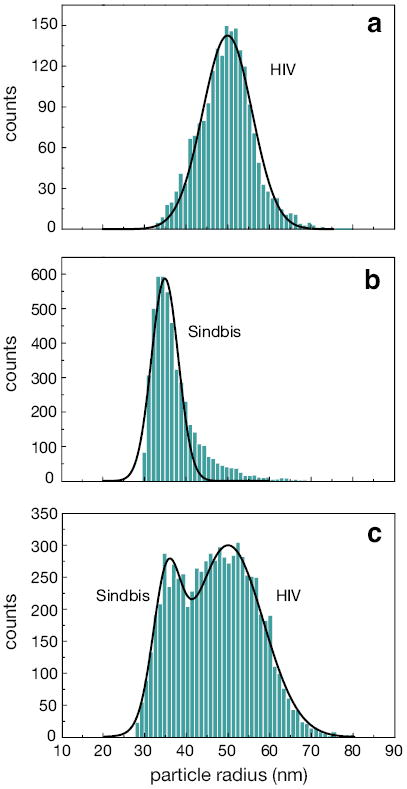
Size distributions for different virus types. (a) HIV (ADA strain) and (b) Sindbis virus. (c) Size distribution for a mixture of HIV and Sindbis viruses.
In Fig. Figure 6b we show the size distribution for a sample of Sindbis virus. The virus particles are suspended in a buffer consisting of MEM (pH 7.2) and 5% Fetal Bovine Serum (FBS). For calibration purposes, the mean radius of Sindbis virus particles is assumed to be 35 nm according to TEM measurements.44
To demonstrate the ability to detect and distinguish single HIV and Sindbis viruses we record the size distribution for a mixture of the two viruses. Fig. Figure 6c shows that the two virus types can be resolved. The size distribution is calibrated with respect to the mean size of a HIV virus particle (50 nm). Note, that according to this calibration, the mean size of Sindbis viruses turns out to be ~ 35 nm, which is in good agreement with the TEM measurements, and indicates that the optical properties (εp) of the two virus types are similar. Our results indicate that it is possible to distinguish by size individual viruses in a mixture of different virus types, provided we know, for calibration purposes, the mean size of at least one virus type.
Conclusions
Our results show that by eliminating the phase sensitivity in interferometric particle detection we can improve the accuracy of particle characterization and identification. The heterodyne detection scheme introduced in this work makes it possible to characterize and sort nanoparticles based on their polarizability α. Each nanoparticle is detected individually in a nanofluidic channel and the detector signal can be used to separate and sort nanoparticles in a larger nanofluidic network. We have demonstrated that our system can detect single viruses in a sample and also distinguish between different kinds of virus types in a mixture of viruses. Our ability to detect viruses with single particle sensitivity can also be used for accurate measurements of virus concentrations. We anticipate that these abilities will find application in biodetection, contamination and quality control, and in pharmaceutical and biomedical research. In principle, multiple wavelengths can be used in a heterodyne detection, thereby making it possible to obtain independent fingerprints for the size and the material of a target particle. The sensitivity and accuracy of our detection scheme can be improved by a miniaturized design that eliminates laser pointing instabilities. The present work assumes isotropic polarizability of the particles under investigation, which means that currently the method cannot be used to distinguish between spherical and non-spherical particles.
Methods
Electroosmotic flow in nanofluidic channels
The output from a variable high voltage power supply is applied across two gold electrodes. About 2 μl of the test sample is introduced into one of the reservoirs35 of the microfluidic device. The interconnecting channel is monitored using a CCD camera (see Supplementary Fig.3) to observe the propagation of the sample through the channel by the capillary forces. Once the solution completely fills the channel, about 2 μl of the sample is applied to the reservoir at the opposite end of the device. Two gold electrodes are then dipped into the reservoirs and the voltage is adjusted such that the passage time of individual particles through the laser focus is ~ 1 ms. The flow speed is monitored by analyzing the real-time data collected by the data-acquisition system.
Pressure-driven flow in nanofluidic channels
A luer-lock female barbed coupler is modified by cutting off its barbed end. The inside diameter of the cut is chosen to match the diameter of the microfluidic reservoirs. The coupler is glued to one of the reservoirs and made air-tight with fast-cure epoxy glue. A segment of Tygon PVC tubing (inside diameter 3/32“) about 10“ in length is attached to the attached coupler. Another luer-lock female barbed coupler, identical to the one attached to the reservoir, is then inserted into the other end of the PVC tubing, with the barbed end kept intact. An inflation device, such as syringe, is attached to the coupler. The test sample is applied at the opposite reservoir. The inflation device is used to create a vacuum, which induces flow inside the channel. The vacuum level is adjusted to obtain the desired nanoparticle flow speed of ~ 1 ms through the laser focus.
Supplementary Material
Acknowledgments
This work was supported by DARPA (W31P4Q-08-1-0005), Agilent Technologies, NIH (AI085543), and the University of Rochester Developmental Center for AIDS Research (NIH P30AI078498). We thank Tuli Mukhopadhyay (Indiana University) for providing Sindbis virus samples and to John Lesoine for help with nanochannel fabrication and coating.
References
- 1.Yezhelyev MV, Gao X, Xing Y, Al-Hajj A, Nie S, O’Regan RM. Emerging Use of Nanoparticles in Diagnosis and Treatment of Breast Cancer. Lancet Oncol. 2006;7:657–667. doi: 10.1016/S1470-2045(06)70793-8. [DOI] [PubMed] [Google Scholar]
- 2.Loo C, Lin A, Hirsch L, Lee MH, Barton J, Halas N, West J, Drezek R. Nanoshell-enabled Photonics-based Imaging and Therapy of Cancer. Technol Cancer Res T. 2004;3:33–40. doi: 10.1177/153303460400300104. [DOI] [PubMed] [Google Scholar]
- 3.Doering R, Nishi Y, editors. Handbook of Semiconductor Manufacturing Technology. 2. CRC Press; Boca Raton: 2007. [Google Scholar]
- 4.Brousseau L. Enhanced Nanocomposite Combustion Accelerant and Methods for Making the Same. 7338711. U S Patent. 2008 April 3;
- 5.Horisberger M, Rosset J. Colloidal Gold, a Useful Marker for Transmission and Scanning Electron - Microscopy. J Histochem Cytochem. 1977;25:295–305. doi: 10.1177/25.4.323352. [DOI] [PubMed] [Google Scholar]
- 6.Menon S, Hansen J, Nazarenko L, Luo Y. Climate Effects of Black Carbon Aerosols in China and India. Science. 2002;297:2250–2253. doi: 10.1126/science.1075159. [DOI] [PubMed] [Google Scholar]
- 7.Kaufman YJ, Koren I. Smoke and Pollution Aerosol Effect on Cloud Cover. Science. 2006;313:655–658. doi: 10.1126/science.1126232. [DOI] [PubMed] [Google Scholar]
- 8.Ramanathan V, Carmichael G. Global and Regional Climate Changes due to Black Carbon. Nature Geosc. 2008;1:221–227. [Google Scholar]
- 9.Holgate ST, Samet JM, Koren HS, Maynard R, editors. Air Pollution and Health. Academic Press; San Diego: 1999. [Google Scholar]
- 10.Somers CM, McCarry BE, Malek F, Quinn JS. Reduction of Particulate Air Pollution Lowers the Risk of Heritable Mutations in Mice. Science. 2004;304:1008–1010. doi: 10.1126/science.1095815. [DOI] [PubMed] [Google Scholar]
- 11.Anderson B, Friedman H, Bendinelli M, editors. Microorganisms and Bioterrorism. 1. Springer; New York: 2006. [Google Scholar]
- 12.Chen CH, Chiu YL, Wei FC, Koong FJ, Liu HC, Shaw CK, Hwu HG, Hsiao KJ. High Seroprevalence of Borna Virus Infection in Schizophrenic Patients, Family Members and Mental Health Workers in Taiwan. Mol Psychiatry. 1999;4:33–38. doi: 10.1038/sj.mp.4000484. [DOI] [PubMed] [Google Scholar]
- 13.Walboomers JMM, Jacobs MV, Manos MM, Bosch FX, Kummer JA, Shah KV, Snijders PJF, Peto J, Meijer CJLM, Munoz N. Human Papillomavirus is a Necessary Cause of Invasive Cervical Cancer Worldwide. J Pathol. 1999;189:12–19. doi: 10.1002/(SICI)1096-9896(199909)189:1<12::AID-PATH431>3.0.CO;2-F. [DOI] [PubMed] [Google Scholar]
- 14.Brussaard CPD, Marie D, Bratbak G. Flow Cytometric Detection of Viruses. J Virol Meth. 1998;85:175–182. doi: 10.1016/s0166-0934(99)00167-6. [DOI] [PubMed] [Google Scholar]
- 15.Stoffel CL, Kathy RF, Rowlen KL. Design and Characterization of a Compact Dual Channel Virus Counter. Cytometry. 2005;65A:140–147. doi: 10.1002/cyto.a.20145. [DOI] [PubMed] [Google Scholar]
- 16.Caliendo AM, Ingersoll J, Green AM, Nolte FS, Easley KA. Comparison of the Sensitivities and Viral Load Values of the AMPLICOR HIV-1 MONITOR Version 1.0 and 1.5 Tests. J Clin Microbiol. 2004;42:5392–5393. doi: 10.1128/JCM.42.11.5392-5393.2004. [DOI] [PMC free article] [PubMed] [Google Scholar]
- 17.Damond F, Collin G, Descamps D, Matheron S, Pueyo S, Taieb A, Campa P, Benard A, Chene G, Brun-Vezinet F. Improved Sensitivity of Human Immunodeficiency Virus Type 2 Subtype B Plasma Viral Load Assay. J Clin Microbiol. 2005;43:4234–4236. doi: 10.1128/JCM.43.8.4234-4236.2005. [DOI] [PMC free article] [PubMed] [Google Scholar]
- 18.Clark NA, Lunacek JH, Benedek GB. A Study of Brownian Motion Using Light Scattering. Am J Phys. 1970;38:575–585. [Google Scholar]
- 19.Blom MT, Chmela E, Oosterbroek R, Tijssen R, van den Berg A. On-chip Hydrodynamic Chromatography Separation and Detection of Nanoparticles and Biomolecules. Anal Chem. 2003;75:6761. doi: 10.1021/ac034663l. [DOI] [PubMed] [Google Scholar]
- 20.Prikulis J, Svedberg F, Kall M, Enger J, Ramser K, Goksor M, Hanstorp D. Optical Spectroscopy of Single Trapped Metal Nanoparticles in Solution. Nanolet. 2004;4:115–118. [Google Scholar]
- 21.Bouhelier A, Beversluis MR, Novotny L. Characterization of Nanoplasmonic Structures by Locally Excited Photoluminescence. Appl Phys Lett. 2003;83:5041–5043. [Google Scholar]
- 22.Yguerabide J, Yguerabide EE. Light-scattering Submicroscopic Particles as Highly Fluorescent Analogs and their use as Tracer Labels in Clinical and Biological Applications. Anal Biochem. 1998;262:157–176. doi: 10.1006/abio.1998.2760. [DOI] [PubMed] [Google Scholar]
- 23.Sonnichsen C, Geier S, Hecker NE, von Plessen G, Feldmann J. Spectroscopy of Single Metallic Nanoparticles using Total Internal Reflection Microscopy. Appl Phys Lett. 2000;77:2949–2951. [Google Scholar]
- 24.Schultz S, Smith D, Mock J, Schultz D. Single-Target Molecule Detection with Non-bleaching Multicolor Optical Immunolabels. Proc Natl Acad Sci USA. 2000;97:996–1001. doi: 10.1073/pnas.97.3.996. [DOI] [PMC free article] [PubMed] [Google Scholar]
- 25.Arnold S, Khoshsima M, Teraoka I. Shift of Whispering-Gallery Modes in Microspheres by Protein Adsorption. Opt Lett. 2003;28:272–274. doi: 10.1364/ol.28.000272. [DOI] [PubMed] [Google Scholar]
- 26.Arnold S, Ramjit R, Keng D, Kolchenko V, Teraoka I. Microparticle Photophysics Illuminates Viral Biosensing. Faraday Discussions. 2008;137:65–83. doi: 10.1039/b702920a. [DOI] [PubMed] [Google Scholar]
- 27.Vollmer F, Arnold S. Whispering-gallery-mode Biosensing: Label-free Detection down to Single Molecules. Nature Methods. 2008;5:591–596. doi: 10.1038/nmeth.1221. [DOI] [PubMed] [Google Scholar]
- 28.Patolsky F, Zheng G, Hayden O, Lakadamyali M, Zhuang X, Lieber CM. Electrical Detection of Single Viruses. Proc Natl Acad Sci USA. 2004;101:14017–14022. doi: 10.1073/pnas.0406159101. [DOI] [PMC free article] [PubMed] [Google Scholar]
- 29.Zheng G, Patolsky F, Cui Y, Wang WU, Lieber CM. Multiplexed Electrical Detection of Cancer Markers with Nanowire Sensor Arrays. Nature Biotechnology. 2005;23:1294–1301. doi: 10.1038/nbt1138. [DOI] [PubMed] [Google Scholar]
- 30.Lindfors K, Kalkbrenner T, Stoller P, Sandoghdar V. Detection and Spectroscopy of Gold Nanoparticles using Supercontinuum White Light Confocal Microscopy. Phys Rev Lett. 2004;93:037401. doi: 10.1103/PhysRevLett.93.037401. [DOI] [PubMed] [Google Scholar]
- 31.Batchelder JS, Taubenblatt MA. Measurement of Size and Refractive Index of Particles using the Complex Forward-Scattered Electromagnetic Field. 5,037,202. U S Patent. 1991 doi: 10.1364/AO.30.004972. [DOI] [PubMed]
- 32.Batchelder JS, DeCain DM, Taubenblatt MA, Wickramasinghe HK, Williams CC. Particulate Inspection of Fluids Using Interferometric Light Measurements. 5,061,070. U S Patent. 1991
- 33.Boyer D, Tamarat P, Maali A, Lounis B, Orrit M. Photothermal Imaging of NanometerSized Metal Particles Among Scatterers Radiation. Science. 2002;297:1160–1163. doi: 10.1126/science.1073765. [DOI] [PubMed] [Google Scholar]
- 34.Plakhotnik T, Palm V. Interferometric Signatures of Single Molecules. Phys Rev Lett. 2001;87:183602. doi: 10.1103/PhysRevLett.87.015504. [DOI] [PubMed] [Google Scholar]
- 35.Ignatovich FV, Novotny L. Experimental Study of Nanoparticle Detection by Optical Gradient Forces. Rev Sci Instr. 2003;74:5231–5235. [Google Scholar]
- 37.Ignatovich FV, Novotny L. Real-time and Background-free Detection of Nanoscale Particles. Phys Rev Lett. 2006;96:013901. doi: 10.1103/PhysRevLett.96.013901. [DOI] [PubMed] [Google Scholar]
- 38.Ignatovich FV, Topham D, Novotny L. Optical Detection of Single Nanoparticles and Viruses. IEEE J Sel Top in Quant Elec. 2006;12:1292–1300. [Google Scholar]
- 40.Strauss EG. Viruses and Human Disease. 1. Academic Press; New York: 2001. [Google Scholar]
- 41.Tang G, Yan D, Yang C, Gong H, Chai JC, Lam YC. Assessment of Joule Heating and its Effects on Electroosmotic Flow and Electrophoretic Transport of Solutes in Microfluidic Channels. Electrophoresis. 2006;27:628–639. doi: 10.1002/elps.200500681. [DOI] [PubMed] [Google Scholar]
- 42.Knox JH, McCormack KA. Enhanced Dielectric Contrast in Scattering-type Scanning Near-field Optical Microscopy. Chromatographia. 1994;38:207–214. [Google Scholar]
- 43.Takasaki T, Kurane I, Aihara H, Ohkawa N, Yamaguchi J. Electron Microscopic Study of Human Immunodeficiency Virus Type 1 (HIV-1) Core Structure: Two RNA Strands in the Core of Mature and Budding Particles. Archives of Virology. 1997;142:375–382. doi: 10.1007/s007050050083. [DOI] [PubMed] [Google Scholar]
- 44.Zhang W, Mukhopadhyay S, Pletnev SV, Baker TS, Kuhn RJ, Rossmann MG. Placement of the Structural Proteins in Sindbis Virus. J Virol. 2002;76:11645–11658. doi: 10.1128/JVI.76.22.11645-11658.2002. [DOI] [PMC free article] [PubMed] [Google Scholar]
Associated Data
This section collects any data citations, data availability statements, or supplementary materials included in this article.