Abstract
Background
The Mlabri are a group of nomadic hunter-gatherers inhabiting the rural highlands of Thailand. Little is known about the origins of the Mlabri and linguistic evidence suggests that the present-day Mlabri language most likely arose from Tin, a Khmuic language in the Austro-Asiatic language family. This study aims to examine whether the genetic affinity of the Mlabri is consistent with this linguistic relationship, and to further explore the origins of this enigmatic population.
Results
We conducted a genome-wide analysis of genetic variation using more than fifty thousand single nucleotide polymorphisms (SNPs) typed in thirteen population samples from Thailand, including the Mlabri, Htin and neighboring populations of the Northern Highlands, speaking Austro-Asiatic, Tai-Kadai and Hmong-Mien languages. The Mlabri population showed higher LD and lower haplotype diversity when compared with its neighboring populations. Both model-free and Bayesian model-based clustering analyses indicated a close genetic relationship between the Mlabri and the Htin, a group speaking a Tin language.
Conclusion
Our results strongly suggested that the Mlabri share more recent common ancestry with the Htin. We thus provided, to our knowledge, the first genetic evidence that supports the linguistic affinity of Mlabri, and this association between linguistic and genetic classifications could reflect the same past population processes.
Background
The Mlabri are a hill tribe in northern Thailand, inhabiting a dispersed area along the border with Laos [1,2]. Today, they are a small population of nomadic hunter-gatherers, unusual in a region of almost entirely agricultural economies [3]. The modern population size is estimated at around 300 individuals, with some estimates being as low as 100 [4]. The name Mlabri is a Thai/Lao alteration of the word Mrabri, which appears to derive from a Khmuic term for "people of the forest" - in Khmu, mra means "person" and bri "forest". They are also known locally as Phi Tong Luang or "spirits of the yellow leaves", apparently because they abandon their shelters when the leaves begin to turn yellow with the onset of the dry season.
Little is known about the origins of the Mlabri and most evidence comes from linguistic studies. The Mlabri language is classified as a Khmuic language, a subgroup of the Mon-Khmer language in the Austro-Asiatic language family [5]. The available linguistic evidence suggests that the present-day Mlabri language most likely arose from Tin, a Khmuic language [2,6]. However, so far there is no genetic evidence supporting this idea. A recent study suggested Mlabri was founded recently from an agricultural group, thus representing a typical example of cultural reversion [7]. This work, although very interesting, was criticized for not including any of populations neighboring the Mlabri, such as the Htin, Hmong, and northern Thai. As a result, these authors were unable to demonstrate any similarities in the genetic and linguistic affinity of the Mlabri, and so made little comment on the possible source population(s) from which the Mlabri originated [8].
In this study, we analyzed populations samples from throughout northern Thailand, including the Mlabri as well as several neighboring groups, including the Htin, Hmong, Yao, and other populations speaking Austro-Asiatic and Tai-Kadai languages. Four HapMap population samples, representing Altaic, Sino-Tibetan, Indo-European and Niger-Congo language speakers, were also included in this study. We conducted a genome-wide analysis on these samples using 50K SNPs, to investigate the genetic affinity of the Mlabri, examine the concordance of genetic and linguistic affinities, and further explore probable origin(s) of this enigmatic hunter-gatherer group.
Results
Genetic Characteristics of Mlabri
Since this is the first genome-wide genetic study of this enigmatic population, we calculated several population genetic parameters, including SNP diversity, haplotype diversity and linkage disequilibrium (LD).
Reduced genetic diversity in the Mlabri
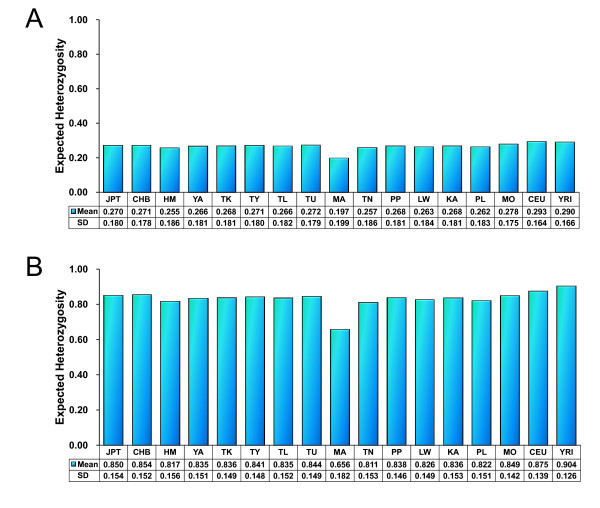
Expected heterozygosity for SNPs (HSe) were calculated based on allele frequencies of 55,561 SNPs and the results were shown in Figure 1A. The HSe in Mlabri (0.197) is lower than that of any of other populations in which HSe is at least 0.250 (HM). The expected heterozygosity for haplotypes (HHe) were calculated based on haplotypes in 500-kb genomic regions (Methods) and the results are shown in Figure 1B. The HHe in Mlabri (0.666) is also much lower than that of any of other populations in which HHe is at least 0.820 (TN). The HHe comparison obtained from larger size of genomic regions (1 Mb) show the similar results (see Additional file 1, Figure S1). All the above comparisons are statistically significant (t-test, p < 10-5).
Figure 1.
Heterozygosity in 17 populations. In table at the bottom of each plot displayed the average and the standard deviation of He in each population sample. The sample information of each population is shown in Table 1. A: He were calculated from 55,561 SNPs shared by 17 populations. SD denotes standard deviation of the He values across 55,561 SNPs. B: He were calculated from haplotypes of 500 kb windows, SD denotes standard deviation of the He values across windows.
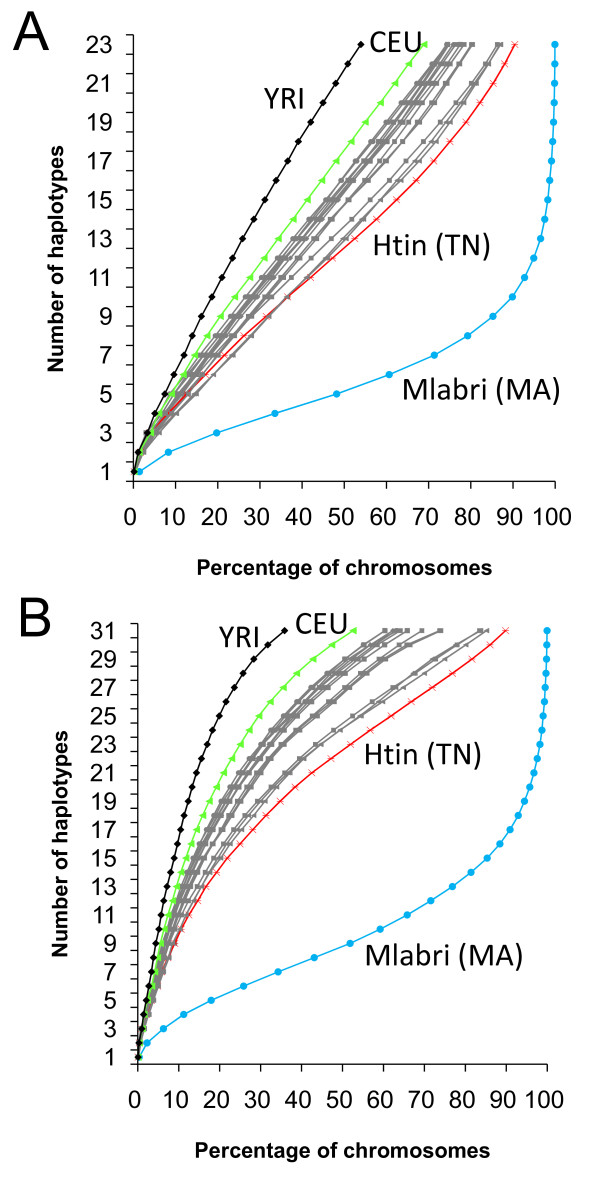
We also compared genetic diversity among populations using the cumulative proportion of the genome given the number of haplotypes (see Methods). The number of haplotypes was estimated for two different window sizes (500-kb or 1-Mb) respectively, with adjustment for sample size difference among populations (see Methods). Again, we found that the genetic diversity was significantly lower in Mlabri than in other populations for both 500-kb segments (Figure 2A) and 1-Mb segments (Figure 2B), respectively. For example, in Mlabri, 99% of the 500 kb segments across the genome carry 17 or less haplotypes in Mlabri, and it is much larger than those in other East Asian populations (52% ~68%), CEU (48%), and YRI (20%).
Figure 2.
Number of haplotypes and their cumulative proportion. (A) The number of haplotypes and their cumulative proportion in the genome for 500-Kb sliding windows. (B) The number of haplotypes and their cumulative proportion in the genome for 1-Mb sliding windows.
Increased linkage disequilibrium in the Mlabri
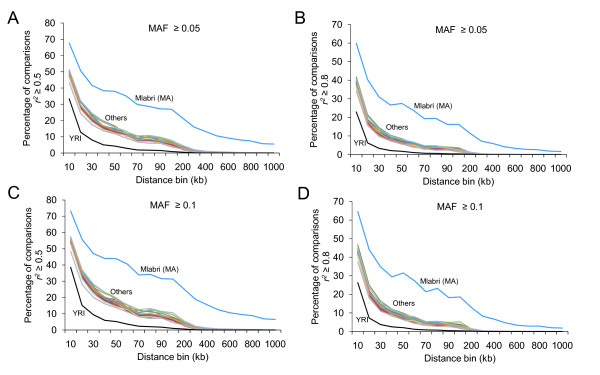
The significantly reduced genetic diversity in Mlabri was also reflected by its extent of linkage disequilibrium (LD). We assessed the extent of LD among markers with minor allele frequency (MAF) ≥ 0.05 (Figure 3A, B) and ≥ 0.1 (Figure 3C, D). The LD extended substantially longer in Mlabri than all the other populations, measured as the fraction of SNP pairs with r2 ≥ 0.5 (Figure 3A, C) or r2 ≥ 0.8 (Figure 3B, D). For marker pairs with moderate LD (r2 ≥ 0.5), we observed this fraction to be 1.6- to 12.3-fold higher in Mlabri than in all the other Asian populations for the distance range above 10-kb to 200-kb. For those marker pairs with strong LD (r2 ≥ 0.8), the fraction in Mlabri is 2.2- to 31.3-fold higher in Mlabri than in all the other Asian populations, and 6- to 259-fold higher than in YRI. Furthermore, LD of r2 ≥ 0.8 extended more than 1 Mb in Mlabri, whereas in all the other populations, such strong LD extended only up to 200 kb.
Figure 3.
Decay of linkage disequilibrium (LD) over distance. LD was measured by pairwise comparison (A&C, r2 ≥ 0.5; B&D, r2 ≥ 0.8) between markers that had minor allele frequency ≥ 0.05 (A, B), ≥ 0.1 (C, D) and that fell into the same intermarker distance bin. Blue lines denote Mlabri, black lines denote YRI, others include the rest 15 population samples.
Genetic Affinity of Mlabri
The genetic characteristics obtained from above analysis, such as significantly increased LD and extremely reduced haplotype diversity are both consistent with the view from a previous study [7] that the Mlabri were recently founded from a very small number of individuals. The available linguistic evidence suggests that the present-day Mlabri language arose from a Khmuic language, most likely Tin [2,6,7]. To search for the group that gave rise to the founders of Mlabri and to examine if the genetic affinity is consistent with linguistic affinity, we further investigated the genetic relationship of Mlabri and other populations. The rational is that the group with closest genetic relationship with Mlabri, if also consists with linguistic relationship, is most likely the genetic and linguistic founder source.
Individual-based clustering analysis
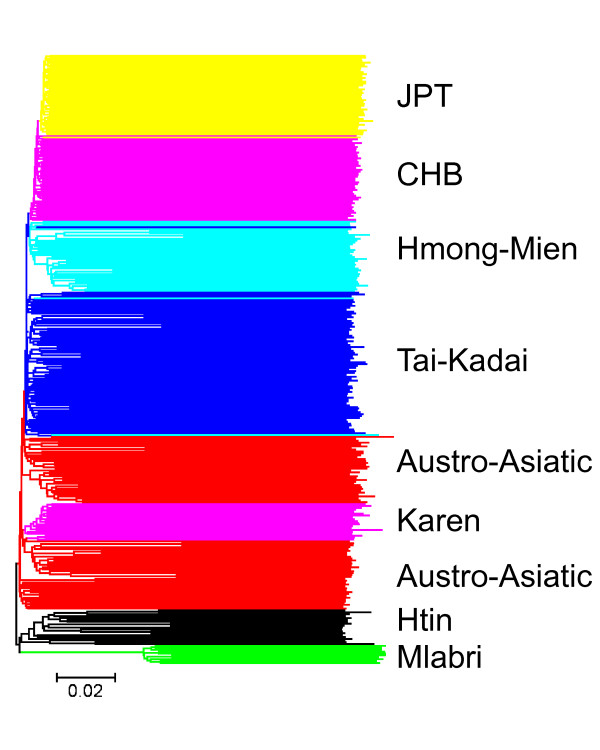
We first studied the clustering relationships among 446 individuals representing 13 populations in Thailand and the CHB and JPT from the HapMap project (YRI and CEU samples were not included in this analysis). We used an allele sharing distance (ASD) [9] as the genetic distance between individuals and reconstructed an individual tree (Figure 4) using the Neighbor-Joining algorithm [10]. There are several clear clusters on the tree which coincide with individual linguistic or ethnic affiliations, for example, as denoted in Figure 4, JPT, CHB, Hmong-Mien, Tai-Kadai, Austro-Asiatic, Htin and Mlabri. Notably, all the Mlabri and Htin individuals cluster together tightly (100 per cent bootstrap) although there is a bifurcation between clusters of Mlabri and Htin, indicating that the Mlabri have a closer relationship with the Htin than any of other populations studied.
Figure 4.
Relationships among 446 individuals reconstructed using Neighbor-Joining method on a matrix of allele sharing distances (ASDs). Pairwise ASD was calculated using 55,561 autosomal SNPs. Individuals are shaded by different colors according to their ethnic or linguistic affiliations.
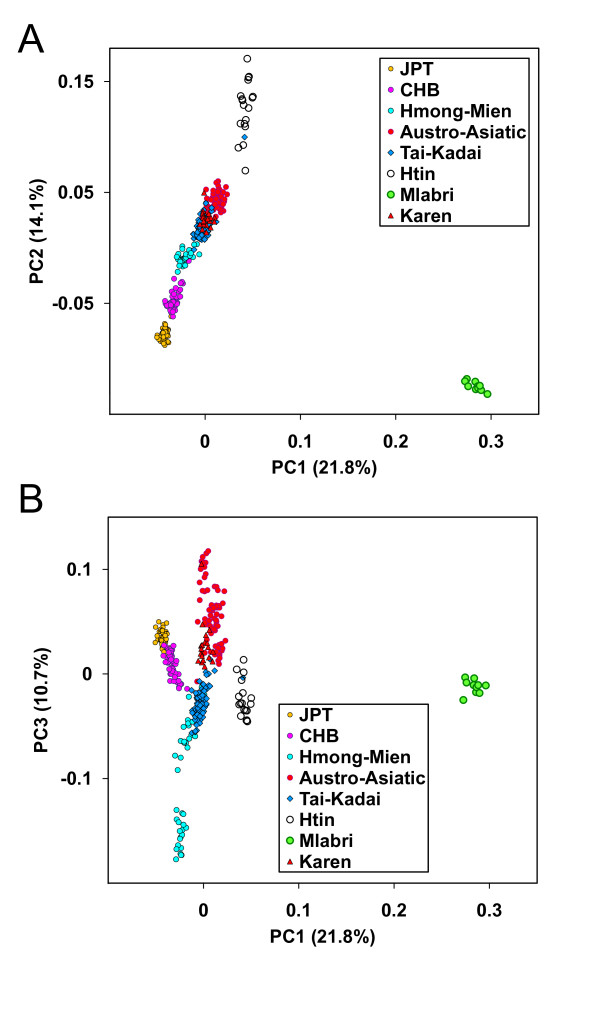
The above clustering relationships among individuals were also confirmed by principal components analysis (PCA) at the individual level [11]. As shown in a 2-dimentional plot of first two PCs (Figure 5A), individuals tend to cluster with other members of their linguistic or ethnic affiliations. Again, Mlabri showed a closer relationship with the Htin for PC1, which explains 21.8% of variation represented by the first ten PCs. The closer relationship between Mlabri and Htin is even more pronounced in the 2-dimentional plot of PC1 and PC3 (Figure 5B).
Figure 5.
Plot of Principal Components for 446 individuals representing 15 populations. Individuals are shaded by different colors according to their predefined population affiliations, and the legend is displayed on the lower right of the plot. A: plot of the first two principle components. B: plot of the first and the third principle components.
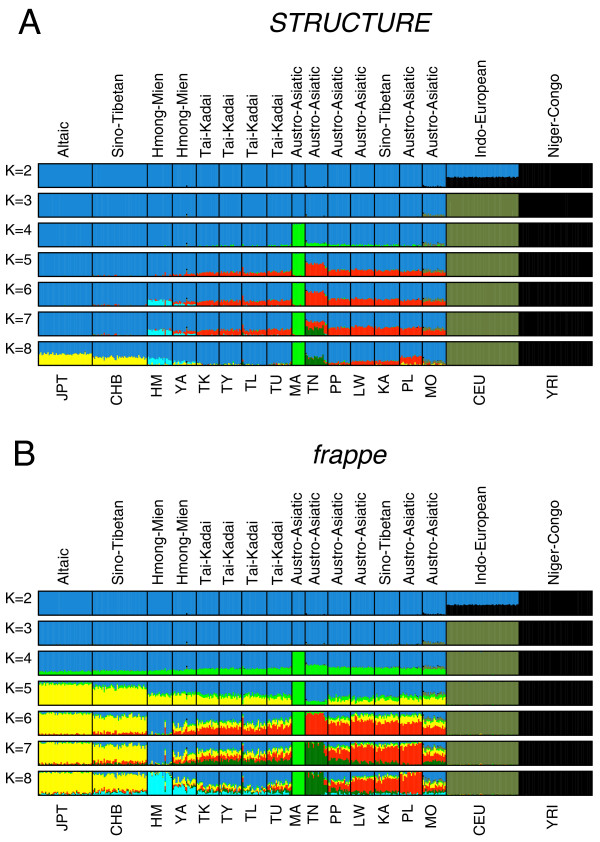
Since the closer relationship between Mlabri and Htin could be due to recent gene flow from Htin to Mlabri or vice versa, we further performed Bayesian cluster analysis as implemented in the STRUCTURE algorithm [12] to examine the ancestry of each person. This analysis considers each person's genome as having originated from K ancestral, but unobserved, populations whose contributions are described by K coefficients that sum to 1 for each individual [13]. Individuals are posited to derive from an arbitrary number of ancestral populations, denoted by K. We ran STRUCTURE from K = 2 to K = 18, with results at K = 8 showing the greatest posterior probability (see Additional file 2, Figure S2). Estimated individual membership fractions in K genetic clusters are shown in Figure 6A. At K = 3, the three clusters correspond with Asian, European and African ancestry, respectively. At K = 4, the new cluster corresponds to a Mlabri specific component, which is exclusively shared by all Mlabri individuals with 100 percent membership fractions and this pattern persisted for all choices of K>3. Similar analyses were also performed using the program frappe [14] which implements a maximum likelihood method. The results obtained from frappe (Figure 6B) showed a general concordance with that of STRUCTURE; but slight differences were also observed, such as the order with which new clusters emerge at K = 5 and K = 6, and the estimated individual membership fractions for all K>3. Notably, both analyses showed that all Asian populations shared some proportion of the major Mlabri component at K = 4 and K = 5. However, this sharing pattern, unless it is an artifact, is more likely to be explained by shared common ancestry rather than recent gene flow, because it appears highly unlikely that the Mlabri received (or contributed) nearly identical amounts of gene flow from (or to) all Asian populations, and with similar proportions, in every instance. Therefore, the close relationship between Mlabri and Htin is most likely the result of a considerable degree of common ancestry.
Figure 6.
Estimated population structure. Each colored vertical line represents an individual that is assigned proportionally to one of the K clusters with the proportions represented by the relative lengths of the K different colors. Black lines separate individuals of different populations. Populations are labeled below the figure with the same convention shown in Table 1 and Figure 1. Left plot: population structure inferred by STRUCTURE; right plot: population structure inferred by frappe. For both STRUCTURE and frappe results, the figure shown for a given K is based on the highest probability run of ten runs at that K.
Population- and component-based clustering analyses
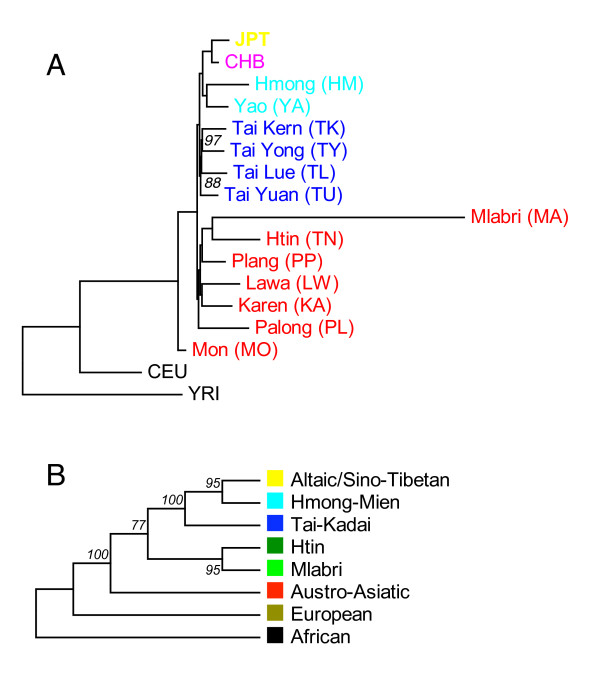
Because the analyses discussed above were all consistent in showing that individuals from the same population cluster together, it is meaningful to evaluate the genetic relationships among populations. A maximum likelihood tree of populations [15], based on 55,561 SNPs showed that Mlabri (MA) and Htin (TN) have the closest relationship, and this topology was supported by 100% of bootstrap replicates (Figure 7A).
Figure 7.
Maximum likelihood tree of populations and components. A: Maximum likelihood tree of 17 populations, bootstrap values obtained by sampling 55,561 SNPs 100 times with replacements, only values less than 100 are shown. Colored population names (IDs) help recognize their linguistic affinities, yellow: Altaic, magenta: Sino-Tibetan, light-blue: Tai-Kadai, red: Austro-Asiatic. B: Maximum likelihood tree of components inferred from STRUCTURE analysis (K = 8) Bootstrap values for B was obtained by randomly sampling cluster frequencies 100 times from STRUCTURE results.
However, the Htin showed signs of admixture in both STRUCTURE and frappe analyses (Figure 6A, B). This raised the concern that whether the close relationship between Mlabri and Htin was confounded by external immigrants from other populations, given that about half of components of Htin are also found in both Austro-Asiatic and Tai-Kadai populations at Ks>4 in STRUCTURE results (Figure 6A). We thus further investigated this potential confounding effect by reconstructing the phylogenetic relationships of those clusters inferred from STRUCTURE and frappe (referred to as the "component tree"). The rationale is that the component tree, given the statistical independence of the components, should reveal an evolutionary history that is less perturbed by recent gene flow and admixture than is a population phylogeny. At K = 8, both STRUCTURE and frappe identified a cluster predominant in the Htin, and with each of the other seven clusters easily associated with a predominant linguistic or ethnic group. We therefore refer to the eight clusters (or components) by their representative linguistic or ethnic group as follows: Altaic/Sino-Tibetan, Hmong-Mien, Tai-Kadai, Austro-Asiatic, Mlabri, Htin, European and African. The component tree was reconstructed based on allele frequencies in each cluster inferred from the STRUCTURE analysis (Figure 7B). We found that the Mlabri specific and Htin specific component clustered tightly on the tree (supported by 100% of bootstrap replicates), strongly indicating once again that the Mlabri share a more recent ancestry with the Htin than with any other group in our sample.
Discussion
In this study, we analyzed genome-wide SNP data on the Mlabri, as well as several neighboring populations and HapMap population samples. The Mlabri population shows several substantial differences from the other populations: significantly increased LD, extremely reduced haplotype diversity and small effective population size (29), all of which are consistent with the view that the Mlabri were recently founded from a very small number of individuals of an agricultural group but subsequently adopted their current hunting-gathering lifestyle, as proposed by a recent study based primarily on mtDNA and Y chromosome data [7]. Although an alternative scenario could also explain the above genetic characteristics of Mlabri, i.e. the Mlabri are an ancient hunter-gatherer group and maintain their hunting-gathering lifestyle from the very beginning but experienced a severe bottleneck event in the history, the results from the clustering analyses do not favor this scenario. If the Mlabri are an ancient hunter-gatherer group, we expect Mlabri is outside of the clade of all Asian populations and close to the root of Asian clade, but Mlabri is actually inside of Asian clade with Austro-Asiatic group outside on both population tree (Figure 7A) and component trees (Figure 7B, C) where no signal of admixture was found have disturbed tree topology.
Both model-free and model-based clustering analyses strongly suggest that the Mlabri share a degree of common ancestry with the Htin, a group speaking Tin language. In this case -- as is the general rule in many human populations -- the genetic affinity of these populations is consistent with its linguistic affinity. This result, to our knowledge, is the first genetic evidence supporting the linguistic affinity of the Mlabri and Tin languages. Cavalli-Sforza and colleagues showed an apparent congruence between linguistic phyla and genetic clusters, and they proposed that this congruence indicates "considerable parallelism between genetic and linguistic evolution" [16]. Subsequent studies using diverse scales and methodologies have found variable degrees of association between linguistic and genetic classifications [17-22]. Some typical examples of exceptions are populations with language replacement [23-26] or recent admixture between divergent populations [27,28]. However, human genetic and linguistic diversity have been proposed to be generally correlated, either through a direct link, whereby linguistic and genetic affiliations reflect the same past population processes, or an indirect one, where the evolution of the two types of diversity is independent but conditioned by the same geographic factors [29].
Hunting and gathering was presumably the subsistence strategy employed by human societies for more than two million years, until the end of the Mesolithic period. Contemporary hunter-gatherer groups are often thought to serve as models of an ancient lifestyle that was typical of human populations prior to the development of agriculture. However, there has been complex interaction between hunter-gatherers and non-hunter-gatherers for millennia. There are contemporary hunter-gatherer peoples who, after contact with other societies, continue their ways of life with very little external influence. There are also contemporary groups usually identified as hunter-gatherers do not have a continuous history of hunting and gathering, and in many cases their ancestors were agriculturalists and/or pastoralists who were pushed into marginal areas as a result of migrations, economic exploitation, and/or violent conflict [30]. Our current data are not sufficient to distinguish the two scenarios, but in case cultural reversion occurred in the history of Mlabri, the Htin is most likely the source population from which the Mlabri genetically originated. The Htin samples in this study speak Mal language, represent only one of the two varieties (Mal and Prai) of Tin language [31,32], it is possible to further determine which variety the Mlabri language originated from by comparing the genetic relationships between the Mlabri and populations speak the two Tin varieties, although such evidence is indirect and would only make sense when the assumption hold that the genetic origin of the Mlabri was not earlier than the divergence of the two language varieties and there was no language replacement.
Conclusions
In summary, our results strongly suggested that the Mlabri share more recent common ancestry with the Htin, a group speaking a Tin language. This result, to our knowledge, is the first genetic evidence supporting the linguistic affinity of the Mlabri and Tin languages. We proposed that Htin is most likely the source population from which the Mlabri genetically originated in case cultural reversion occurred in the history of Mlabri.
Methods
Populations and Samples
Samples from the Mlabri as well as other 12 populations were collected in Thailand. The sample information, including sample size, ethnic and linguistic information is shown in Table 1, and the sampling locations are shown in Additional file 3, Figure S3. These samples were also described previously [33]. In this study, eight Mlabri samples were not included because they were identified as close relatives (IBD > 0.2) of one of the rest samples. Four population samples (60 YRI, Yoruba from Ibadan, Nigeria; 60 CEU, Utah residents with ancestry from northern and western Europe; 45 CHB, Han Chinese in Beijing; and 44 JPT, Japanese in Tokyo) obtained from the database of the International HapMap Project [34] were also included in this study.
Table 1.
Information of population samples.
| Population ID | Ethnicity | Language family | Language | Sample-size |
|---|---|---|---|---|
| JPT | Japanese | Altaic | Japanese | 44 |
| CHB | Han | Sino-Tibetan | Chinese | 45 |
| HM | Hmong | Hmong-Mien | Hmong | 20 |
| YA | Yao | Hmong-Mien | Iu-Mien | 19 |
| TL | Tai Lue | Tai-Kadai | Lue | 20 |
| TY | Tai Yong | Tai-Kadai | Yong | 18 |
| TK | Tai Kern | Tai-Kadai | Kern | 18 |
| TU | Tai Yuan | Tai-Kadai | Yuan | 20 |
| PL | Palong | Austro-Asiatic | Palong | 18 |
| KA | Karen | Sino-Tibetan | Karen | 20 |
| LW | Lawa | Austro-Asiatic | Lawa | 19 |
| PP | Plang | Austro-Asiatic | Blang | 18 |
| TN | Htin | Austro-Asiatic | Mal | 18 |
| MA | Mlabri | Austro-Asiatic | Mlabri | 18 |
| MO | Mon | Austro-Asiatic | Mon | 19 |
| CEU | European | Indo-European | English | 60 |
| YRI | Yoruba | Niger-Congo | Yoruba | 60 |
Data Sets
Genotype data of 13 Thailand population samples generated using Affymetrix Genechip Human Mapping 50K Xba array were obtained from the Pan-Asian SNP Initiative [33]. Detailed information about data filtration and data quality control was described elsewhere [33]. Genotypes of 60 YRI, 60 CEU, 45 CHB and 44 JPT samples were obtained from the International HapMap Project [34-36] (HapMap public released #23a, 2008-04-01). Most of the analyses in this study used the markers that genotyped in both PanAsia project and HapMap project, including 55,561 autosomal SNPs shared by 13 Thailand population samples and 4 HapMap population samples.
Statistical analysis
Haplotype inference
Haplotypes of 22 autosomes were inferred for each individual from its genotypes with fastPHASE [37] version 1.2. "Population labels" were applied during the model fitting procedure to enhance accuracy. The number of haplotype clusters was set to 20, the number of random starts of the EM algorithm (-T) was set to 20, and the number of iterations of EM algorithm (-C) was set to 50. This analysis was used to generate a "best guess" estimate of the true underlying patterns of haplotype structure [37]. We run fastPHASE for 55,561 SNPs shared by 17 populations, and only unrelated individuals were included.
SNP heterozygosity
Heterozygosity for each SNP (HSe) was calculated based on allele frequencies.
Haplotype heterozygosity
To calculate heterozygosity for haplotypes (HHe), the genome was divided into 500-kb regions, with each region having roughly 14 SNPs. HHe were calculated for each region using haplotype frequencies [38]. Considering the substantial variation of recombination across human genome [39,40], we adopted a slide window strategy and let the sliding window move 100 kb each time. For each population, HHe were averaged over all windows.
Number of haplotypes and its cumulative proportion of the genome
The number of haplotypes was obtained by counting the number of haplotypes for a given window size, i.e. 500-kb or 1-Mb, respectively, for each population. The same sliding-window scheme as mentioned before was employed. Since this measurement could be affected by sample size, we sampled 36 chromosomes (equal to the sample size of Mlabri) without replacement in each population. Note that Mlabri has the smallest sample size in all the populations studied. For a population with sample size larger than 36 chromosomes, the sampling was repeated 100 times for each segment and the average of the number of haplotypes of all replications was taken as the number of haplotypes.
The cumulative proportion given a number of haplotypes was obtained by estimating the proportion of the sliding-windows across the genome carrying equal or less haplotypes.
LD calculation
Linkage disequilibrium (LD) between SNPs were measured using r2 following Hill and Weir [41] and calculated from haplotype data.
Principal component analysis for individuals
Principal component analysis (PCA) was performed at individual level using EIGENSOFT version 2.0 [42].
Genetic distance for individuals
We used an allele sharing distance (ASD) [9,43] as a measure of genetic distance between individuals and a 454 × 454 inter-individual genetic distance matrix was generated according to genotypes of 55,561 autosomal SNPs.
Tree reconstruction
The tree of individuals was reconstructed based on ASD distance and using Neighbor-Joining algorithm [10] with the Molecular Evolutionary Genetics Analysis software package (MEGA version 4.0) [44]. Trees of populations as well as components were reconstructed using maximum likelihood method [15] with CONTML program in PHYLIP package [45].
STRUCTURE analysis
Ancestry of each person was inferred using a Bayesian cluster analysis as implemented in the STRUCTURE program [12,46]. We ran STRUCTURE from K = 2 to K = 18 and repeated 10 times for each single K. All STRUCTURE runs used 20,000 iterations after a burn-in of length 30,000, with the admixture model and assuming that allele frequencies were correlated [46].
frappe analysis
The program frappe [14] implements a maximum likelihood method to infer genetic ancestry of each individual. As in STRUCTURE analysis, this analysis considers each person's genome as having originated from K ancestral, but unobserved, populations whose contributions are described by K coefficients that sum to 1 for each individual [13]. The program was run for 10,000 iterations from K = 2 to 18 and repeated 10 times for each single K.
Authors' contributions
SX, DK, MS, and LJ conceived and designed the study. JK contributed to the Tai-Kadai sample collection. MS and MS performed the technical work on SNP genotyping and QC procedures for all population samples from Thailand. SX collected data and performed the analysis. SX and LJ wrote the paper, to which all authors contributed. All authors read and approved the final manuscript.
Supplementary Material
Contains Figure S1 - Haplotype heterozygosity (HHe) in 17 populations. In table at the bottom of each plot displayed the average and the standard deviation of HHe in each population sample. The sample information of each population is shown in Table 1. HHe were calculated from haplotypes of 1-Mb windows, SD denotes standard deviation of the HHe values across windows.
Contains Figure S3 - Probability Estimations for the Number of Clusters, with Ten Repeats for Each K. The ordinate shows the Ln probability corresponding to the number of clusters (K) shown on the abscissa. A: showing maximal probability estimation of ten runs at each K (from K = 2 to K = 9); B: showing probability estimation at K = 2 to K = 18 in all ten runs.
Contains Figure S2 - Geographical distribution of Thailand population samples. Red dots on the map indicated sampling locations. Information of population IDs can be found in Table 1.
Contributor Information
Shuhua Xu, Email: xushua@picb.ac.cn.
Daoroong Kangwanpong, Email: scidkngw@chiangmai.ac.th.
Mark Seielstad, Email: seielstadm@gis.a-star.edu.sg.
Metawee Srikummool, Email: may_m_may@hotmail.com.
Jatupol Kampuansai, Email: jatupol_k@hotmail.com.
Li Jin, Email: ljin007@gmail.com.
The HUGO Pan-Asian SNP Consortium*, Email: pasnp@biomaillist.org.
Acknowledgements
We thank Dr. Mark Stoneking for his helpful discussion. This work was supported by grants from the National Outstanding Youth Science Foundation of China (30625016), National Science Foundation of China (30890034, 30971577), and 863 Program (2007AA02Z312). LJ was also supported by Shanghai Leading Academic Discipline Project (B111) and the Center for Evolutionary Biology. SX was also supported by Science and Technology Commission of Shanghai Municipality (09ZR1436400) and the Knowledge Innovation Program of Shanghai Institutes for Biological Sciences, Chinese Academy of Sciences (2008KIP311). SX gratefully acknowledges the support of SA-SIBS Scholarship Program and K.C. Wong Education Foundation, Hong Kong. The participants of the HUGO Pan-Asian SNP Consortium are arranged by surname alphabetically in the following.
Mahmood Ameen Abdulla,1 Ikhlak Ahmed,2 Anunchai Assawamakin,3,4 Jong Bhak,5 Samir K. Brahmachari,2 Gayvelline C. Calacal,6 Amit Chaurasia,2 Chien-Hsiun Chen,7 Jieming Chen,8 Yuan-Tsong Chen,7 Jiayou Chu,9 Eva Maria C. Cutiongco-de la Paz,10 Maria Corazon A. De Ungria,6 Frederick C. Delfin,6 Juli Edo,1 Suthat Fuchareon,3 Ho Ghang,5 Takashi Gojobori,11,12 Junsong Han,13 Sheng-Feng Ho,7 Boon Peng Hoh,14 Wei Huang,15 Hidetoshi Inoko,16 Pankaj Jha,2 Timothy A. Jinam,1 Li Jin,17,38 Jongsun Jung,18 Daoroong Kangwanpong,19 Jatupol Kampuansai,19 Giulia C. Kennedy,20,21 Preeti Khurana,22 Hyung-Lae Kim,18 Kwangjoong Kim,18 Sangsoo Kim,23 Woo-Yeon Kim,5 Kuchan Kimm,24 Ryosuke Kimura,25 Tomohiro Koike,11 Supasak Kulawonganunchai,4 Vikrant Kumar,8 Poh San Lai,26,27 Jong-Young Lee,18 Sunghoon Lee,5 Edison T. Liu,8 Partha P. Majumder,28 Kiran Kumar Mandapati,22 Sangkot Marzuki,29 Wayne Mitchell,30,31 Mitali Mukerji,2 Kenji Naritomi,32 Chumpol Ngamphiw,4 Norio Niikawa,40 Nao Nishida,25 Bermseok Oh,18 Sangho Oh,5 Jun Ohashi,25 Akira Oka,16 Rick Ong,8 Carmencita D. Padilla,10 Prasit Palittapongarnpim,33 Henry B. Perdigon,6 Maude Elvira Phipps,1,34 Eileen Png,8 Yoshiyuki Sakaki,35 Jazelyn M. Salvador,6 Yuliana Sandraling,29 Vinod Scaria,2 Mark Seielstad,8 Mohd Ros Sidek,14 Amit Sinha,2 Metawee Srikummool,19 Herawati Sudoyo,29 Sumio Sugano,37 Helena Suryadi,29 Yoshiyuki Suzuki,11 Kristina A. Tabbada,6 Adrian Tan,8 Katsushi Tokunaga,25 Sissades Tongsima,4 Lilian P. Villamor,6 Eric Wang,20,21 Ying Wang,15 Haifeng Wang,15 Jer-Yuarn Wu,7 Huasheng Xiao,13 Shuhua Xu,38 Jin Ok Yang,5 Yin Yao Shugart,39 Hyang-Sook Yoo,5 Wentao Yuan,15 Guoping Zhao,15 Bin Alwi Zilfalil,14 Indian Genome Variation Consortium2
1Department of Molecular Medicine, Faculty of Medicine, and the Department of Anthropology, Faculty of Arts and Social Sciences, University of Malaya, Kuala Lumpur, 50603, Malaysia. 2Institute of Genomics and Integrative Biology, Council for Scientific and Industrial Research, Mall Road, Delhi 110007, India. 3Mahidol University, Salaya Campus, 25/25 M. 3, Puttamonthon 4 Road, Puttamonthon, Nakornpathom 73170, Thailand. 4Biostatistics and Informatics Laboratory, Genome Institute, National Center for Genetic Engineering and Biotechnology, Thailand Science Park, Pathumtani 12120, Thailand. 5Korean BioInformation Center (KOBIC), Korea Research Institute of Bioscience and Biotechnology (KRIBB), 111 Gwahangno, Yuseong-gu, Deajeon 305-806, Korea. 6DNA Analysis Laboratory, Natural Sciences Research Institute, University of the Philippines, Diliman, Quezon City 1101, Philippines. 7Institute of Biomedical Sciences, Academia Sinica, 128 Sec 2 Academia Road Nangang, Taipei City 115, Taiwan. 8Genome Institute of Singapore, 60 Biopolis Street 02-01, 138672, Singapore. 9Institute of Medical Biology, Chinese Academy of Medical Science, Kunming, China. 10Institute of Human Genetics, National Institutes of Health, University of the Philippines Manila, 625 Pedro Gil Street, Ermita Manila 1000, Philippines. 11Center for Information Biology and DNA Data Bank of Japan, National Institute of Genetics, Research Organization of Information and Systems, 1111 Yata, Mishima, Shizuoka 411-8540, Japan. 12Biomedicinal Information Research Center, National Institute of Advanced Industrial Science and Technology, 2-42 Aomi, Koto-ku, Tokyo 135-0064, Japan. 13National Engineering Center for Biochip at Shanghai, 151 Li Bing Road, Shanghai 201203, China. 14Human Genome Center, School of Medical Sciences, Universiti Sains Malaysia, 16150 Kubang Kerian, Kelantan, Malaysia. 15MOST-Shanghai Laboratory of Disease and Health Genomics, Chinese National Human Genome Center Shanghai, 250 Bi Bo Road, Shanghai 201203, China. 16Department of Molecular Life Science Division of Molecular Medical Science and Molecular Medicine, Tokai University School of Medicine, 143 Shimokasuya, Isehara-A Kanagawa-Pref A259-1193, Japan. 17State Key Laboratory of Genetic Engineering and MOE Key Laboratory of Contemporary Anthropology, School of Life Sciences, Fudan University, 220 Handan Road, Shanghai 200433, China. 18Korea National Institute of Health, 194, Tongil-Lo, Eunpyung-Gu, Seoul, 122-701, Korea. 19Department of Biology, Faculty of Science, Chiang Mai University, 239 Huay Kaew Road, Chiang Mai 50202, Thailand. 20Genomics Collaborations, Affymetrix, 3420 Central Expressway, Santa Clara, CA 95051, USA. 21Veracyte, 7000 Shoreline Court, Suite 250, South San Francisco, CA 94080, USA. 22The Centre for Genomic Applications (an IGIB-IMM Collaboration), 254 Ground Floor, Phase III Okhla Industrial Estate, New Delhi 110020, India. 23Soongsil University, Sangdo-5-dong 1-1, Dongjak-gu, Seoul 156-743, Korea. 24Eulji University College of Medicine, 143-5 Yong-du-dong Jung-gu, Dae-jeon City 301-832, Korea. 25Department of Human Genetics, Graduate School of Medicine, University of Tokyo, 7-3-1 Hongo, Bunkyo-ku, Tokyo 113-0033, Japan. 26Department of Paediatrics, Yong Loo Lin School of Medicine, National University of Singapore, National University Hospital, 5 Lower Kent Ridge Road, 119074, Singapore. 27Population Genetics Lab, Defence Medical and Environmental Research Institute, DSO National Laboratories, 27 Medical Drive, 117510, Singapore. 28Indian Statistical Institute (Kolkata) 203 Barrackpore Trunk Road, Kolkata 700108, India. 29Eijkman Institute for Molecular Biology, Jl. Diponegoro 69, Jakarta 10430, Indonesia. 30Informatics Experimental Therapeutic Centre, 31 Biopolis Way, 03-01 Nanos, 138669, Singapore. 31Division of Information Sciences, School of Computer Engineering, Nanyang Technological University, 50 Nanyang Avenue, 639798, Singapore. 32Department of Medical Genetics, University of the Ryukyus Faculty of Medicine, Nishihara, 207 Uehara, Okinawa 903-0215, Japan. 33National Science and Technology Development Agency, 111 Thailand Science Park, Pathumtani 12120, Thailand. 34Monash University (Sunway Campus), Jalan Lagoon Selatan, 46150 Bandar Sunway, Selangor, Malaysia. 35RIKEN Genomic Sciences Center, W502, 1-7-22 Suehiro-cho, Tsurumi-ku, Yokohama 230-0045, Japan. 36Department of Biochemistry, University of Hong Kong, 3/F Laboratory Block, Faculty of Medicine Building, 21 Sasson Road, Pokfulam, Hong Kong. 37Laboratory of Functional Genomics, Department of Medical Genome Sciences Graduate School of Frontier Sciences, University of Tokyo (Shirokanedai Laboratory), 4-6-1 Shirokanedai, Minato-ku, Tokyo 108-8639, Japan. 38Chinese Academy of Sciences-Max Planck Society Partner Institute for Computational Biology, Shanghai Institutes of Biological Sciences, Chinese Academy of Sciences, 320 Yueyang Rd., Shanghai 200031, China. 39Genomic Research Branch, National Institute of Mental Health, National Institutes of Health, 6001 Executive Boulevard, Bethesda, MD 20892 USA. 40Research Institute of Personalized Health Sciences, Health Sciences University of Hokkaido, Tobetsu 061-0293, Japan.
References
- Pookajorn S. The Phi Tong Luang (Mlabri): A hunter-gatherer group in Thailand. Bangkok: Odeon Store Printing House; 1992. [Google Scholar]
- Rischel J Minor Mlabri, a hunter-gatherer language of northern Indochina 1995Copenhagen: Museum Tusculanum; 7589493 [Google Scholar]
- Schliesinger J. Ethnic Groups of Laos. Vol. 2. Bangkok: White Lotus Press; 2003. [Google Scholar]
- Wikipedia_contributors. 'Mlabri people', Wikipedia, The Free Encyclopedia. 2009. http://en.wikipedia.org/wiki/Mlabri_people
- Wikipedia_contributors. 'Mlabri language', Wikipedia, The Free Encyclopedia. 2009. http://en.wikipedia.org/wiki/Mlabri_language
- Rischel J. The role of a mixed language in linguistic reconstruction. Proceedings of the twelfth international congress of linguists. Prague: Matfyz Press; 2003. [Google Scholar]
- Oota H, Pakendorf B, Weiss G, von Haeseler A, Pookajorn S, Settheetham-Ishida W, Tiwawech D, Ishida T, Stoneking M. Recent origin and cultural reversion of a hunter-gatherer group. PLoS Biol. 2005;3(3):e71. doi: 10.1371/journal.pbio.0030071. [DOI] [PMC free article] [PubMed] [Google Scholar]
- Waters T. Comment on "Recent origin and cultural reversion of a hunter-gatherer group". PLoS Biol. 2005;3(8):e269. doi: 10.1371/journal.pbio.0030269. author reply e270. [DOI] [PMC free article] [PubMed] [Google Scholar]
- Mountain JL, Cavalli-Sforza LL. Multilocus genotypes, a tree of individuals, and human evolutionary history. Am J Hum Genet. 1997;61(3):705–718. doi: 10.1086/515510. [DOI] [PMC free article] [PubMed] [Google Scholar]
- Saitou N, Nei M. The neighbor-joining method: a new method for reconstructing phylogenetic trees. Mol Biol Evol. 1987;4(4):406–425. doi: 10.1093/oxfordjournals.molbev.a040454. [DOI] [PubMed] [Google Scholar]
- Patterson N, Price AL, Reich D. Population structure and eigenanalysis. PLoS Genet. 2006;2(12):e190. doi: 10.1371/journal.pgen.0020190. [DOI] [PMC free article] [PubMed] [Google Scholar]
- Pritchard JK, Stephens M, Donnelly P. Inference of population structure using multilocus genotype data. Genetics. 2000;155(2):945–959. doi: 10.1093/genetics/155.2.945. [DOI] [PMC free article] [PubMed] [Google Scholar]
- Li JZ, Absher DM, Tang H, Southwick AM, Casto AM, Ramachandran S, Cann HM, Barsh GS, Feldman M, Cavalli-Sforza LL. Worldwide human relationships inferred from genome-wide patterns of variation. Science. 2008;319(5866):1100–1104. doi: 10.1126/science.1153717. [DOI] [PubMed] [Google Scholar]
- Tang H, Peng J, Wang P, Risch NJ. Estimation of individual admixture: analytical and study design considerations. Genet Epidemiol. 2005;28(4):289–301. doi: 10.1002/gepi.20064. [DOI] [PubMed] [Google Scholar]
- Felsenstein J. Maximum-likelihood estimation of evolutionary trees from continuous characters. Am J Hum Genet. 1973;25(5):471–492. [PMC free article] [PubMed] [Google Scholar]
- Cavalli-Sforza LL, Piazza A, Menozzi P, Mountain J. Reconstruction of human evolution: bringing together genetic, archaeological, and linguistic data. Proc Natl Acad Sci USA. 1988;85(16):6002–6006. doi: 10.1073/pnas.85.16.6002. [DOI] [PMC free article] [PubMed] [Google Scholar]
- Barbujani G, Sokal RR. Zones of sharp genetic change in Europe are also linguistic boundaries. Proc Natl Acad Sci USA. 1990;87:1816–1819. doi: 10.1073/pnas.87.5.1816. [DOI] [PMC free article] [PubMed] [Google Scholar]
- Excoffier L, Harding RM, Sokal RR, Pellegrini B, Sanchez-Mazas A. Spatial differentiation of RH and GM haplotype frequencies in Sub-Saharan Africa and its relation to linguistic affinities. Hum Biol. 1991;63(3):273–307. [PubMed] [Google Scholar]
- Barbujani G, Pilastro A. Genetic evidence on origin and dispersal of human populations speaking languages of the Nostratic macrofamily. Proc Natl Acad Sci USA. 1993;90(10):4670–4673. doi: 10.1073/pnas.90.10.4670. [DOI] [PMC free article] [PubMed] [Google Scholar]
- Sajantila A, Lahermo P, Anttinen T, Lukka M, Sistonen P, Savontaus ML, Aula P, Beckman L, Tranebjaerg L, Gedde-Dahl T. Genes and languages in Europe: an analysis of mitochondrial lineages. Genome Res. 1995;5(1):42–52. doi: 10.1101/gr.5.1.42. [DOI] [PubMed] [Google Scholar]
- Sokal RR. Genetic, geographic and linguistic distances in Europe. Proc Natl Acad Sci USA. 1988;85:1722–1726. doi: 10.1073/pnas.85.5.1722. [DOI] [PMC free article] [PubMed] [Google Scholar]
- Dupanloup de Ceuninck I, Schneider S, Langaney A, Excoffier L. Inferring the impact of linguistic boundaries on population differentiation: application to the Afro-Asiatic-Indo-European case. Eur J Hum Genet. 2000;8(10):750–756. doi: 10.1038/sj.ejhg.5200519. [DOI] [PubMed] [Google Scholar]
- Sajantila A, Paabo S. Language replacement in Scandinavia. Nat Genet. 1995;11(4):359–360. doi: 10.1038/ng1295-359. [DOI] [PubMed] [Google Scholar]
- Reid L. In: Language Contact and Change in the Austronesian World. Dutton T, Tryon T, editor. Berlin: Mouton de Gruyter; 1994. Unravelling the linguistic histories of Phillippine Negritos; pp. 443–475. [Google Scholar]
- Barbujani G, Whitehead GN, Bertorelle G, Nasidze IS. Testing hypotheses on processes of genetic and linguistic change in the Caucasus. Hum Biol. 1994;66(5):843–864. [PubMed] [Google Scholar]
- Nasidze I, Sarkisian T, Kerimov A, Stoneking M. Testing hypotheses of language replacement in the Caucasus: evidence from the Y-chromosome. Hum Genet. 2003;112(3):255–261. doi: 10.1007/s00439-002-0874-4. [DOI] [PubMed] [Google Scholar]
- Xu S, Huang W, Qian J, Jin L. Analysis of genomic admixture in Uyghur and its implication in mapping strategy. Am J Hum Genet. 2008;82(4):883–894. doi: 10.1016/j.ajhg.2008.01.017. [DOI] [PMC free article] [PubMed] [Google Scholar]
- Xu S, Jin L. A Genome-wide Analysis of Admixture in Uyghurs and a High-Density Admixture Map for Disease-Gene Discovery. Am J Hum Genet. 2008;83(3):322–336. doi: 10.1016/j.ajhg.2008.08.001. [DOI] [PMC free article] [PubMed] [Google Scholar]
- Nettle D, Harriss L. Genetic and linguistic affinities between human populations in Eurasia and West Africa. Hum Biol. 2003;75(3):331–344. doi: 10.1353/hub.2003.0048. [DOI] [PubMed] [Google Scholar]
- Wikipedia_contributors. 'Hunter-gatherer', Wikipedia, The Free Encyclopedia. 2009. http://en.wikipedia.org/wiki/Hunter-gatherer
- Filbeck D. Tin, a historical study. Canberra: Australian National University; 1978. [Google Scholar]
- Filbeck D. New ethnic names for the Tin of Nan Province. J Siam Soc. 1987;75:129–138. [Google Scholar]
- The HUGO Pan-Asian SNP Consortium. Mapping human genetic diversity in Asia. Science. 2009;326(5959):1541–1545. doi: 10.1126/science.1177074. [DOI] [PubMed] [Google Scholar]
- The International HapMap Consortium. The International HapMap Project. Nature. 2003;426(6968):789–796. doi: 10.1038/nature02168. [DOI] [PubMed] [Google Scholar]
- Frazer KA, Ballinger DG, Cox DR, Hinds DA, Stuve LL, Gibbs RA, Belmont JW, Boudreau A, Hardenbol P, Leal SM. A second generation human haplotype map of over 3.1 million SNPs. Nature. 2007;449(7164):851–861. doi: 10.1038/nature06258. [DOI] [PMC free article] [PubMed] [Google Scholar]
- The International HapMap Consortium. A haplotype map of the human genome. Nature. 2005;437(7063):1299–1320. doi: 10.1038/nature04226. [DOI] [PMC free article] [PubMed] [Google Scholar]
- Scheet P, Stephens M. A fast and flexible statistical model for large-scale population genotype data: applications to inferring missing genotypes and haplotypic phase. Am J Hum Genet. 2006;78(4):629–644. doi: 10.1086/502802. [DOI] [PMC free article] [PubMed] [Google Scholar]
- Xu S, Jin W, Jin L. Haplotype-sharing analysis showing Uyghurs are unlikely genetic donors. Mol Biol Evol. 2009;26(10):2197–2206. doi: 10.1093/molbev/msp130. [DOI] [PubMed] [Google Scholar]
- McVean GA, Myers SR, Hunt S, Deloukas P, Bentley DR, Donnelly P. The fine-scale structure of recombination rate variation in the human genome. Science. 2004;304(5670):581–584. doi: 10.1126/science.1092500. [DOI] [PubMed] [Google Scholar]
- Myers S, Bottolo L, Freeman C, McVean G, Donnelly P. A fine-scale map of recombination rates and hotspots across the human genome. Science. 2005;310(5746):321–324. doi: 10.1126/science.1117196. [DOI] [PubMed] [Google Scholar]
- Hill WG, Weir BS. Maximum-likelihood estimation of gene location by linkage disequilibrium. Am J Hum Genet. 1994;54(4):705–714. [PMC free article] [PubMed] [Google Scholar]
- Price AL, Patterson NJ, Plenge RM, Weinblatt ME, Shadick NA, Reich D. Principal components analysis corrects for stratification in genome-wide association studies. Nat Genet. 2006;38(8):904–909. doi: 10.1038/ng1847. [DOI] [PubMed] [Google Scholar]
- Su B, Xiao J, Underhill P, Deka R, Zhang W, Akey J, Huang W, Shen D, Lu D, Luo J. Y-Chromosome evidence for a northward migration of modern humans into Eastern Asia during the last Ice Age. Am J Hum Genet. 1999;65(6):1718–1724. doi: 10.1086/302680. [DOI] [PMC free article] [PubMed] [Google Scholar]
- Kumar S, Tamura K, Nei M. MEGA3: Integrated software for Molecular Evolutionary Genetics Analysis and sequence alignment. Brief Bioinform. 2004;5(2):150–163. doi: 10.1093/bib/5.2.150. [DOI] [PubMed] [Google Scholar]
- Felsenstein J. PHYLIP--Phylogeny Inference Package (Version 3.2) Cladistics. 1989;5:164–166. [Google Scholar]
- Falush D, Stephens M, Pritchard JK. Inference of population structure using multilocus genotype data: linked loci and correlated allele frequencies. Genetics. 2003;164(4):1567–1587. doi: 10.1093/genetics/164.4.1567. [DOI] [PMC free article] [PubMed] [Google Scholar]
Associated Data
This section collects any data citations, data availability statements, or supplementary materials included in this article.
Supplementary Materials
Contains Figure S1 - Haplotype heterozygosity (HHe) in 17 populations. In table at the bottom of each plot displayed the average and the standard deviation of HHe in each population sample. The sample information of each population is shown in Table 1. HHe were calculated from haplotypes of 1-Mb windows, SD denotes standard deviation of the HHe values across windows.
Contains Figure S3 - Probability Estimations for the Number of Clusters, with Ten Repeats for Each K. The ordinate shows the Ln probability corresponding to the number of clusters (K) shown on the abscissa. A: showing maximal probability estimation of ten runs at each K (from K = 2 to K = 9); B: showing probability estimation at K = 2 to K = 18 in all ten runs.
Contains Figure S2 - Geographical distribution of Thailand population samples. Red dots on the map indicated sampling locations. Information of population IDs can be found in Table 1.


