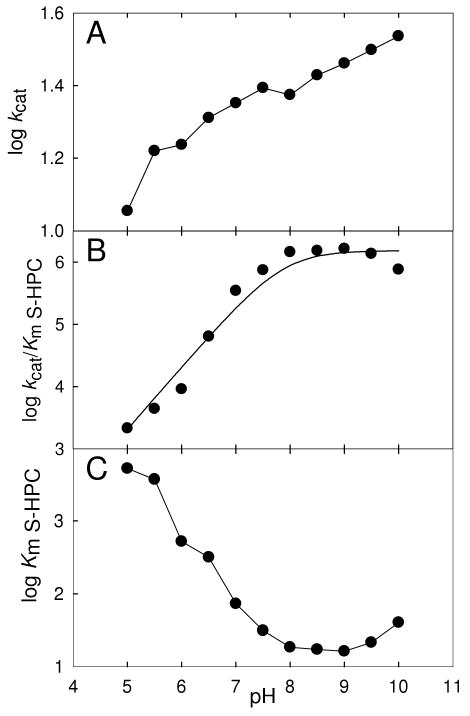
Figure 3.
Changes of kinetic parameters with pH for rS-HPCDH3 catalyzed oxidation of S-HPC. (A) kcat vs. pH, (B) kcat/KmS-HPC vs. pH, (C) KmS-HPC vs. pH, represented in log scale. The plots in (A) and (C) are shown as simple line plots. The line in plot (B) was generated by a fit of the experimental data to equation 1.

