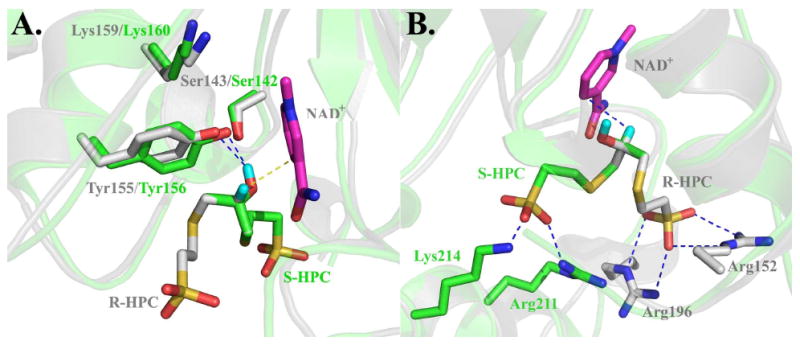
Figure 4.

Superimposed active sites of R-HPCDH1 and S-HPCDH3 based on the crystal structure of R-HPCDH1 and a homology model of S-HPCDH3. The cartoon structures and carbon atoms of amino acid residues of R-HPCDH1 (pdb ID 2cfc) and the homology model for S-HPCDH3 are colored grey and green, respectively. NAD+ is shown in magenta. R-HPC and S-HPC were modeled using the crystal structure for S-HPC bound at the active site of R-HPCDH1 as described previously (16). In both views, R-HPC (grey carbon atoms) and S-HPC (green carbon atoms) are modeled at the active sites such that the positions of the hydroxyl group and hydrogen atom occupy the same positions. The methyl groups and the methylene groups linking the hydroxypropyl groups to CoM are overlayed on top of each other to highlight the different spatial orientations of these groups in R- and S-HPC. Panel A, Superimposed structures highlighting the interactions of substrates with the catalytic triads. Panel B, Superimposed structures highlighting the interactions of substrates with the amino acids that coordinate the sulfonate of CoM.
