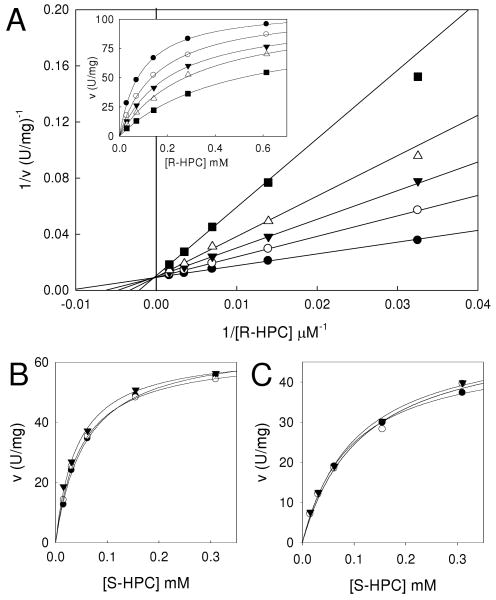
Figure 5.
Effects of 2-(2-methyl-2-hydroxypropylthio)ethanesulfonate (M-HPC) on R- and S-HPC oxidation by R-HPCDH1, S-HPCDH3, and S-HPCDH1. Panel A, Competitive inhibition of R-HPCDH1-catalyzed R-HPC oxidation by M-HPC. The double reciprocal plots for assays performed in the presence of different concentrations of M-HPC are shown in the main diagram. Data points represent the average of triplicate experiments. The solid lines were generated by nonlinear least-square fits of the ν vs. S data, shown in the inset, to the equation for a rectangular hyperbola using Sigmaplot. M-HPC concentrations: (●) 0 mM, (○) 0.2 mM, (▼) 0.4 mM, (△) 0.8 mM, (■) 1.6 mM. Panels B and C, ν vs. S plots for S-HPC oxidation by S-HPCDH3 and S-HPCDH1, respectively, in the presence of different concentrations of M-HPC. The lines were generated by fitting the data to the standard form of the Michaelis-Menten equation. M-HPC concentrations: (●) 0 mM, (○) 1.2 mM, (▼) 4.9 mM.

