

Abstract
Human papillomaviruses (HPV) are associated with nearly all cervical cancers, 20% to 30% of head and neck cancers (HNC), and other cancers. Because HNCs also arise in HPV-negative patients, this type of cancer provides unique opportunities to define similarities and differences of HPV-positive versus HPV-negative cancers arising in the same tissue. Here, we describe genome-wide expression profiling of 84 HNCs, cervical cancers, and site-matched normal epithelial samples in which we used laser capture microdissection to enrich samples for tumor-derived versus normal epithelial cells. This analysis revealed that HPV+ HNCs and cervical cancers differed in their patterns of gene expression yet shared many changes compared with HPV− HNCs. Some of these shared changes were predicted, but many others were not. Notably, HPV+ HNCs and cervical cancers were found to be up-regulated in their expression of a distinct and larger subset of cell cycle genes than that observed in HPV− HNC. Moreover, HPV+ cancers overexpressed testis-specific genes that are normally expressed only in meiotic cells. Many, although not all, of the hallmark differences between HPV+ HNC and HPV− HNC were a direct consequence of HPV and in particular the viral E6 and E7 oncogenes. This included a novel association of HPV oncogenes with testis-specific gene expression. These findings in primary human tumors provide novel biomarkers for early detection of HPV+ and HPV− cancers, and emphasize the potential value of targeting E6 and E7 function, alone or combined with radiation and/or traditional chemotherapy, in the treatment of HPV+ cancers.
Introduction
Human papillomaviruses (HPV) are DNA viruses that infect and replicate in cutaneous and mucosal epithelia, causing benign lesions (1). High-risk, mucosotropic HPV genotypes, including HPV16, HPV18, and HPV31, are causally associated with a variety of anogenital squamous cell carcinomas, including cancers of the lower female reproductive tract, penis, and anus (1). In particular, high-risk HPVs are associated with nearly all cervical cancers, a leading cause of cancer death in women worldwide despite the effectiveness in developed countries of screening for early detection of precancerous lesions (1). Prophylactic HPV vaccines should eventually reduce infections by the most prevalent high-risk HPVs, but do not cover all high-risk HPVs. These vaccines also lack therapeutic effects and so will not affect existing HPV infections that will produce cervical cancer for decades hence.
More recently, high-risk HPVs have also been associated with head and neck cancer (HNC; refs. 2, 3). HNC, which arises in mucosal epithelia lining the mouth, oropharynx, and throat, is the sixth most common cancer in United States, with a survival rate of ∼50% (4). Although nearly all cervical cancers are caused by HPV only 20% to 30% of HNCs are associated with HPV (2, 3); the rest are linked to other risk factors, including tobacco and alcohol. This varied etiology of HNCs provides unique opportunities to study viral contributions to cancer by comparing HPV-associated and HPV-independent cancers in the same anatomic sites. Additionally, HPV+ cervical cancers allow identifying similarities or differences among HPV-associated cancers at distinct anatomic sites.
Recent gene expression profiling studies of HNCs identified four potential subgroups of the HNC population studied (5) and signatures potentially associated with increased risk for metastasis (6) or recurrent disease (7). Although these results contributed greatly to the understanding of HNC, many issues remain because these studies used nonlaser microdissected samples, including tumor and nontumor tissue, analyzed only a fraction of human genes (∼12,000–14,000 genes), and did not determine tumor HPV status. Slebos et al. (8) identified some gene expression differences between HPV+ and HPV− HNCs, although the conclusions of this study were limited by a lack of comparison with normal head and neck tissue or HPV+ cervical cancer.
The oncogenic potential of HPV is believed to reside largely in viral oncogenes E6 and E7, which block tumor-suppressor functions of p53 and Rb, respectively (9). For example, E7-Rb interaction releases E2F family transcription factors to induce transcription of cell cycle-regulated genes, such as cyclin E (10) and MCMs (11). Beyond p53 and Rb, however, E6 and E7 are multifunctional proteins for which numerous interaction partners and functions have been proposed (12, 13). Moreover, in mouse models, the relative oncogenic contribution of E6 and E7 varies dramatically between tissues (14). Additionally, although the oncogenic mechanisms of natural human cancers are complex, most studies have been done in simple tissue culture or animal models based on unnatural overexpression of one or more HPV oncogenes. Thus, despite significant insights into HPV oncogene function, many important questions remain about E6 and E7 effects in HPV+ HNC, their modulation by other HPV genes and additional genetic changes, and the possible relation of these effects to those in cervical cancer and HPV− HNC.
To address these important questions, we investigated gene expression patterns in HPV+ and HPV− HNCs, cervical cancers, and normal epithelia from both sites. Cancer cells were laser microdissected from the surrounding tissue to define tumor-specific gene expression and RNAs were hybridized to genome-wide human microarrays (>54,000 probe sets) and custom HPV microarrays, defining HPV status and genotype. We found that although the overall gene expression profiles of cervical cancer, HPV+ HNC, and HPV− HNC are readily distinguishable, expression patterns of specific gene subgroups, including a range of cell cycle–associated genes and certain testis-specific genes, are shared between HPV+ cancers of the head and neck region and the cervix. Our findings also revealed that HPV+ cancers show significantly increased expression of proliferation markers than HPV− cancers, providing a mechanistic explanation for recent clinical results (15) that HPV+ HNCs are more responsive to radiotherapy than HPV− HNCs. These and other results herein provide new insights in understanding, diagnosing, and potentially treating HPV-associated versus HPV-negative cancers.
Materials and Methods
Tissue samples
Fifteen and 27 HNC samples were from the University of Iowa and Harvard School of Public Health, respectively. Five and nine HNN samples were from the University of Iowa and the National Disease Research Interchange, respectively (Supplementary Table S1). Cervical cancer and normal cervical samples were from the Gynecologic Oncology Group. Patient information is presented in Table 1 and Supplementary Table S1. All tissue samples were fresh frozen in liquid nitrogen and collected with patient consent under approval of the institutional review boards from all participating institutions. Also, all the tumor samples are primary resections collected before the initiation of chemotherapy or radiotherapy. Each sample was processed and RNA was prepared and labeled as described in Supplementary Methods.
Table 1.
Patient information
| HNCs | ||
|---|---|---|
| Cases and controls | N = 54/56* | % |
| Case | 40 | 74.1 |
| Control | 14 | 25.9 |
| Age (mean 59.9 ± 15.2), y | ||
| ≤55 | 19 | 35.2 |
| >55 | 35 | 64.8 |
| Gender | ||
| Female | 20 | 37.0 |
| Male | 34 | 63.0 |
| Tumor site | ||
| Oral cavity | 32 | 59.3 |
| Oropharynx | 22 | 40.7 |
| Normal controls only | N = 14 | % |
| Age (mean 58.0, ± 23.6), y | ||
| ≤55 | 6 | 42.9 |
| >55 | 8 | 57.1 |
| Gender | ||
| Female | 9 | 64.3 |
| Male | 5 | 35.7 |
| Tumor site | ||
| Oral cavity | 9 | 64.3 |
| Oropharynx | 5 | 35.7 |
| Cases only | N = 40/42* | % |
| Age (mean 60.0 ± 11.3), y | ||
| ≤55 | 13 | 32.5 |
| >55 | 27 | 67.5 |
| Gender | ||
| Female | 11 | 27.5 |
| Male | 29 | 72.5 |
| Tumor site | ||
| Oral cavity | 23 | 57.5 |
| Oropharynx | 17 | 42.5 |
| Stage | ||
| I/II | 6 | 15.0 |
| III | 8 | 20.0 |
| IV | 10 | 25.0 |
| Unknown | 16 | 40.0 |
| Grade | ||
| Poorly/undifferentiated | 12 | 30.0 |
| Well/moderately differentiated | 28 | 70.0 |
| Cervical cancers | ||
| Cases and controls | N = 28 | % |
| Case | 20 | 71.4 |
| Control | 8 | 28.5 |
| Age (mean 43.9 ± 10.4), y | ||
| ≤45 | 18 | 64.3 |
| >45 | 10 | 35.7 |
| Normal controls only | N =8 | % |
| Age (mean 58.0 ± 23.6), y | ||
| ≤45 | 3 | 37.5 |
| >45 | 5 | 62.5 |
| Cases only | N = 20 | % |
| Age (mean 42.5 ± 10.6), y | ||
| ≤45 | 7 | 35.0 |
| >45 | 13 | 67.0 |
| Stage | ||
| IB | 16 | 80.0 |
| II/III | 3 | 15.0 |
| IV | 1 | 5.0 |
| Grade | ||
| Poorly/undifferentiated | 12 | 60.0 |
| Well/moderately differentiated | 8 | 40.0 |
Two patients have missing data.
Human and HPV microarrays
Human gene expression was profiled using Affymetrix U133 Plus 2.0 arrays (Affymetrix). For HPV detection and genotyping, 70-mer oligonucleotide probes with a TM of 80°C (Supplementary Methods) were designed using Oligowiz 1.0 (16), purchased from MWG-Biotech, and spotted in quadruplicate on epoxy glass slides (TeleChem International, Inc.) with BioRobotics MicroGrid II (Genomic Solutions). HPV array hybridization was carefully optimized using RNA from known HPV+ and HPV− keratinocyte cell lines (Supplementary Methods). HPV arrays were hybridized with biotin-labeled cRNA, processed as in Supplementary Methods, and scanned using an Agilent DNA microarray scanner (Agilent). Images were analyzed using Axon GenePix Pro 5.1 software (Molecular Devices). Ten micrograms of cRNA were used for Affymetrix microarray hybridization and scanning at the University of Wisconsin Biotechnology Gene Expression Center. To obtain statistically significant sample number in each group while minimizing unnecessary sample processing and microarray use, we selected HNC samples based in part on HPV status.
Statistical analysis
Tools in R (17) and Bioconductor (18) were adapted for statistical analysis. Probe set summary measures were computed by robust multiarray averaging (19) applied to the combined set of 84 microarrays. Average base 2 log expression was used to summarize the expression of each probe set within a tissue class. Multidimensional scaling allowed global (i.e., averaged over the genome) comparisons between classes, and class-restricted nonparametric bootstrap sampling (20) was used to measure the significance of observed differences between global correlations computed on pairs of tumor classes. Permutation testing was used to confirm that each measured correlation was significantly nonzero. The primary analysis of differential gene expression at the probe set level was done in three pairwise comparisons: Tumor versus normal, HPV+ versus HPV−, and HNC versus cervical cancer. Fold changes and t statistics were used to identify differentially expressed probe sets; the latter were converted to q values to control false-discovery rate (21).
Enrichment of gene ontology (GO) categories for differentially expressed genes was measured using random-set testing methods (22, 23). Briefly, the proportion of significantly altered genes and the average log fold change for all genes in each of 2,760 GO categories were compared, respectively, to their distributions on a random set of genes to obtain standardized enrichment Z scores. A category was considered significantly enriched for altered genes if both of these Z scores exceeded 4 (nominal P = 3 × 10⁻⁵). Calculations used version 1.0 of the R package allez, and the October 2005 build of Bioconductor package hgu133plus2. The same Z score standardization applied to class-averaged expression profiles (above) was used to compute GO profiles for each tissue class. These were correlated between classes to assess the similarity of tissue classes.
We developed a parametric testing strategy (20) to evaluate the significance of apparent profile-defined tumor subgroups of the HPV+ HNC tumors (Supplementary Fig. S4A–C). Specifically, a multivariate normal distribution was fit to data from the 16 HPV+ HNC arrays using n = 100 genes most differentially expressed between HPV+ cancers and HPV− cancers (Fig. 2A). The rationale was that such a unimodal Gaussian distribution represents a baseline null hypothesis of no actual subgrouping from which the significance of apparent subgroups could be gauged. Because the sample covariance matrix was rank deficient, we used an empirical Bayes estimate of covariance (24) and repeatedly (104 times) sampled multivariate random n-vectors from a centered normal population with this covariance matrix. Using each bootstrap sample, we divided the 16 tumors according to the subgrouping derived at the penultimate merge of a hierarchical cluster analysis. Each split was scored by the average of the squared t statistics between the two subgroups, which is large if the subgroups are relatively well separated. The average squared t statistic on the subgroups identified by hierarchical clustering of the actual data was compared with the distribution of such scores derived, as above, on the null hypothesis that the profiles emerge from a single, multivariate normal, population, and a P value was computed. To assess sensitivity, we repeated the calculations at a range of gene set sizes n.
Figure 2.


Gene expression signatures for HPV+ versus HPV− cancers and HNC versus cervical cancer cancers. A, normalized expression values for all 84 samples and 137 probe sets that are significantly differentially expressed between the HPV+ cancers and the HPV− cancers. Bottom right key, high (red) and low (green) expression, corresponding to a +7.5 to −8.2 log 2 scale of fold change relative to the average of each gene across all 84 microarrays. These genes were ordered by hierarchical clustering based on similarities in their expression changes across the samples (see dendogram, left). Gene sets III and IV show significantly up- or down-regulated probe sets, respectively. HPV+ cancer samples (red text) and HPV− cancer samples (blue text) are shown at the bottom of the heat map.
B, like (A), but using 291 probe sets that are significantly differentially expressed between cervical cancer and HNC. Gene sets V and VII show significantly up-regulated probe sets in cervical cancer versus HNC, whereas gene set VI shows significantly down-regulated probe sets. Cervical cancer samples (red text) and HNC samples (blue text) are shown at the bottom of the heat map. *, probe set ID that does not have annotated gene name. HPV status is shown as + and − on each sample ID.
Tissue culture, quantitative reverse transcriptase-PCR, Western blotting, and immunohistochemistry were done as described in Supplementary Methods.
Results
Tissue samples, microarray profiling, and HPV status
Eighty-four samples including 42 HNCs, 14 head and neck normals (HNN), 20 cervical cancers, and 8 cervical normals were cryosectioned, and selected sections were stained with H&E, verified free of autolysis and freezing artifacts, and analyzed histopathologically. Relevant patient information is summarized in Table 1 and Supplementary Table S1. All tumor samples were collected before chemotherapy or radiotherapy. For all normal tissues and tumors with <90% cancer cells (61 of 84), laser microdissection was done to capture normal epithelial or tumor cells, respectively (Supplementary Fig. S1). Complementary RNA (cRNA) was prepared and hybridized to Affymetrix U133 Plus 2.0 microarrays containing oligonucleotide probes for all known expressed human mRNAs. Normalization was done as described in Materials and Methods. Resulting microarray data were deposited to the National Center for Biotechnology Information Gene Expression Omnibus database under general accession number GSE6791 and sample accession numbers in Supplementary Table S1.
HPV status and genotype were determined by hybridization to custom-made 70-mer oligonucleotide microarrays containing probes for all 37 known mucosotropic HPV genotypes plus positive and negative control probes. These microarrays were sufficiently sensitive to detect HPV in cell lines harboring a few extrachromosomal copies or a single integrated copy of HPV DNA. No normal tissue showed any significant HPV signal; however, consistent with prior findings (3), 16 of 42 HNCs harbored HPV (13 HPV16, two HPV33, and one HPV18; Table 2). About half of cervical cancers were HPV16 positive, with lesser numbers carrying HPV genotypes 18, 31, 33, 35, 58, or 66 (Table 2). Three of 20 cervical cancers hybridized well to control cell mRNA probes but showed no detectable HPV signal. PCR with consensus HPV L1 primers MY09-MY11 (25) confirmed absence of detectable HPV DNA in these samples (Supplementary Fig. S2).
Table 2.
HPV status in tumor samples
| Diagnosis | Head and neck | Cervix | ||
|---|---|---|---|---|
| Cancer | Normal | Cancer | Normal | |
| Total | 42 | 14 | 20 | 8 |
| HPV negative | 26 | 14 | 3 | 8 |
| HPV positive | 16 | — | 17 | — |
| HPV16 | 13 | — | 8 | — |
| HPV18 | 1 | — | 3 | — |
| HPV31 | — | — | 1 | — |
| HPV33 | 2 | — | 1 | — |
| HPV35 | — | — | 2 | — |
| HPV58 | — | — | 1 | — |
| HPV66 | — | — | 1 | — |
Because these samples shared some expression patterns with HPV+ cervical cancer and HNCs (see below), they may contain HPV, possibly with sequence variations inhibiting detection by these sequence-specific methods (26). However, varying the HPV status assigned to these three cervical cancers had only minimal effects on the gene expression signature differentiating HPV+ and HPV− cancers. Comparisons of HPV+ and HPV− cancers with these samples included as HPV− cervical cancer, as HPV+ cervical cancer, or excluded all revealed HPV-specific expression signatures dominated by a robust common core of nearly 140 genes. The analysis below reports HPV+ and HPV− cancer comparisons based on the original HPV− assignment of these cervical cancers, because this yielded the best-conserved core expression signature (137 genes), whereas the alternate assumptions each added some additional genes whose differential expression levels were not as well conserved across the analyses.
Gene expression relationships among HPV+ and HPV− HNCs and cervical cancers
Global pairwise comparisons of complete mRNA expression profiles between all tumor and normal sample classes were done by multidimensional scaling (27). This analysis (Fig. 1A) measures for each pair of tumor and normal classes the distances between class-averaged log 2 expression levels over all 54,675 Affymetrix probe sets. Not surprisingly, the most closely related classes were HPV+ HNC and HPV− HNC (average distance, 0.17). Notably, the next closest classes were the two HPV+ cancers, HPV+ HNC and HPV+ cervical cancer, whose distance of 0.21 was closer than either to its corresponding normal (0.29, 0.53).
Figure 1.

Global gene expression analysis shows similarities and differences among HPV+ HNC, HPV− HNC, and cervical cancer. A, multidimensional scaling measurements between all indicated pairs of tumor and normal classes of the distances between class-averaged log 2 expression levels over all 54,675 Affymetrix probe sets. The relative distances between each class are approximated in the two-dimensional projection (top) and were tabulated (bottom). CC, cervical cancer; CN, cervical normal. B, pairwise comparisons of expression alterations from normal for three cancers are shown as scatter plots of average log 2 fold change from normal. Pearson correlations (R) measure global concordance in expression alterations between cancer pairs. Genes that show differential expression between HPV+ HNC and HPV− HNC are highlighted; tracking into the HPV+ HNC versus HPV+ cervical cancer comparison, these genes are predominantly equivalently expressed between these HPV+ cancers. Dotted lines, median expression changes of red and blue genes; red and blue arrows, median shifted from HPV+ HNC/HPV− HNC compared with HPV+ HNC/cervical cancer comparison. C, differential expression analysis reveals lists of genes significantly altered between the respective tissue classes. The results of three pairwise comparisons are summarized in the Venn diagram and tabulated fully in Table 3 (HPV+ versus HPV−), Supplementary Table S5 (tumor versus normal), and Supplementary Table S6 (HNC versus cervical cancer).
The global effect of virus-specific and tissue-specific factors is further illustrated in Fig. 1B, which compares for paired tumor classes the log 2 average expression levels, relative to corresponding normals, of all probe sets. The indicated Pearson correlation coefficients confirm that the highest correlation is between HPV+ HNC and HPV− HNC (R = 0.81). The substantial correlation between HPV+ HNCs and HPV+ cervical cancers (R = 0.58), well above HPV+ cervical cancers and HPV− HNCs (R = 0.46), again implies a substantial role for virus-dependent, tissue-independent factors in gene expression changes. HPV+ HNC versus HPV+ cervical cancer correlation exceeds the HPV− HNC versus HPV+ cervical cancer correlation in more than 90% of bootstrap sampled data sets, and all correlations were significant by permutation analysis. Thus, both HPV status and tissue type contribute to the relatedness and distinction of HPV+ HNCs, HPV− HNCs, and HPV+ cervical cancers.
To offset variation in probe set–level measurements, we did similar correlation analyses on fold changes averaged over GO gene classes rather than individual probe sets, reinforcing the findings above (Supplementary Fig. S3A).
Although HPV+ HNC and HPV− HNC exhibited generally high positive correlation in gene expression changes from normal, many genes had altered expression between these two classes. Figure 1B highlights 47 genes selectively up-regulated (red points) and 45 genes selectively down-regulated (blue points) by >2.6-fold in HPV+ HNC relative to HPV− HNC (see also Supplementary Table S3A and S3B). Notably, for genes that were highly up-regulated in HPV+ HNC relative to HPV− HNC, parallel comparison of expression levels between HPV+ HNC and cervical cancer shifted their distribution in the plot dramatically rightward, revealing substantial correlated expression in these two HPV+ cancers (red arrow and points in Fig. 1B, middle). Conversely, genes that were significantly down-regulated in HPV+ HNC relative to HPV− HNC showed a substantial but opposite leftward shift into greater correlation in a comparison plot of expression levels between HPV+ HNC and cervical cancer (blue arrow and points in Fig. 1B, middle). Thus, the tumor-specific expression changes in these genes correlated much more strongly with the presence of HPV than the tissue site.
To further analyze gene expression changes based on tumor/normal, HPV+/HPV−, and HNC/cervical cancer differences, we identified for each comparison differentially expressed genes with fold change >2 and t test q < 0.001. By these criteria, as shown in Fig. 1C, 1,701 and 243 genes were up- and down-regulated, respectively, in tumors relative to normals; on the other hand, 124 and 13 genes were up- and down-regulated in HPV+ relative to HPV− cancers, and 256 and 35 genes were up- and down-regulated in cervical cancer relative to HNC.
More specifically, in tumor/normal comparisons (Supplementary Fig. S3B; Supplementary Table S5), HPV+ HNC, HPV− HNC, and cervical cancer all were up-regulated relative to normals for a gene set I, including keratins (KRT8, KRT17, KRT18), caveolin (CAV2), IFNα-inducible protein 6-16 (G1P3), matrix metallopeptidase 12 (MMP12), collagens (COL4A1, COL4A2), and phospholipid scramblase 1 (PLSCR1), and down-regulated for another set II, including other keratins (KRT4, KRT13, KRT15), programmed cell death 4 (PDCD4), protein tyrosine kinase 6 (PTK6), epithelial membrane protein 1 (EMP1), extracellular matrix protein 1 (ECM1), interleukin 1 receptor (IL1R2), and transglutaminase 3 (TGM3).
Relative to HPV− HNC (Fig. 2A; Table 3), HPV+ HNC and cervical cancer showed significantly increased expression of gene set III, including PC4/SFRS1-interacting protein 1 (PSIP1), V-myb (MYB), synaptogyrin 3 (SYNGR3), SWI/SNF-related, matrix-associated, actin-dependent regulator of chromatin (SMARCA2), synaptonemal complex protein 2 (SYCP2), p16 (CDKN2A), lymphoid-specific heli-case (HELLS), and testicular cell adhesion molecule 1 (TCAM1), whereas expression was decreased for gene set IV, including parathyroid hormone-like hormone (PTHLH), cortactin (CTTN), kallikreins (KLK8, KLK10), cyclin D1 (CCND1), caveolin 1 (CAV1), and defensin β4 (DEFB4). At the GO category level (Supplementary Table S4A), HPV+ cancers were up-regulated relative to HPV− cancers for annotations related to DNA replication and cell cycle, and down-regulated in genes involved in epidermal development and hormone activity.
Table 3.
Differentially expressed genes in HPV+ cancers versus HPV− cancers
| Probe set ID* | Gene title | Gene symbol | t statistic | Overlaps† |
|---|---|---|---|---|
| 207039_at | Cyclin-dependent kinase inhibitor 2A (melanoma, p16, inhibits CDK4) | CDKN2A | 6.73 | T/N, CC/HNC |
| 228286_at | Hypothetical protein FLJ40869 | FLJ40869 | 5.45 | CC/HNC |
| 218397_at | Fanconi anemia, complementation group L | FANCL | 5.63 | CC/HNC |
| 203358_s_at | Enhancer of zeste homologue 2 (Drosophila) | EZH2 | 6.41 | CC/HNC |
| 218783_at | DKFZP434B168 protein | DKFZP434B168 | 6.00 | CC/HNC |
| 206316_s_at | Kinetochore associated 1 | KNTC1 | 6.26 | T/N, CC/HNC |
| 201555_at | MCM3 minichromosome maintenance deficient 3 (S. cerevisiae) | MCM3 | 5.88 | T/N, CC/HNC |
| 221677_s_at | Downstream neighbor of SON | DONSON | 6.08 | T/N, CC/HNC |
| 204510_at | CDC7 cell division cycle 7 (S. cerevisiae) | CDC7 | 6.42 | T/N, CC/HNC |
| 227255_at | Casein kinase | LOC149420 | 5.59 | CC/HNC |
| 222201_s_at | CASP8 associated protein 2 | CASP8AP2 | 5.09 | T/N, CC/HNC |
| 224428_s_at | Cell division cycle associated 7 | CDCA7 | 4.36 | CC/HNC |
| 219306_at | Kinesin-like 7 | KNSL7 | 5.45 | CC/HNC |
| 212621_at | KIAA0286 protein | KIAA0286 | 4.60 | T/N |
| 229551_x_at | Zinc finger protein 367 | ZNF367 | 6.29 | T/N, CC/HNC |
| 222848_at | Leucine zipper protein FKSG14 | FKSG14 | 4.37 | T/N, CC/HNC |
| 228401_at | — | — | 4.49 | T/N, CC/HNC |
| 225655_at | Ubiquitin-like, containing PHD and RING finger domains, 1 | UHRF1 | 4.69 | T/N, CC/HNC |
| 227350_at | Helicase, lymphoid-specific | HELLS | 5.13 | T/N, CC/HNC |
| 228033_at | E2F transcription factor 7 | E2F7 | 4.36 | T/N, CC/HNC |
| 218585_s_at | RA-regulated nuclear matrix-associated protein | RAMP | 4.99 | T/N, CC/HNC |
| 209172_s_at | Centromere protein F, 350/400ka (mitosin) | CENPF | 4.51 | T/N, CC/HNC |
| 226456_at | Hypothetical protein MGC24665 | MGC24665 | 6.23 | T/N |
| 202589_at | Thymidylate synthetase | TYMS | 5.51 | T/N |
| 239680_at | — | — | 5.19 | CC/HNC |
| 236513_at | — | — | 4.85 | CC/HNC |
| 224320_s_at | MCM8 minichromosome maintenance deficient 8 | MCM8 | 5.73 | T/N |
| 202532_s_at | Dihydrofolate reductase | DHFR | 5.24 | None |
| 210371_s_at | Retinoblastoma binding protein 4 | RBBP4 | 4.73 | T/N, CC/HNC |
| 201970_s_at | Nuclear autoantigenic sperm protein (histone-binding) | NASP | 6.42 | T/N, CC/HNC |
| 223542_at | Ankyrin repeat domain 32 | ANKRD32 | 4.40 | T/N, CC/HNC |
| 209337_at | PC4 and SFRS1 interacting protein 1 | PSIP1 | 6.01 | CC/HNC |
| 205961_s_at | PC4 and SFRS1 interacting protein 1 | PSIP1 | 5.59 | CC/HNC |
| 206542_s_at | SWI/SNF related, matrix associated, actin-dep chromatin regulator | SMARCA2 | 4.88 | None |
| 242471_at | — | — | 4.97 | None |
| 229442_at | Hypothetical protein MGC33382 | MGC33382 | 4.45 | T/N, CC/HNC |
| 203482_at | Chromosome 10 open reading frame 6 | C10orf6 | 6.24 | CC/HNC |
| 201448_at | TIA1 cytotoxic granule-associated RNA binding protein | TIA1 | 5.60 | None |
| 221264_s_at | TAR DNA binding protein | TARDBP | 5.57 | None |
| 214093_s_at | Far upstream element (FUSE) binding protein 1 | FUBP1 | 4.78 | None |
| 209285_s_at | Retinoblastoma-associated protein 140 | RAP140 | 5.56 | None |
| 230120_s_at | Plasminogen-like | PLGL | 5.39 | None |
| 217122_s_at | Solute carrier family 35, member E2 | SLC35E2 | 7.47 | None |
| 228466_at | Clone IMAGE:111714 mRNA sequence | — | 5.59 | None |
| 212179_at | Chromosome 6 open reading frame 111 | C6orf111 | 5.31 | None |
| 235919_at | — | — | 5.10 | None |
| 215731_s_at | M-phase phosphoprotein 9 | MPHOSPH9 | 4.64 | None |
| 229886_at | FLJ32363 protein | FLJ32363 | 5.87 | None |
| 228174_at | — | — | 6.44 | None |
| 212774_at | Zinc finger protein 238 | ZNF238 | 4.65 | None |
| 226478_at | Transmembrane 7 superfamily member 3 | TM7SF3 | 4.64 | None |
| 42361_g_at | Chromosome 6 open reading frame 18 | C6orf18 | 5.76 | CC/HNC |
| 202726_at | Ligase I, DNA, ATP-dependent | LIG1 | 6.26 | None |
| 231931_at | PR domain containing 15 | PRDM15 | 7.15 | CC/HNC |
| 230777_s_at | PR domain containing 15 | PRDM15 | 6.54 | CC/HNC |
| 229468_at | Cyclin-dependent kinase 3 | CDK3 | 5.45 | None |
| 230653_at | — | — | 5.15 | None |
| 220969_s_at | — | — | 4.93 | CC/HNC |
| 241838_at | — | — | 4.90 | None |
| 235231_at | Hypothetical protein LOC285989 | LOC285989 | 4.47 | None |
| 212980_at | AHA1, activator of heat shock 90 kDa protein ATPase homologue 2 | AHSA2 | 4.47 | None |
| 219676_at | Zinc finger protein 435 | ZNF435 | 5.16 | None |
| 226040_at | Hypothetical protein LOC283585 | — | 4.43 | None |
| 223513_at | Centromere protein J | CENPJ | 5.41 | T/N, CC/HNC |
| 228455_at | CDNA FLJ43677 fis, clone SYNOV4009295 | — | 5.28 | CC/HNC |
| 225786_at | Family with sequence similarity 36, member A | FAM36A | 4.56 | CC/HNC |
| 205345_at | BRCA1-associated RING domain 1 | BARD1 | 5.04 | CC/HNC |
| 227921_at | — | — | 4.97 | None |
| 230312_at | — | — | 4.35 | None |
| 225841_at | Hypothetical protein FLJ30525 | FLJ30525 | 6.64 | T/N |
| 202743_at | Phosphoinositide-3–kinase, regulatory subunit 3 (p55, γ) | PIK3R3 | 5.96 | None |
| 209644_x_at | Cyclin-dependent kinase inhibitor 2A (melanoma, p16, inhibits CDK4) | CDKN2A | 6.39 | T/N |
| 225355_at | Hypothetical protein DKFZP761M1511 | DKFZP761M1511 | 5.05 | None |
| 204159_at | Cyclin-dependent kinase inhibitor 2C (p18, inhibits CDK4) | CDKN2C | 5.83 | None |
| 202412_s_at | Ubiquitin specific protease 1 | USP1 | 5.55 | T/N |
| 243539_at | KIAA1841 protein | KIAA1841 | 4.86 | None |
| 1554447_at | CDNA clone MGC:32876 IMAGE:4734912, complete cds | — | 4.53 | CC/HNC |
| 213268_at | Calmodulin-binding transcription activator 1 | CAMTA1 | 5.53 | None |
| 1555370_a_at | Calmodulin-binding transcription activator 1 | CAMTA1 | 4.80 | None |
| 229795_at | — | — | 4.27 | T/N |
| 225768_at | Nuclear receptor subfamily 1, group D, member 2 | NR1D2 | 4.51 | CC/HNC |
| 221045_s_at | Period homologue 3 (Drosophila) | PER3 | 6.43 | CC/HNC |
| 232889_at | Hypothetical protein LOC153561 | LOC153561 | 4.97 | None |
| 213089_at | Hypothetical protein LOC153561 | LOC153561 | 4.58 | None |
| 213605_s_at | FLJ40092 protein | FLJ40092 | 5.95 | None |
| 221973_at | Hypothetical protein LOC150759 | LOC150759 | 5.14 | T/N, CC/HNC |
| 213703_at | Hypothetical protein LOC150759 | LOC150759 | 5.46 | None |
| 220325_at | TAF7-like RNA polymerase II, TATA box binding protein-associated factor | TAF7L | 5.11 | None |
| 219255_x_at | Interleukin 17 receptor B | IL17RB | 5.67 | None |
| 205531_s_at | Glutaminase 2 (liver, mitochondrial) | GLS2 | 4.44 | None |
| 230011_at | Similar to mouse meiosis defective 1 gene | MGC40042 | 5.34 | None |
| 219753_at | Stromal antigen 3 | STAG3 | 6.09 | None |
| 233064_at | Hypothetical gene supported by AL365406; BC034005 | — | 7.85 | None |
| 1553611_s_at | Hypothetical protein FLJ33790 | FLJ33790 | 5.15 | None |
| 205691_at | Synaptogyrin 3 | SYNGR3 | 4.84 | T/N |
| 1558217_at | Hypothetical protein FLJ31952 | FLJ31952 | 4.64 | None |
| 233320_at | Testicular cell adhesion molecule 1 | TCAM1 | 7.07 | T/N, CC/HNC |
| 1556244_s_at | Hypothetical protein LOC375196 | LOC375196 | 7.56 | None |
| 226344_at | Zinc finger, matrin type 1 | ZMAT1 | 5.47 | None |
| 204798_at | v-myb myeloblastosis viral oncogene homologue (avian) | MYB | 5.12 | None |
| 230469_at | Pleckstrin homology domain containing, family K member 1 | PLEKHK1 | 6.22 | None |
| 241903_at | — | — | 5.20 | CC/HNC |
| 213353_at | ATP-binding cassette, subfamily A (ABC1), member 5 | ABCA5 | 4.35 | CC/HNC |
| 221103_s_at | Hypothetical protein FLJ11142 | FLJ11142 | 5.67 | None |
| 241705_at | — | — | 4.63 | None |
| 218902_at | Notch homologue 1, translocation-associated (Drosophila) | NOTCH1 | 5.57 | None |
| 237269_at | — | — | 4.92 | CC/HNC |
| 228245_s_at | Ovostatin | OVOS | 4.30 | T/N |
| 244023_at | Spleen tyrosine kinase | SYK | 4.98 | None |
| 242918_at | Nuclear autoantigenic sperm protein (histone-binding) | NASP | 4.60 | None |
| 242890_at | Helicase, lymphoid-specific | HELLS | 4.45 | T/N |
| 220940_at | KIAA1641 | KIAA1641 | 4.22 | None |
| 229666_s_at | Cleavage stimulation factor, 3′ pre-RNA, subunit 3, 77kDa | CSTF3 | 4.44 | None |
| 1559214_at | — | — | 4.52 | T/N |
| 229490_s_at | — | — | 4.32 | T/N |
| 205668_at | Lymphocyte antigen 75 | LY75 | 4.26 | None |
| 228434_at | Butyrophilin-like 9 | BTNL9 | 4.87 | None |
| 228262_at | Hypothetical protein FLJ14503 | FLJ14503 | 5.40 | None |
| 204069_at | Meis1, myeloid ecotropic viral integration site 1 homologue (mouse) | MEIS1 | 4.97 | T/N, CC/HNC |
| 1562921_at | E1A binding protein p300 | EP300 | 4.28 | CC/HNC |
| 208498_s_at | Amylase, α 2A; pancreatic | AMY2A | 5.32 | None |
| 231164_at | Hypothetical gene supported by AK095200; BC042853 | — | 6.91 | T/N |
| 206546_at | Synaptonemal complex protein 2 | SYCP2 | 7.49 | T/N, CC/HNC |
| 1557570_a_at | Hypothetical protein LOC285084 | LOC285084 | 5.88 | T/N |
| 209792_s_at | Kallikrein 10 | KLK10 | −4.32 | None |
| 206125_s_at | Kallikrein 8 (neuropsin/ovasin) | KLK8 | −5.68 | CC/HNC |
| 207356_at | Defensin, β4 | DEFB4 | −4.28 | CC/HNC |
| 226448_at | Hypothetical gene supported by BC009447 | MGC15887 | −4.40 | T/N |
| 219368_at | Nucleosome assembly protein 1-like 2 | NAP1L2 | −5.63 | None |
| 208712_at | Cyclin D1 (PRAD1: parathyroid adenomatosis 1) | CCND1 | −4.50 | None |
| 208711_s_at | Cyclin D1 (PRAD1: parathyroid adenomatosis 1) | CCND1 | −5.27 | None |
| 214073_at | Cortactin | CTTN | −5.10 | None |
| 203065_s_at | Caveolin 1, caveolae protein, 22 kDa | CAV1 | −4.58 | T/N |
| 210355_at | Parathyroid hormone-like hormone | PTHLH | −4.45 | T/N |
| 1556773_at | Parathyroid hormone-like hormone | PTHLH | −4.43 | T/N |
| 211756_at | Parathyroid hormone-like hormone | PTHLH | −4.46 | T/N |
| 230835_at | KIPV467 | UNQ467 | −4.37 | CC/HNC |
In comparison between cervical cancer and HNC (Fig. 2B; Supplementary Table S6), cervical cancers showed significantly up-regulated expression of gene sets V and VII, including estrogen receptor 1 (ESR1), keratin 19 (KRT19), X (inactive)–specific transcript (XIST), and zinc finger protein 367 (ZNF367), whereas HNC showed increased expression of gene set VI (Fig. 2B; Supplementary Table S6), including dermatopontin (DPT), desmocollin 1 (DSC1), melanoma antigen A12 (MAGEA12), and chromosome Y open reading frame 15B (CYorf15B).
A distinct subgroup in HPV+ cancers
Hierarchical clustering of differentially expressed genes between HPV+ and HPV− cancers revealed two subgroups of HPV+ cancers (Supplementary Fig. S4A and S4B). These subgroups (α and β) were not correlated with any identified sample characteristics including anatomic site, age, or clinical stage (Supplementary Table S1A) and were robustly preserved when the grouping was repeated using different agglomeration methods for clustering and varying numbers of differentially expressed genes.
The smaller subgroup, a, showed high up-regulation of a set of B lymphocyte/lymphoma–related genes, including baculoviral IAP repeat 3 (BIRC3), butyrophilin-like 9 (BTNL9), DKFZ P564O0823, homeobox C6 (HOXC6), and B-cell chronic lymphocytic leukemia/lymphoma 11A (BCL11A; Supplementary Fig. S4C; Supplementary Table S7). B cell–related gene expression by this tumor subgroup was not due to tumor-infiltrating B cells, because there was no correlation between this subgroup and expression of CD19, CD20, and immunoglobulins, which are expressed in B cells throughout most or all circulating stages (28).
Subgroup α also was up-regulated relative to other HPV+ cancers for genes expressed by endothelial cells, including vascular cell adhesion molecule 1 (VCAM1) and zinc finger protein 62 (ZNF62) and down-regulated for genes, including several small proline-rich proteins (SPRR1A and SPRR2A), keratins (KRT6B and KRT16), and gap junction proteins (GJB2 and GJB6; Supplementary Fig. S4C; Supplementary Table S7). Expression of synaptopodin (SYNPO2), an important regulator of cell migration (29), was increased >20-fold in this subgroup relative to other HPV+ cancers, suggesting potentially increased invasiveness.
Due to variations among microarray platforms and methods, reproducibility of expression profiling has been one of the biggest challenges in microarray studies of cancer (30). Chung et al. (5) recently reported dividing 60 HNCs into four subgroups by gene expression patterns. However, clustering our samples based on the genes reported as differentially expressed signatures of these four subgroups revealed little significant correlation. Possible causes for this lack of correlation include use of whole samples in the prior study versus selectively microdissected samples here, differences in the microarray platforms used, or limitations in sample group sizes in these studies. Supplementary Fig. S5A shows the best association of our HNC samples into four groups based on the prior signature gene sets. Although weak, the B lymphocyte/lymphoma–related subset α identified in Supplementary Fig. S4 showed the most similarity for Chung et al.'s subgroup 2, in that most genes in Chung et al.'s set E were down-regulated and, for two of the six relevant tumors (HNC005, HNC012), some genes in set F were up-regulated, primarily including mesenchymal markers associated with poorer clinical outcomes (5, 31): syndecan, vimentin, and some collagens (Supplementary Table S8).
HPV+ and HPV− cancers are activated in different components of the cell cycle pathway
E7 oncoproteins of high-risk HPVs induce DNA replication and mitosis by multiple mechanisms, including interacting with pRb, HDACs, and other factors to activate cell cycle–regulated transcription factors such as E2F (32–34). However, the extent of the resulting gene expression changes, the full contributions of other HPV genes and additional genetic changes to oncogenesis, and the relation of these effects to those in HPV− HNC have not been determined. To test for differential expression in HPV+ versus HPV− cancers, we examined cell cycle–related genes based on GO classification. A significant subset of cell cycle–regulated genes was differentially expressed in HPV+ HNC and cervical cancer relative to HPV− HNC (Fig. 3A; Table 4). As shown in Fig. 3B, HPV− HNCs up-regulated, relative to HPV+ cancers, a small set of cell cycle–specific genes, including cyclin D1/D2 (CCND1 and CCND2; G1 associated) and cyclin A1 (CCNA1; Fig. 3A, set VIII, and 3B). By contrast, HPV+ cancers up-regulated, relative to HPV− HNC, a much larger set of cell cycle–specific genes such as cyclin E2 (CCNE2; G1 associated), cyclin B1 (CCNB1; G2 associated), and multiple MCMs (Fig. 3A, set IX, and B). Among these, many genes that enhance DNA replication and cell mitosis, including proliferating cell nuclear antigen (PCNA), E2Fs, cdc2, cdc7, and MCMs were significantly up-regulated in HPV+ HNC and cervical cancer relative to HPV− HNC, implying that the HPV+ cancers were more active in cell division.
Figure 3.

Cell cycle–related genes are up-regulated in HPV+ cancers. A, highly up-regulated genes in HPV+ cancers were analyzed by GO grouping. Cell cycle–related genes were selected and plotted on the heat map. Blue bars, HPV− cervical cancers. B, up- and down-regulated genes indicated in the cell cycle pathway provided by the KEGG database. Red and blue boxes, up-regulated genes in HPV+ and HPV− cancers compared with corresponding normal tissue, respectively. C, a part of the cell cycle–related genes was analyzed using qRT-PCR. Fold changes of the gene expression in NIKS-16 relative to gene expression in NIKS. Columns, mean; bars, SD.
Table 4.
Cell cycle genes up- or down-regulated in HPV+ cancers versus HPV− cancers
| Probe set ID* | Gene title | Gene symbol | t statistic |
|---|---|---|---|
| 205767_at | Epiregulin | EREG | −3.47 |
| 209792_s_at | Kallikrein 10 | KLK10 | −4.25 |
| 208711_s_at | Cyclin D1 | CCND1 | −5.43 |
| 208712_at | Cyclin D2 | CCND2 | −4.48 |
| 1553869_at | Sestrin 3 | SESN3 | −3.39 |
| 205899_at | Cyclin A1 | CCNA1 | −4.06 |
| 235683_at | Sestrin 3 | SESN3 | −4.05 |
| 207039_at | Cyclin-dependent kinase inhibitor 2A (melanoma, p16, inhibits CDK4) | CDKN2A | 7.09 |
| 206546_at | Synaptonemal complex protein 2 | SYCP2 | 7.36 |
| 204159_at | Cyclin-dependent kinase inhibitor 2C (p18, inhibits CDK4) | CDKN2C | 5.73 |
| 204510_at | CDC7 cell division cycle 7 | CDC7 | 6.51 |
| 206316_s_at | Kinetochore associated 1 | KNTC1 | 6.28 |
| 205085_at | Origin recognition complex, subunit 1-like | ORC1L | 4.96 |
| 201746_at | Tumor protein p53 | TP53 | 3.57 |
| 224320_s_at | MCM8 minichromosome maintenance deficient 8 | MCM8 | 5.61 |
| 213204_at | p53-associated parkin-like cytoplasmic protein | PARC | 5.90 |
| 222962_s_at | MCM10 minichromosome maintenance deficient 10 | MCM10 | 2.74 |
| 201555_at | MCM3 minichromosome maintenance deficient 3 | MCM3 | 5.95 |
| 201930_at | MCM6 minichromosome maintenance deficient 6 | MCM6 | 5.56 |
| 244550_at | Transcription factor Dp-1 | TFDP1 | 3.00 |
| 228361_at | E2F transcription factor 2 | E2F2 | 4.94 |
| 204121_at | Growth arrest and DNA-damage-inducible, γ | GADD45G | 2.16 |
| 225297_at | Coiled-coil domain containing 5 (spindle associated) | CCDC5 | 3.42 |
| 204457_s_at | Growth arrest-specific 1 | GAS1 | 2.17 |
| 228033_at | E2F transcription factor 7 | E2F7 | 4.39 |
| 204252_at | Cyclin-dependent kinase 2 | CDK2 | 3.77 |
| 210028_s_at | Origin recognition complex, subunit 3-like (yeast) | ORC3L | 4.12 |
| 209408_at | Kinesin family member 2C | KIF2C | 5.52 |
| 209172_s_at | Centromere protein F, 350/400ka (mitosin) | CENPF | 4.55 |
| 219588_s_at | Leucine zipper protein 5 | LUZP5 | 4.86 |
| 203693_s_at | E2F transcription factor 3 | E2F3 | 4.05 |
| 218663_at | Chromosome condensation protein G | HCAP-G | 3.55 |
| 202107_s_at | MCM2 minichromosome maintenance deficient 2, mitotin | MCM2 | 4.37 |
| 208795_s_at | MCM7 minichromosome maintenance deficient 7 | MCM7 | 4.06 |
| 201664_at | SMC4 structural maintenance of chromosomes 4-like 1 | SMC4L1 | 4.44 |
| 201202_at | Proliferating cell nuclear antigen | PCNA | 5.12 |
| 203213_at | Cell division cycle 2, G1 to S and G2 to M | CDC2 | 3.27 |
| 204240_s_at | SMC2 structural maintenance of chromosomes 2-like 1 | SMC2L1 | 1.73 |
| 205034_at | Cyclin E2 | CCNE2 | 3.59 |
| 205393_s_at | CHK1 checkpoint homologue | CHEK1 | 1.05 |
| 214710_s_at | Cyclin B1 | CCNB1 | 1.20 |
| 203755_at | BUB1 budding uninhibited by benzimidazoles 1 homologue β | BUB1B | 2.77 |
In order as shown in Fig. 3A.
A subset of these genes were analyzed by quantitative reverse transcriptase-PCR (qRT-PCR) with total RNA extracted from naturally immortalized human keratinocyte lines NIKS-16 and NIKS, which have and lack an extrachromosomal HPV16 genome, respectively (35). In keeping with the microarray results, p16, cdc7, origin recognition complex 1 (ORC1), kinetochore-associated protein (KNTC1), MCM6, cyclin B1 (CCNB1), BUB1, cdc2, and cdc20 were highly up-regulated by HPV16, whereas cyclin A1 (CCNA1) was down-regulated (Fig. 3C). Because the NIKS-16 cells were only five to six passages after stable HPV16 transfection, these results indicate that HPV deregulates a subset of cell cycle–related genes soon after being acquired by cells. To eliminate possible effects of the prior spontaneous immortalization of NIKS cells, we measured gene expression levels in normal (i.e., early passage) cervical epithelial cells transduced with HPV16 E6 and/or E7 oncogenes. The results confirmed NIKS data, showing an up-regulation of CCNB1, cdc2, ORC1, and p16 by HPV16 E6 and E7 expression (Supplementary Fig. S6). Moreover, immunohistochemistry showed that tumor cells in HPV+ cancers expressed significantly (P < 0.001) higher levels of PCNA protein than HPV− tumor cells (Fig. 4). In addition, PCNA protein levels were highly correlated with cell cycle–related gene expression levels (Supplementary Table S9). Together, these results indicate that HPV acts in HPV+ HNCs and cervical cancers to deregulate the cell cycle pathway in shared ways that are markedly distinct from HPV− HNCs.
Figure 4.
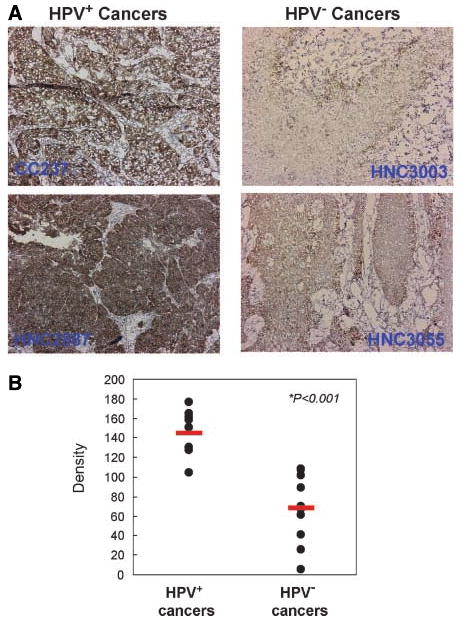
PCNA protein expression is up-regulated in HPV+ cancers. Using anti-human PCNA antibody, immunohistochemistry was done with sections of 11 HPV+ and 10 HPV− cancers. Immunohistochemical images were analyzed and quantified as described previously (ref. 53; see Supplementary Methods). Representative immunohistochemical images (A) and calculated density of all samples (B). Red bars, mean values of each class. The tissue was also briefly counterstained with hematoxylin.
Up-regulation of novel testis antigens in HPV+ cancers
Genes highly up-regulated in HPV+ cancers relative to HPV− HNC included two testis-specific genes not normally expressed in somatic cells, SYCP2 and TCAM1 (Fig. 2A; Table 3). qRT-PCR showed that SYCP2 and TCAM1 expression were increased >15- and >100,000-fold, respectively, in HPV16+ NIKS-16 relative to HPV16− NIKS cells (Fig. 5A). SYCP2 also was detected at the protein level in NIKS-16 but not NIKS cells (Fig. 5B). Comparative studies with NIKS16ΔE7 cells (Fig. 5A) and in primary cervical keratinocytes with or without HPV16 E6 and/or E7 expression (Fig. 5C) showed that SYCP2 and TCAM1 expression are synergistically up-regulated by E6 and E7.
Figure 5.
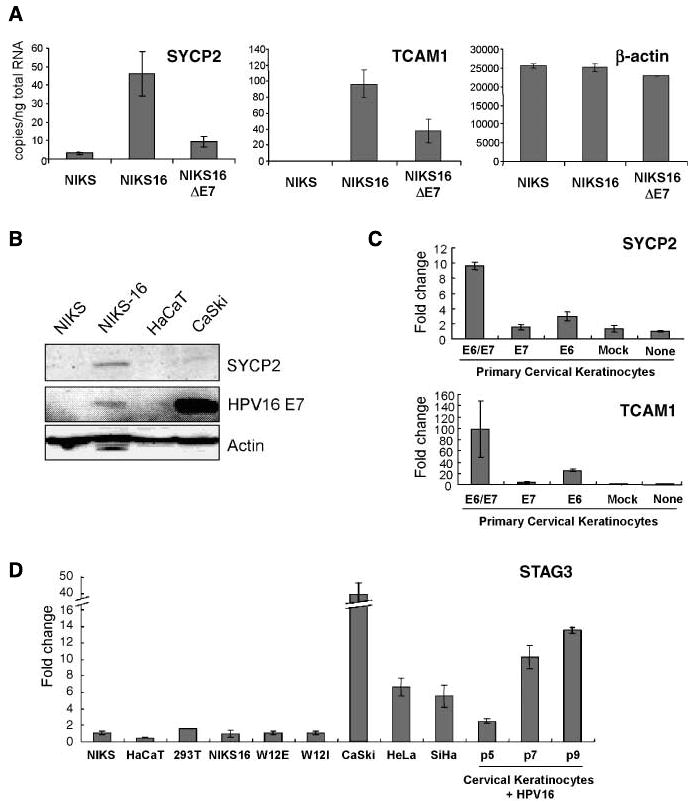
Testis-specific genes SYCP2 and TCAM1 are induced by HPV16. A, real-time qRT-PCR was done with total RNA extracted from NIKS cells with and without HPV16. Also, total RNA from NIKS-16 cells without HPV16 E7 protein expression was used to show that testis-specific gene induction by E7 protein was partial. B, SYCP2 induction in HPV+ cell lines were confirmed with Western blotting using anti-human SYCP2 antibody. Real-time qRT-PCR was done with total RNA extracted from primary cervical keratinocytes with either, or both, HPV16 E6 and E7 delivered by recombinant retrovirus. C, retrovirus without HPV16 gene was used as mock control. D, STAG3 mRNA expression in various cell lines was quantified using qRT-PCR and relative fold change to NIKS cells are plotted. Columns, mean; bars, SD.
A third testis-specific gene up-regulated in HPV+ HNC and cervical cancer relative to HPV− HNC was stromal antigen 3 (STAG3; Table 3). Unlike SYCP2 and TCAM1, STAG3 mRNA was not up-regulated in early passage NIKS-16 relative to NIKS cells nor in early passage HPV+ W12 cells (Fig. 5D). However, in three HPV+ cervical carcinoma cell lines (CaSki, HeLa, and SiHa), STAG3 expression was increased 6- to 40-fold over NIKS. Additionally, we observed passage-dependent increased expression of STAG3 in cervical epithelial cells harboring HPV16 (cervical keratinocytes +HPV16; Fig. 5D). These data suggest that STAG3 induction was not an immediate effect of the virus, but is rather a delayed, passaging-dependent response.
Discussion
Here, we defined molecular differences and similarities among HPV+ HNCs, HPV− HNCs, and cervical cancers. In particular, HPV+ HNC and cervical cancer differentially expressed significant gene sets relative to HPV− HNC, including cell cycle regulatory genes and testis-specific genes with mechanistic, diagnostic, and therapeutic implications. Although current clinical practice does not differentiate HNC treatment based on etiologic differences, our results show that cell cycle deregulation and other underlying characteristics of HPV+ HNCs are greatly dissimilar to HPV− HNCs, but similar to cervical cancers, implying that therapeutic approaches can and should be optimized independently for HPV+ and HPV− cancers.
Up-regulation of cell cycle–related genes in HPV+ HNC and cervical cancer
An important finding of this study is that HPV+ and HPV− cancers differentially express a large subset of cell cycle regulatory genes (Fig. 3A and B). For example, HPV+ cervical cancers and HNCs overexpressed cyclins E and B, whereas HPV− HNCs overexpressed cyclins D and A. A recent study of only HPV+ HNC and HPV− HNC reported only a few of the cell cycle regulators identified here as differentially expressed (8). However, our analysis of microarray data from that study shows that the same subset of cell cycle genes shown in Fig. 3A above were differentially expressed in HPV+ versus HPV− cancers, confirming these results in an independent patient population (Supplementary Fig. S5B). Our experiments in keratinocytes, including cervical epithelial cells, lacking or transfected/transduced with HPV16, confirmed that HPV induced the observed characteristic expression pattern of cell cycle genes (Fig. 3C; Supplementary Fig. S6).
Strikingly, many of the cell cycle regulatory genes overexpressed in HPV+ cancers are known or suspected to be responsive to E2F family transcription factors activated by HPV E7. These include MCMs (32), ORC (36), cdc7 (37), PCNA (38), cdc2 (39), and cyclin A (40). The distinct pattern of cell cycle regulatory gene expression in HPV+ cancers thus likely reflects E7-E2F interactions (34). A role for E7 in up-regulating two of these cell cycle genes (MCM7 and cyclin E) has been shown in a mouse model for HPV-associated cervical cancer (34), and these two E2F-responsive genes are also up-regulated in a new mouse model for HPV-associated HNC (41). Interestingly, in the mouse models for HPV-associated cervical cancer and HNC, E7 dominates over other HPV oncogenes in tumor induction (14).10 Thus, multiple, independent observations imply that the cell cycle deregulation in HPV+ human cancers at least partly reflects E7 action.
Perhaps the most striking difference in cell cycle regulatory gene expression was seen with cyclin D1/CCND1 and p16/Ink4a/CDKN2A. In HPV+ cancers, p16 was expressed at high levels and cyclin D1 at low levels, with the converse in HPV− cancers (Fig. 3A). A recent immunohistochemical study examining just six cell cycle proteins in HNCs confirmed that these changes in p16 and cyclin D1 expression correlate with HPV status and extend to the protein level (42). In HPV+ cancers, p16 up-regulation and cyclin D1 down-regulation are thought to be a consequence of feedback loops from E7 inhibition of Rb activity (43). For many HPV− cancers, including HPV− HNCs (44), reduced p16 expression correlates with p16 promoter hypermethylation, whereas cyclin D1 overexpression is linked to gene amplification (45). p16 repression and cyclin D1 overexpression each predispose mice to multiple cancers, which for cyclin D1 include oral cancers (46).
The distinct expression profile of cell cycle regulatory genes in HPV+ cancers correlated with a higher frequency of PCNA-positive cells (Fig. 4), indicating that HPV+ cancers are more proficient in inducing DNA replication/cell proliferation. Such a virus-induced, highly proliferative state may be responsible for the greater responsiveness of HPV+ HNCs to radiation therapy (15). Overall, these results enhance the potential for E7 inhibition or radiation and anti-DNA replication chemotherapy as treatments for HPV+ cancers.
A subgroup of HPV+ cancers, including HPV+ HNCs and cervical cancers, was distinguished by altered expression of many genes including some associated with B lymphocytes/lymphomas or endothelial cells (Supplementary Fig. S4C; Supplementary Tables S7). Absence of multiple circulating B-cell markers, including CD19, CD20, and immunoglobulins (28), indicated that this signature was not due to infiltrating lymphocytes. Overexpression of cell migration regulator synaptopodin (29) and some other factors suggested that this class might be associated with increased invasiveness. However, because this subgroup α has more non–laser capture microdissection samples (3 of 6) than subgroup β (2 of 10), we cannot exclude the possibility that microdissection contributes to these subgroup-specific gene expression patterns.
Up-regulation of testis-specific genes in HPV+ HNC and cervical cancer
More than 40 testis antigens normally expressed only in germ line cells have been found in tumors, and many have been linked to cancer-related functions in gene expression, apoptosis, cell differentiation, etc. (47). We found that HPV+ cancers overexpress novel testis antigens SYCP2, STAG3, and TCAM1 (Fig. 2A, set III; Table 3). STAG3 and SYCP2, an SYCP1 homologue, are components of the meiotic synaptonemal complex that promotes recombination (48, 49), and SYCP1 expression induces formation of a synaptonemal complex-like structure (50). Aberrant expression of these meiosis-specific proteins in HPV+ cancers may contribute to the genomic instability induced by high-risk HPVs (51) and to further genetic changes during HPV-associated cancer development. The reduced expression of SYCP2 in cervical cancer–derived cell line CaSki, relative to early passage HPV16-positive NIKS cells, may reflect some selective disadvantage to long-term, high-level expression of this meiosis-specific gene, perhaps due to recognition as a tumor-specific antigen or interference with normal cell proliferation.
SYCP2 and TCAM1 were induced by HPV16 in human foreskin keratinocytes and cervical keratinocytes within a few cell passages, and this induction was dependent on E6 and E7 (Fig. 5A and C). TCAM1 (52), in particular, could be a useful biomarker and therapeutic target as it is expressed on the cell surface and thus is directly accessible.
Supplementary Material
Acknowledgments
Grant support: NIH grants CA22443 (P. Ahlquist and P.F. Lambert), CA97944 (P. Ahlquist), DE017315 (P.F. Lambert), CA64364 (M.A. Newton), DE15944 (E.M. Smith), CA078609 (K.T. Kelsey), CA100679 (K.T. Kelsey), and CA101873 (C.D. Woodworth).
We thank Bill Sugden and Allan Hildesheim for critical comments, Henry Pitot and Andreas Friedl for pathology assistance, Adam Steinberg and Leanne Olds for illustration support, Aloysius Klingelhutz (Department of Microbiology, University of Iowa, Iowa City, IA) for providing us HPV-transfected cervical epithelial cells, and the National Disease Research Interchange and Gynecologic Oncology Group for providing some tissue samples as indicated.
Footnotes
Note: Supplementary data for this article are available at Cancer Research Online (http://cancerres.aacrjournals.org/).
P. Ahlquist is an investigator of the Howard Hughes Medical Institute.
Strati and Lambert, personal communication.
References
- 1.Burd EM. Human papillomavirus and cervical cancer. Clin Microbiol Rev. 2003;16:1–17. doi: 10.1128/CMR.16.1.1-17.2003. [DOI] [PMC free article] [PubMed] [Google Scholar]
- 2.Gillison ML, Lowy DR. A causal role for human papillomavirus in head and neck cancer. Lancet. 2004;363:1488–9. doi: 10.1016/S0140-6736(04)16194-1. [DOI] [PubMed] [Google Scholar]
- 3.Smith EM, Ritchie JM, Summersgill KF, et al. Human papillomavirus in oral exfoliated cells and risk of head and neck cancer. J Natl Cancer Inst. 2004;96:449–55. doi: 10.1093/jnci/djh074. [DOI] [PubMed] [Google Scholar]
- 4.Hunter KD, Parkinson EK, Harrison PR. Profiling early head and neck cancer. Nat Rev Cancer. 2005;5:127–35. doi: 10.1038/nrc1549. [DOI] [PubMed] [Google Scholar]
- 5.Chung CH, Parker JS, Karaca G, et al. Molecular classification of head and neck squamous cell carcinomas using patterns of gene expression. Cancer Cell. 2004;5:489–500. doi: 10.1016/s1535-6108(04)00112-6. [DOI] [PubMed] [Google Scholar]
- 6.Cromer A, Carles A, Millon R, et al. Identification of genes associated with tumorigenesis and metastatic potential of hypopharyngeal cancer by microarray analysis. Oncogene. 2004;23:2484–98. doi: 10.1038/sj.onc.1207345. [DOI] [PubMed] [Google Scholar]
- 7.Ginos MA, Page GP, Michalowicz BS, et al. Identification of a gene expression signature associated with recurrent disease in squamous cell carcinoma of the head and neck. Cancer Res. 2004;64:55–63. doi: 10.1158/0008-5472.can-03-2144. [DOI] [PubMed] [Google Scholar]
- 8.Slebos RJ, Yi Y, Ely K, et al. Gene expression differences associated with human papillomavirus status in head and neck squamous cell carcinoma. Clin Cancer Res. 2006;12:701–9. doi: 10.1158/1078-0432.CCR-05-2017. [DOI] [PubMed] [Google Scholar]
- 9.Hebner CM, Laimins LA. Human papillomaviruses: basic mechanisms of pathogenesis and oncogenicity. Rev Med Virol. 2006;16:83–97. doi: 10.1002/rmv.488. [DOI] [PubMed] [Google Scholar]
- 10.Geng Y, Eaton EN, Picon M, et al. Regulation of cyclin E transcription by E2Fs and retinoblastoma protein. Oncogene. 1996;12:1173–80. [PubMed] [Google Scholar]
- 11.Ohtani K, Iwanaga R, Nakamura M, et al. Cell growth-regulated expression of mammalian MCM5 and MCM6 genes mediated by the transcription factor E2F. Oncogene. 1999;18:2299–309. doi: 10.1038/sj.onc.1202544. [DOI] [PubMed] [Google Scholar]
- 12.Thomas M, Pim D, Banks L. The role of the HPV E6 oncoprotein in malignant progression. In: Campo MS, editor. Papillomavirus research. Norfolk (England): Caister Academic Press; 2006. pp. 115–31. [Google Scholar]
- 13.McCance DJ. The biology of the E7 protein of HPV-16. In: Campo MS, editor. Papillomavirus research. Norfolk (England): CaisterAcademic Press; 2006. pp. 133–44. [Google Scholar]
- 14.Riley RR, Duensing S, Brake T, Munger K, Lambert PF, Arbeit JM. Dissection of human papillomavirus E6 and E7 function in transgenic mouse models of cervical carcinogenesis. Cancer Res. 2003;63:4862–71. [PubMed] [Google Scholar]
- 15.Hoffmann M, Gorogh T, Gottschlich S, et al. Human papillomaviruses in head and neck cancer: 8 year-survival-analysis of 73 patients. Cancer Lett. 2005;218:199–206. doi: 10.1016/j.canlet.2004.09.027. [DOI] [PubMed] [Google Scholar]
- 16.Nielsen HB, Wernersson R, Knudsen S. Design of oligonucleotides for microarrays and perspectives for design of multi-transcriptome arrays. Nucleic Acids Res. 2003;31:3491–6. doi: 10.1093/nar/gkg622. [DOI] [PMC free article] [PubMed] [Google Scholar]
- 17.Ihaka R, Gentleman R. R: A language for data analysis and graphics. J Comput Graph Stat. 1996;5:299–314. [Google Scholar]
- 18.Gentleman RC, Carey VJ, Bates DM, et al. Bioconductor: open software development for computational biology and bioinformatics. Genome Biol. 2004;5:R80. doi: 10.1186/gb-2004-5-10-r80. [DOI] [PMC free article] [PubMed] [Google Scholar]
- 19.Irizarry RA, Hobbs B, Collin F, et al. Exploration, normalization, and summaries of high density oligonucleotide array probe level data. Biostatistics. 2003;4:249–64. doi: 10.1093/biostatistics/4.2.249. [DOI] [PubMed] [Google Scholar]
- 20.Efron B, Tibshirani R. An introduction to the bootstrap. New York: Chapman & Hall; 1993. [Google Scholar]
- 21.Storey JD, Tibshirani R. Statistical significance for genomewide studies. Proc Natl Acad Sci U S A. 2003;100:9440–5. doi: 10.1073/pnas.1530509100. [DOI] [PMC free article] [PubMed] [Google Scholar]
- 22.Sengupta S, den Boon JA, Chen IH, et al. Genome-wide expression profiling reveals EBV-associated inhibition of MHC class I expression in nasopharyngeal carcinoma. Cancer Res. 2006;66:7999–8006. doi: 10.1158/0008-5472.CAN-05-4399. [DOI] [PubMed] [Google Scholar]
- 23.Newton MA, Quintana FA, den Boon JA, Sengupta S, Ahlquist P. Random-set methods identify distinct aspects of the enrichment signal in gene-set analysis. Ann Appl Stat. 2007 In press. [Google Scholar]
- 24.Ledoit O, Wolf M. A well-conditioned estimator for large-dimensional covariance matrices. J Multivariate Anal. 2004;88:365–411. [Google Scholar]
- 25.Nelson JH, Hawkins GA, Edlund K, et al. A novel and rapid PCR-based method for genotyping human papillomaviruses in clinical samples. J Clin Microbiol. 2000;38:688–95. doi: 10.1128/jcm.38.2.688-695.2000. [DOI] [PMC free article] [PubMed] [Google Scholar]
- 26.Walboomers JM, Meijer CJ. Do HPV-negative cervical carcinomas exist? J Pathol. 1997;181:253–4. doi: 10.1002/(SICI)1096-9896(199703)181:3<253::AID-PATH755>3.0.CO;2-0. [DOI] [PubMed] [Google Scholar]
- 27.Khan J, Simon R, Bittner M, et al. Gene expression profiling of alveolar rhabdomyosarcoma with cDNA microarrays. Cancer Res. 1998;58:5009–13. [PubMed] [Google Scholar]
- 28.Clark EA, Lane PJ. Regulation of human B-cell activation and adhesion. Annu Rev Immunol. 1991;9:97–127. doi: 10.1146/annurev.iy.09.040191.000525. [DOI] [PubMed] [Google Scholar]
- 29.Asanuma K, Yanagida-Asanuma E, Faul C, Tomino Y, Kim K, Mundel P. Synaptopodin orchestrates actin organization and cell motility via regulation of RhoA signalling. Nat Cell Biol. 2006;8:485–91. doi: 10.1038/ncb1400. [DOI] [PubMed] [Google Scholar]
- 30.Tinker AV, Boussioutas A, Bowtell DD. The challenges of gene expression microarrays for the study of human cancer. Cancer Cell. 2006;9:333–9. doi: 10.1016/j.ccr.2006.05.001. [DOI] [PubMed] [Google Scholar]
- 31.Chung CH, Parker JS, Ely K, et al. Gene expression profiles identify epithelial-to-mesenchymal transition and activation of nuclear factor-{κ}B signaling as characteristics of a high-risk head and neck squamous cell carcinoma. Cancer Res. 2006;66:8210–8. doi: 10.1158/0008-5472.CAN-06-1213. [DOI] [PubMed] [Google Scholar]
- 32.Brake T, Connor JP, Petereit DG, Lambert PF. Comparative analysis of cervical cancer in women and in a human papillomavirus-transgenic mouse model: identification of minichromosome maintenance protein 7 as an informative biomarker for human cervical cancer. Cancer Res. 2003;63:8173–80. [PubMed] [Google Scholar]
- 33.Longworth MS, Wilson R, Laimins LA. HPV31 E7 facilitates replication by activating E2F2 transcription through its interaction with HDACs. EMBO J. 2005;24:1821–30. doi: 10.1038/sj.emboj.7600651. [DOI] [PMC free article] [PubMed] [Google Scholar]
- 34.Arroyo M, Bagchi S, Raychaudhuri P. Association of the human papillomavirus type 16 E7 protein with the S-phase-specific E2F-cyclin A complex. Mol Cell Biol. 1993;13:6537–46. doi: 10.1128/mcb.13.10.6537. [DOI] [PMC free article] [PubMed] [Google Scholar]
- 35.Flores ER, Allen-Hoffmann BL, Lee D, Lambert PF. The human papillomavirus type 16 E7 oncogene is required for the productive stage of the viral life cycle. J Virol. 2000;74:6622–31. doi: 10.1128/jvi.74.14.6622-6631.2000. [DOI] [PMC free article] [PubMed] [Google Scholar]
- 36.Asano M, Wharton RP. E2F mediates developmental and cell cycle regulation of ORC1 in Drosophila. EMBO J. 1999;18:2435–48. doi: 10.1093/emboj/18.9.2435. [DOI] [PMC free article] [PubMed] [Google Scholar]
- 37.Yamada M, Sato N, Taniyama C, Ohtani K, Arai K, Masai H. A 63-base pair DNA segment containing an Sp1 site but not a canonical E2F site can confer growth-dependent and E2F-mediated transcriptional stimulation of the human ASK gene encoding the regulatory subunit for human Cdc7-related kinase. J Biol Chem. 2002;277:27668–81. doi: 10.1074/jbc.M202884200. [DOI] [PubMed] [Google Scholar]
- 38.Thacker SA, Bonnette PC, Duronio RJ. The contribution of E2F-regulated transcription to Drosophila PCNA gene function. Curr Biol. 2003;13:53–8. doi: 10.1016/s0960-9822(02)01400-8. [DOI] [PubMed] [Google Scholar]
- 39.Furukawa Y, Terui Y, Sakoe K, Ohta M, Saito M. The role of cellular transcription factor E2F in the regulation of cdc2 mRNA expression and cell cycle control of human hematopoietic cells. J Biol Chem. 1994;269:26249–58. [PubMed] [Google Scholar]
- 40.Skoczylas C, Henglein B, Rundell K. PP2A-dependent transactivation of the cyclin A promoter by SV40 ST is mediated by a cell cycle-regulated E2F site. Virology. 2005;332:596–601. doi: 10.1016/j.virol.2004.12.017. [DOI] [PubMed] [Google Scholar]
- 41.Strati K, Pitot HC, Lambert PF. Identification of biomarkers that distinguish HPV-positive versus HPV-negative head and neck cancers in a mouse model. Proc Natl Acad Sci U S A. 2006;103:14152–7. doi: 10.1073/pnas.0606698103. [DOI] [PMC free article] [PubMed] [Google Scholar]
- 42.Li W, Thompson CH, Cossart YE, et al. The expression of key cell cycle markers and presence of human papillomavirus in squamous cell carcinoma of the tonsil. Head Neck. 2004;26:1–9. doi: 10.1002/hed.10335. [DOI] [PubMed] [Google Scholar]
- 43.Khleif SN, DeGregori J, Yee CL, et al. Inhibition of cyclin D-CDK4/CDK6 activity is associated with an E2F-mediated induction of cyclin kinase inhibitor activity. Proc Natl Acad Sci U S A. 1996;93:4350–4. doi: 10.1073/pnas.93.9.4350. [DOI] [PMC free article] [PubMed] [Google Scholar]
- 44.Kraunz KS, Hsiung D, McClean MD, et al. Dietary folate is associated with p16(INK4A) methylation in head and neck squamous cell carcinoma. Int J Cancer. 2006;119:1553–7. doi: 10.1002/ijc.22013. [DOI] [PubMed] [Google Scholar]
- 45.Bartkova J, Lukas J, Muller H, Strauss M, Gusterson B, Bartek J. Abnormal patterns of D-type cyclin expression and G1 regulation in human head and neck cancer. Cancer Res. 1995;55:949–56. [PubMed] [Google Scholar]
- 46.Opitz OG, Harada H, Suliman Y, et al. A mouse model of human oral-esophageal cancer. J Clin Invest. 2002;110:761–9. doi: 10.1172/JCI15324. [DOI] [PMC free article] [PubMed] [Google Scholar]
- 47.Simpson AJ, Caballero OL, Jungbluth A, Chen YT, Old LJ. Cancer/testis antigens, gametogenesis and cancer. Nat Rev Cancer. 2005;5:615–25. doi: 10.1038/nrc1669. [DOI] [PubMed] [Google Scholar]
- 48.Offenberg HH, Schalk JA, Meuwissen RL, et al. SCP2: a major protein component of the axial elements of synaptonemal complexes of the rat. Nucleic Acids Res. 1998;26:2572–9. doi: 10.1093/nar/26.11.2572. [DOI] [PMC free article] [PubMed] [Google Scholar]
- 49.Prieto I, Suja JA, Pezzi N, et al. Mammalian STAG3 is a cohesin specific to sister chromatid arms in meiosis I. Nat Cell Biol. 2001;3:761–6. doi: 10.1038/35087082. [DOI] [PubMed] [Google Scholar]
- 50.Ollinger R, Alsheimer M, Benavente R. Mammalian protein SCP1 forms synaptonemal complex-like structures in the absence of meiotic chromosomes. Mol Biol Cell. 2005;16:212–7. doi: 10.1091/mbc.E04-09-0771. [DOI] [PMC free article] [PubMed] [Google Scholar]
- 51.Duensing S, Munger K. Mechanisms of genomic instability in human cancer: insights from studies with human papillomavirus oncoproteins. Int J Cancer. 2004;109:157–62. doi: 10.1002/ijc.11691. [DOI] [PubMed] [Google Scholar]
- 52.Ono M, Nomoto K, Nakazato S. Gene structure of rat testicular cell adhesion molecule 1 (TCAM-1), and its physical linkage to genes coding for the growth hormone and BAF60b, a component of SWI/SNF complexes. Gene. 1999;226:95–102. doi: 10.1016/s0378-1119(98)00524-1. [DOI] [PubMed] [Google Scholar]
- 53.Zhang D, Pier T, McNeel DG, Wilding G, Friedl A. Effects of a monoclonal anti-αvβ3 integrin antibody on blood vessels—a pharmacodynamic study. Invest New Drugs. 2007;25:49–55. doi: 10.1007/s10637-006-9013-8. [DOI] [PubMed] [Google Scholar]
Associated Data
This section collects any data citations, data availability statements, or supplementary materials included in this article.