

Abstract
Bats are highly social and spend much of their lives echolocating in the presence of other bats. To reduce the effects of acoustic interferences from other bats' echolocation calls, we hypothesized that bats might shift the timing of their pulse emissions to minimize temporal overlap with another bat's echolocation pulses. To test this hypothesis we investigated whether free-tailed bats (Tadarida brasiliensis) echolocating in the lab would shift the timing of their own pulse emissions in response to regularly repeating artificial acoustic stimuli. A robust phase-locked temporal pattern in pulse emissions was displayed by every bat tested which included an initial suppressive phase lasting more than 60 ms after stimulus onset, during which the probability of emitting pulses was reduced by more than fifty percent, followed by a compensatory rebound phase, the timing and amplitude of which were dependent on the temporal pattern of the stimulus. The responses were non-adapting and were largely insensitive to broad changes in the acoustic properties of the stimulus. Randomly occurring noise-bursts also suppressed calling for up to 60 ms, but the time-course of the compensatory rebound phase was more rapid than when the bats were responding to regularly repeating patterns of noise bursts. These findings provide the first quantitative description of how external stimuli may cause echolocating bats to alter the timing of subsequent pulse emissions.
Keywords: echolocation, animal communication, vocalization, noise, bat, acoustic masking
Introduction
Bats are highly social and spend much of their lives echolocating in the presence of other bats, but echolocation is susceptible to the degrading influences of acoustic interference, especially from conspecific vocalizations (Arlettaz et al. 2001; Jones 2008). Bats are known to make subtle shifts in the acoustic structure of their echolocation pulses (Bates et al. 2008; Gillam et al. 2007; Obrist 1995) to help distinguish their own echoes from those of other bats, but it is unknown whether bats also possess mechanisms for coordinating the timing of their pulse emissions with their neighbors to minimize acoustic overlap. Many types of animals are known to regulate the timing of their vocalizations to avoid acoustic interference, including frogs (Loftus-Hills 1974; Moore et al. 1989; Zelick and Narins 1985), birds (Brumm 2006; Ficken and Ficken 1974; Knapton 1987; Planque and Slabbekoorn 2008), and primates (Egnor et al. 2007). Although echolocation serves a different function than other forms of vocal communication, it is possible that when bats are echolocating in groups they too possess mechanisms for minimizing acoustic overlap in time.
Many species of bats live in large, dense colonies and may even forage together at prime hunting grounds. Free-tailed bats (Tadarida brasiliensis) partially mitigate the confounding effects of acoustic interference from other bats by either calling louder (Simmons et al. 1978; Tressler and Smotherman 2009) or by changing the spectral parameters of their echolocation pulses in a behaviour known as the jamming avoidance response (Gillam et al. 2007; Tressler and Smotherman 2009; Ulanovsky et al. 2004), but these adaptations may be energetically costly, are constrained by laryngeal mechanics, and may require the bats to alter pulse characteristics away from the optimal acoustic values for foraging and navigation. Temporal strategies for echolocating in concert with other bats would have the benefit of allowing bats to continue to use optimized pulse acoustics without necessarily increasing energy expenditure. The beneifits of any such pulse timing mechanisms would probably be minimal in the presence of large numbers of echolocating bats, but that would also be true of the jamming avoidance response. However, the use of temporal shifts in pulse timing performed in addition to the free-tailed bat's jamming avoidance response might offer more comprehensive and flexible solutions to the problem of echolocating within the context of small groups of bats.
Here we present the results of a study in which we characterized how bats coordinated the timing of their echolocation pulses with different types and temporal patterns of artificial acoustic stimuli. First, we tested the hypothesis that free-tailed bats would shift the timing of their echolocation pulse emissions to minimize overlap with a regularly repeating artificial stimulus, and furthermore that the behavior would vary depending on the temporal dynamics of the stimulus. Secondly we tested the hypothesis that the bats may respond differently to regularly repeating stimuli versus randomly occurring stimuli, which would reflect the role of short-term memory in the vocal control circuitry. Thirdly we examined the bats' vocal responses to more complex patterns of temporal stimuli by analyzing their vocal timing in response to either a simple paired-pulse temporal pattern or an extended rapid pulse train that mimicked the so-called feeding buzzes uttered by bats during prey capture, territorial displays and agonistic encounters. Finally we tested whether key features of the acoustic structure of the stimulus, bandwidth and duration, influenced the bats' vocal responses to the stimuli. The results provide the first evidence of a mechanism by which bats may shift the timing of their pulses in response to external acoustic stimuli, including the echolocation pulses of other nearby bats.
Methods
Animals and Experimental Procedure
Fifteen male and five female adult Mexican free-tailed bats (Tadarida brasiliensis Mexicana) permanently housed in the Texas A&M Department of Biology bat research vivarium were used for this study. All the bats had been captured locally and held in captivity for at least six months. All husbandry and experimental procedures were in accordance with National Institutes of Health guidelines for experiments involving vertebrate animals and were approved by the local Institutional Animal Care and Use Committee (protocol #2007-254). Bats were kept on a reverse day/night light cycle (14 hours on/10 hours off) with the lights going off at 12:00 noon. Temperature and humidity within the vivarium were automatically regulated to simulate local natural conditions. Fresh food and water was provided just before noon daily and the bats normally emerged from their artificial roosts within 30 minutes of the lights going out, flew to feeding stations and fed themselves on a diet of mealworms supplemented with essential vitamins and minerals. The bats typically became active within their roosts one to two hours before noon. All experiments were conducted during the time of day when the bats were normally most active within the vivarium (10am-2pm), and bats always received food after completion of each days experimental trials. All experiments were performed with the lights off.
The complete series of experiments described here took place over a two-year period during which groups of five to ten bats at a time were separated from the main colony and kept in small holding cages (12 square feet) for one to two week periods of behavioral testing before being returned to the main colony. This was done because free-tailed bats remain healthier in captivity when they can fly on a daily basis and are allowed to live in self-defined social groups. Bats used in experiments were marked for identification and tracking before being returned to the colony between experiments. Ten bats were chosen at random from the overall total of 20 subjects for each experiment. Thus, while all individuals contributed to two or more different experiments, the same ten bats were not used in all experiments.
During experimental trials the bats were placed in a 10×10×20cm cage composed of 0.25″ plastic-coated steel mesh that was then set on a small platform in the center of a warm (30°C, a typical local temperature outside at night) anechoic recording chamber and left alone for the duration of the recording session (typically one hour). Each animal was habituated to the handling procedures, cage and recording chamber by having them undergo a series of a least three recording sessions on separate days that mimicked the conditions of the experimental trials. These habituating recording sessions were used to obtain preliminary data about the acoustic properties of each bat's echolocation pulses and to screen for individuals that were unlikely to vocalize consistently enough to complete the experimental trials. Prior to each experimental trial the bats were placed in the recording chamber and given roughly 20 minutes to become accustomed to the chamber's climate before initiating recordings. During experimental trials a series of acoustic stimuli were played to bats while all echolocation pulses were recorded. All subsequent analyses investigated the temporal relationship between the timing of each emitted pulse and the immediately preceding acoustic stimulus. The null hypothesis was that the timing of pulse emissions was unaffected by the presentation of an acoustic stimulus. Under this hypothesis the probability of a pulse being emitted at any time between stimuli is random and thus should be equiprobable with sufficient sampling. Instantaneous pulse rates were highly variable during experiments, and so preliminary trials were used to determine the sample size required to reliably detect a significant deviation of responses to repeated noise stimuli from a random distribution of stimulus-pulse intervals under control conditions (described below). Based on this preliminary data a minimum of 20 minutes and 1000 pulses per bat per stimulus condition were used.
Acoustic Apparatus
All acoustic stimuli were generated digitally with Tucker-Davis Technology (TDT) system III hardware and the OpenEX software v5.4. Stimuli were played through a Sony amplifier (model # STR-DE598) driving a 4-speaker array composed of 2 Pioneer Ribbon Tweeters (ART-55D/301080) and 2 Pioneer Rifle Tweeters (ART-59F/301081) juxtaposed and oriented towards the cage holding the bat. The speakers provided a flat (±3 dB) output of 85 dB SPL over the range of 15 to 60 kHz recorded at the position of the bat. The bats' echolocation pulses ranged in intensity from 90 to 115 dB SPL, as measured by a Bruel & Kjær free-field ¼″ microphone (Type 4939) placed just outside the cage and surrounded by a cone of acoustic foam which was oriented to minimize the recorded amplitude of the stimuli relative to the bat's pulses. Incoming signals were digitized with a National Instruments DAQmx card, NI PCI-6251 (200 kHz, 16 bit sample rate), viewed in real time with Avisoft Recorder v3.0, and stored on the computer hard drive for subsequent analysis. On a separate computer both the recorded bat pulses, recorded stimuli and digital time stamps issued by the TDT hardware at the onset of each stimulus were stored on separate channels for analysis with the hardware and software package Datapak 2K2 (Run Technologies, Mission Viejo, CA). Transmission delays between the TDT system's output and the actual recordings of sound stimuli at the microphone (4.4 ms) were accounted for in post-hoc analyses. Echolocation pulses were automatically separated from the simultaneously recorded acoustic stimulus based on differences in amplitude and duration: bat pulses were on average 20 dB louder than the stimulus at the microphone and were of shorter duration than the stimuli (mean ± s.e. bat pulse duration was 4.67 ± 0.38 ms, n=10 bats, 300 pulses per bat). Experiments were conducted on individually isolated bats under conditions that made the use of communication calls by subjects highly unusual. Communication calls are easily detected since they are significantly longer than echolocation pulses (Bohn et al. 2008), and we found no communication calls during a manual review of the acoustic recordings obtained during the experiments. Thus, communication calls did not contribute in any way to the subsequent results or their interpretation.
Experimental procedures
We first sought to establish whether free-tailed bats changed the timing of their pulse emissions in response to regularly repeating noise stimuli, and if so to characterize the general nature of that response. Pilot studies indicated that a noise burst could cause a shift in the timing of a single echolocation pulse (Fig. 1A), but the effect was variable and it occurred to us that the nature and magnitude of the effect could depend on precisely when the noise burst appeared relative to the bat's endogenous rhythms. Since we could not predict when bats would emit pulses, we adopted the strategy of using regularly repeating stimuli and analyzing when the bats emitted pulses relative to the appearance of each preceding noise burst (illustrated in Fig. 1B). Normally the temporal pattern of a free-tailed bat's pulse emissions reflect an endogenous periodicity dictated by its respiratory rhythms; control experiments were therefore carried out to determine if a combination of the bats naturally periodic pulse emissions and a periodic stimulus could randomly result in the appearance of a relationship where none actually existed. In the short term this is likely to occur once in a while, but because the bats call discontinuously with frequent starts and stops, the probability of observing a significant association between breathing and the timing of the computer-generated pulses would be become increasingly unlikely with longer recording times. For the control trials we activated the stimulus generating software, recorded bat vocalizations, and performed the experiments as usual except that the speaker amplifier was turned off and no sounds were generated from the speakers. Control data consistently showed that after sufficient sampling (>1000 pulses), pulses were equally distributed over time and there was no correlation between the timing of the bats' pulses and the temporal pattern of the stimulus with the speaker turned off (Fig. 2A).
Figure 1.

A) Spectrogram of a series of Tadarida brasiliensis echolocation pulses interrupted by a single 10 ms band-limited noise burst. The pulses shown here include three prominent harmonic components, but the stimulus was designed to overlap with just the lowest harmonic, which is typically the loudest. B) Example of the experimental protocol used in this study: echolocation pulses from individual bats were recorded while the bat was exposed to noise bursts occurring at varied intervals, and subsequently the timing of the bat's pulses relative to each preceding stimulus was assessed with a post-stimulus time histogram.
Figure 2.
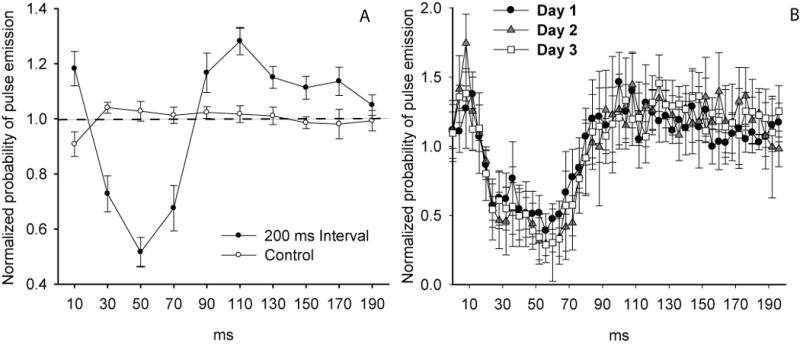
A) Normalized probability of pulses being emitted within successive time bins spanning the 200 ms time window between successive 10 ms noise bursts repeated at 5 Hz for 20 minutes, and controls. Control data reflect experimental results collected with the stimulus speakers turned off. Data were normalized so that a value of one represents random chance (equal probability at every bin). Mean ± s.e. bin values falling below one indicate that pulse emissions were suppressed below what was expected due to random chance and values above one indicate that pulse emissions occurred more frequently that expected. N=10 bats. B) Average data for three bats tested on three successive days with the same stimulus as in A (4 ms bins).
To investigate the effects of external acoustic stimuli on the temporal patterns of pulse emissions, we conducted four different experiments that incorporated a total of 12 different stimuli including a control (Table 1).
Table 1.
Summary of stimuli used in the four main experiments
| Stimulus type | Repetition interval (ms) |
Stimulus duration (ms) |
Experiment 1 (0–50 ms) |
Experiment 1 (50–100 ms) |
Experiment 2 | Experiment 3 | Experiment 4 |
|---|---|---|---|---|---|---|---|
| Control-none | — | — | X | X | |||
| Noise burst | 50 | 10 | X | ||||
| Noise burst | 100 | 10 | X | X | |||
| Noise burst | 200 | 10 | X | X | X | X | X |
| Noise burst | 1000 | 10 | X | X | X | ||
| Noise burst | Random* | 10 | X | ||||
| Paired-pulse | 50, 200† | 10, 10 | X | ||||
| Buzz | 500 | 200 | X | ||||
| Noise burst | 200 | 5 | X | ||||
| Noise burst | 200 | 25 | X | ||||
| Noise burst | 200 | 50 | X | ||||
| 25 kHz tone | 200 | 20 | X |
The interval between ‘random’ noise bursts varied continuously over a range of 200 to 1000 ms.
The paired-pulse stimulus consisted of two 10 ms noise bursts separated by 50 ms and repeated together every 200 ms.
Experiment 1 tested whether bats modified the temporal pattern of their echolocation pulses differently in response to acoustic stimuli presented at different rates. The stimulus consisted of a continuous train of 10 ms “noise bursts“ repeated every 50, 100, 200 or 1000 ms with intervening time periods of silence. Noise bursts were produced by digitally band-pass filtering white noise to a range of 20 to 45 kHz, which completely overlaps with the frequency range of the most prominent harmonic component of the free-tailed bat's echolocation pulses. Onset and offset of all stimuli were gated with a 0.1 ms rise/fall time. Each bat was exposed to only one of the four stimulus repetition rates during a trial (one trial per day) and the order in which bats were exposed to the different stimuli was varied pseudo-randomly.
Experiment 2 tested whether the regularity of the intervals between signals influenced the bats temporal patterns of pulse emissions by measuring the responses to noise bursts presented at randomly varying inter-stimulus intervals. As in experiment 1, the stimulus consisted of a 10 ms noise burst, however instead of fixed repetition intervals, the intervals were randomly varied between 200 to 1000 ms. The range of intervals was constrained to allow for a statistical comparison between the response to these semi-random intervals versus the responses to regular repeating intervals of 200 and 1000 ms, and because longer intervals required impractically long recording times.
Experiment 3 examined how the bats respond to stimuli with more complex temporal patterns. The first complex stimulus consisted of a “paired-pulse” stimulus in which two 10 ms noise bursts separated by 50 ms were initiated every 200 ms. The second stimulus was an artificially generated pulse train mimicking the feeding “buzzes” used by bats during the final stage of prey capture. The artificial buzzes consisted of trains of 15 downward-sweeping frequency-modulated (FM) sounds (45 to 20 kHz, 8 to 4 ms duration) that shortened in duration and increased in repetition rate similar to natural patterns recorded in the field (Schwartz et al. 2007). The buzz stimulus was 200 ms long and was repeated every 500 ms.
Experiment 4 tested whether the duration or bandwidth of the stimulus influenced the temporal patterns of the bats' vocal response. All stimuli were repeated every 200 ms, since this repetition rate elicited a maximal response. Stimuli were noise bursts with durations of 5, 10, 25 and 50 ms, and a 25 kHz, 20 ms long pure tone. The pure tone stimulus was used to test whether bandwidth affected the nature or magnitude of the response. Twenty-five kHz and 20 ms duration were used because it approximates the acoustic structure of one of the most common classes of communication syllables used by this species (Bohn et al. 2008) and because 25 kHz is centered within the most sensitive bandwidth of the bats auditory system (Pollak et al. 1978). We did not examine the effects of changing stimulus frequency or amplitude on the bats' temporal responses because it was assumed that any changes in the behavior caused by changes in these parameters would necessarily reflect the physiological properties of the auditory system (Pollak et al. 1978).
As a last test we provide an illustration of how ten bats responded to an artificially-generated downward FM-sweep stimulus designed to mimic the most prominent harmonic of the free-tailed bats' echolocation pulses. These FM-sweep stimuli swept downward from 45 kHz to 20 kHz over a period of 5 ms. The bats were tested separately with both the FM-sweep stimulus and with a standard 10 ms noise burst stimulus, and both stimuli were presented at a rate of 5 Hz. Because our analysis software was unable to reliably discriminate the bats' pulse emissions from the FM-sweep presentations, pulse counts from the first 8 ms after each stimulus onset (2 × 4ms time bins) had to be excluded, which precluded this data set from being directly compared with the other data sets in the statistical analyses.
Statistical Analysis
Post-stimulus time histograms (PSTHs) were used to quantify and illustrate the proportion of pulses occurring in successive blocks of time (time bins) relative to each preceding stimulus. We tested for stimuli effects using repeated measures analysis of variance (ANOVA) models on the percent of calls per bat in each time bin with stimulus type as an effect and stimulus type by time bin as an interaction effect. The interaction effect of bin and stimulus was the primary target of ANOVA analyses, as this provided an indication of whether the distribution of pulses across bins differed significantly among conditions. For experiment 1 we ran two tests because different intervals resulted in different ranges in bins. First we examined the 50 ms interval stimulus with the first 50 ms of the 100 ms, 200 ms, 1000 ms and control stimuli. Then we examined the 50 -100 ms range of the 100 ms, 200 ms, 1000 ms and control stimuli. For these comparisons we used 4 ms bin widths, which resulted in 13 time bins. The remaining analyses (experiments 2,3 and 4), were conducted on the 0 - 200 ms post-stimulus time range, and so we used 20-ms time bins for all of the statistical analyses (n = 10 time bins). Because the 200 ms interval stimuli were used in comparisons in all four experiments we used a Bonferroni adjustment resulting in an alpha (α) of 0.0125. We used least squares contrasts for specific comparisons and additionally adjusted alpha accordingly. In those cases alpha is provided, otherwise α = 0.0125.
For presentation purposes PSTH bin counts were normalized such that a value of 1.0 equaled the predicted mean number of pulses per bin in the absence of stimuli (i.e. random chance). For example, for a PSTH comprised of 50 bins the random average number of pulses per bin is expected to be 2.0% of the total number of pulses recorded during the experimental trial, thus experimental data were normalized by dividing actual bin percentages by 2%. Normalization facilitated comparisons across data produced using different stimulus intervals or analyzed with different bin numbers and widths. All data are presented as means ± standard deviations. All statistical procedures were performed utilizing SAS v9.2 and SAS-JMP 8.0 (SAS Institute Inc, Cary, NC).
Results
Characterizing the basic nature of the bats' temporal responses to noise stimuli
Figure 2A presents the averaged response plot from ten individual bats responding to 10 ms noise burst stimuli presented at 200 ms intervals. This regularly-repeating noise stimulus evoked a complex probability waveform that included a rapid suppression of calling that reached its lowest value between 40 and 60 ms after the stimulus onset, followed by a compensatory increase in the probability of calling that peaked 100-120 ms after stimulus onset. The compensatory peak was followed by a sustained increase in probability of calling above random chance that was sustained throughout the second 100 ms of the silent interval. We typically observed a slight increase in the number of pulses during the first 20 ms following stimulus onset which we attributed to a phase lag in the compensatory response to the prior stimulus and not an immediate response to the most recent stimulus, since a similar increase in pulse emission probability was not commonly observed in the response to stimuli separated by longer intervals. Pulse rates varied among bats from 3.3 to 6.1 pulses per second for the duration of the 20 minute recordings (4.7±1.2 Hz, n=10 bats) but we uncovered no evidence that pulse rate influenced our measurements of the behavior. These results led us to conclude that the repetitive noise stimulus clearly appeared to modify the timing of the bats echolocation pulse emissions in a consistent and reliable way across all bats, which was confirmed statistically in experiment 1.
The time course and the relative degree of pulse suppression are key metrics of the behavior, so we used histograms with 4 ms bins to provide a detailed temporal analysis of the behavior. The depression in pulse emission probability appeared to begin roughly 10 to 15 ms after stimulus onset, but the probability of emitting pulses didn't fall below one standard deviation of the controls until the seventh 4 ms bin (24-28 ms), and remained lower than expected until the 20th 4 ms bin (76-80 ms). The relative probability of emitting a pulse reached its lowest mean value at bin 15 (56-60 ms), indicating that the likelihood of a bat emitting a pulse within this time bin was reduced by an average of ≈55% if a noise burst had occurred approximately 56-60 ms earlier. The magnitude of this effect was consistently in the range of 40-60% across all bats, although in one individual the suppressive effect was greater than 80% at 60 ms. The period of pulse suppression was followed by a compensatory increase in the number of pulses emitted above random chance which began with bin 26 (100 to 104 ms) and peaked at bin 28 (108-112 ms), at which point the relative probability of emitting a pulse was increased by roughly 34% above random chance, and after which pulse emissions gradually returned to baseline levels.
Before beginning experiments 1 through 4, we examined the possibility that repeated exposure to the same stimuli might alter the bats performance, which might in turn constrain our ability to use the same bats for multiple experiments. The averaged response plots shown in figure 2B depict the performance of three naïve bats tested with the 200 ms interval stimulus on three consecutive days. The performances of these three bats appeared qualitatively identical to the mean performance of the ten bats shown in figure 2A, and their performance was highly consistent across all three days. We found no statistically significant change in their responses across all three days (repeated-measures ANOVA, bin × day interaction, F8, 58 = 1.13, P = 0.37), indicating that repeated exposure did not significantly alter the bats' behavior in the presence of the stimulus.
Experiment 1. Effect of stimulus repetition rate on pulse emission patterns
Experiment 1 tested whether the bats' responses to regularly repeating noise bursts would vary with different stimulus intervals. Identical experiments were performed using 10 ms noise bursts separated by silent intervals of 50,100, 200 and 1000 ms intervals (20, 10, 5 and 1 Hz, respectively). Statistical comparisons of the bats' pulse emission patterns just over the first 50 ms post-stimulus across all repetition rates and controls (no stimuli) revealed that stimulus and repetition rate caused the bats to call differently during that time span (repeated measures ANOVA, F48,133,74=2.6, p < 0.00010007). Comparison of the distribution of pulses within the second 50 ms of the 100, 200 and 1000 ms interval stimuli and controls also confirmed that stimulus repetition rate had a significant effect on the distribution of pulses during this time span as well (repeated measures ANOVA, F33,77 = ,34)=4.8, p < =0.0001). Post-hoc comparisons of all stimuli versus controls were significant for the first 50 ms (F12, 34 = 3.5, P = 0.002, α = 0.008) and second 50 ms (F11, 26 = 8.0, P < 0.0001, α = 0.008). Collectively these results confirm the observation made in figure 2 that bats modify emission patterns in the presence of noise bursts and demonstrate that the bats displayed different temporal patterns of pulse emissions when presented with the same noise stimulus reoccurring at different repetition rates.
Figure 3A illustrates the mean responses of ten bats to the 50 ms interval stimulus, and figure 3D illustrates and compares how the bats responded differently to the 50, 100 and 200 ms interval stimuli. The bats' responses to the three different stimulus rates were qualitatively different during the first 50 ms in that the probability of calling was increased in between each burst of noise in response to the 50 ms interval stimulus but showed an initial decrease when responding to the 100 and 200 ms interval stimuli. For the 50 ms interval stimulus, pulse emission probabilities fell below expected values immediately preceding and during the stimuli, indicating that the bats pulse emissions were more frequent between the noise bursts than during the noise bursts. Although evidence of phase-locking is apparent within the data (figure 3 B illustrates one individual example), the average depth of modulation was relatively shallow. Never the less a clear trend towards calling out of phase with the stimulus was observed in all ten bats, and the pattern was visibly different from the first 50 ms of the response to stimuli presented at 100 and 200 ms intervals. The response to the 100 ms interval stimuli (figure 3 C & D) appeared as an intermediate between the responses to the 50 ms and 200 ms stimuli. The 100 ms interval stimuli evoked a suppressive period that initially followed a time-course similar to that observed for the 200 ms interval data, but with a shallower depth and the following rebound phase was initiated earlier than in the 200 ms interval data.
Figure 3.
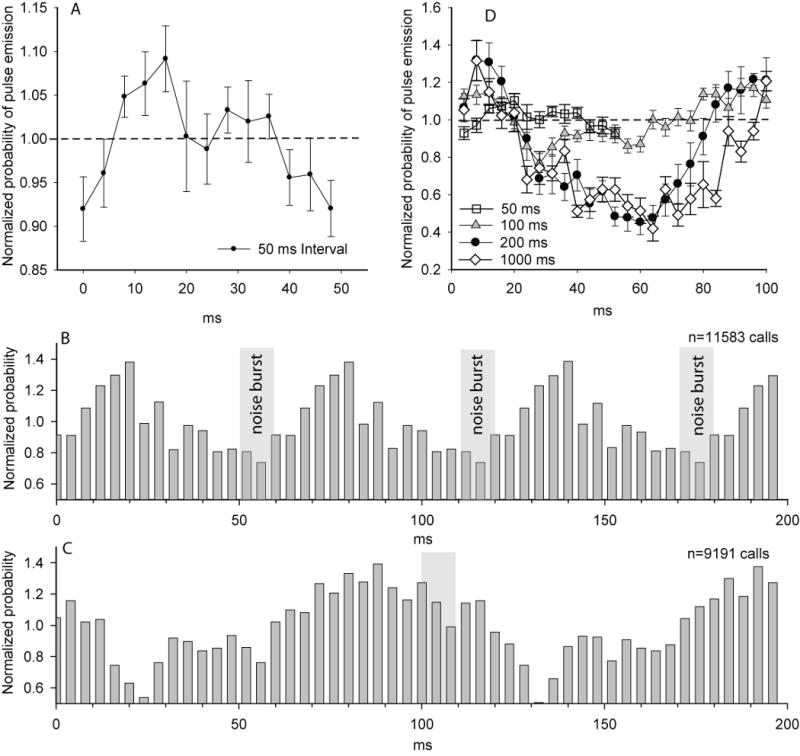
A) Average response plots for ten bats calling in the presence of a 10 ms noise burst repeated at 50 ms intervals (mean s± s.e.). A representative example of an individual response is shown in B, except that a 200 ms PSTH with 4 ms bins was used to emphasize what appears to be a phase relationship between the 50 ms interval stimulus and temporal pattern of pulse emissions. C provides a similar example of an individual bat calling in the presence of a noise burst repeated with 100 ms silent intervals. D) Compares the mean ± s.e. data from all ten bats responding to noise bursts presented at four different stimulus presentation rates (only the first 100 ms of the longer intervals are shown).
Experiment 2: Effects of random versus predictable stimulus intervals
Figure 4A compares the mean response plots for 10 bats presented with semi-randomly occurring noise bursts versus their responses to regularly-repeating 200 and 1000 ms stimulus intervals. A repeated-measures ANOVA indicated a significant difference among the responses to random, 200 ms and 1000 ms interval stimuli (F18,38= 3.6, P = <0.0005). In response to the randomly varying interval stimuli, the lowest probability of calling occurred at approximately 50 ms post-stimulus, followed by a compensatory increase in the probability of calling which peaked at approximately 90 ms, and ended with a rapid return to random chance. Compared to the 200 ms and 1000 ms interval stimuli, the random stimuli resulted in an earlier compensatory peak and a more rapid return to random expectations following the peak (Fig. 4A). Thus although the response to semi-random stimuli was similar to the 200 ms interval results, it visibly differed from the response to 200 ms intervals in much the same way that the 100 ms interval stimuli differed from the 200 ms interval stimuli, namely that the suppression appeared more shallow and the compensatory response occurred earlier.
Figure 4.
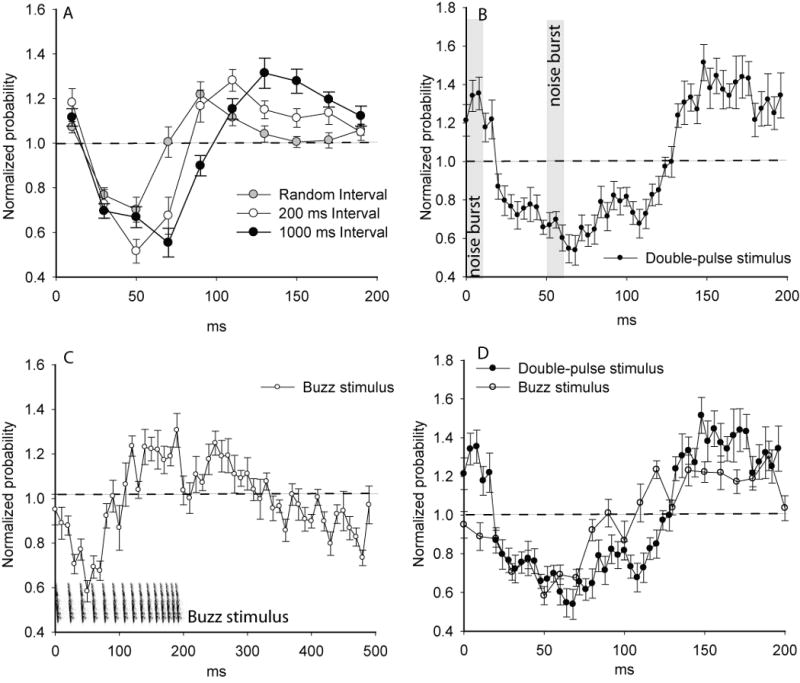
A) A comparison of the mean ± s.e response to a semi-random interval stimulus versus the responses to regularly repeating noise bursts presented at either 200 or 1000 ms intervals. B) Mean response plots of ten bats listening to a paired-pulse stimulus consisting of two identical noise bursts separated by 50 ms and repeated every 200 ms. C) Mean ± s.e response of ten bats calling in the presence of an artificial buzz stimulus consisting of 15 frequency-modulated pulses spread over a 200 ms period and repeated every 500 ms (stimulus illustrated in C). D) A comparison of the paired-pulse stimulus data in B versus the first 200 ms of the buzz-stimulus data in C.
Experiment 3: Effects of more complex stimulus patterns on pulse emission patterns
To explore the question of how bats would respond to more complex temporal patterns of stimulus presentations, we compared the bats' responses to three stimuli: A) the regularly repeating 200 ms silent interval noise burst stimuli, B) a “paired-pulse” stimulus, in which a pair of pulses separated by 50 ms were presented every 200 ms for 20 minutes, and C) an artificial “buzz” stimulus (described in methods). Comparing responses over the 200 ms time span immediately following the onset of each stimulus we found significant differences among the average responses to the three stimuli (repeated measures ANOVA, F18,38=4.6, P<0.0001). The 200 ms interval stimuli differed significantly from the two more complex stimuli (post-hoc comparison, F9, 19 = 3.1, P = 0.0003, α = 0.008); both the paired pulse and buzz stimuli increased the duration of the suppression phase (Fig. 4A, D). While the first 50 ms of the response to the paired-pulse stimulus was similar to the first 50 ms of the regular (single noise burst) 200 ms interval stimulus, the arrival of the second pulse at 50 ms postponed the timing of the compensatory rebound in pulse emission probabilities by approximately an additional 50 ms. Notably, the second stimulus did not suppress pulse emissions below that which had occurred in response to the first stimuli. It is also noteworthy that the bats apparently did not treat the two intervals (50 and 150 ms) independently, since the pattern of pulse emissions within the 50 ms interval of the paired-pulse stimulus was more similar to the average responses to the initial 50 ms of the regularly-repeating 200 ms interval stimuli than to the responses to the 50 ms intervals themselves (Fig. 3D).
Figure 4C presents the average response plots for ten bats calling in the presence of the artificial buzz stimulus (illustrated in Fig. 4C). As with the other stimuli, the buzz stimulus caused a rapid initial suppression of pulse emissions that was greatest at 60 ms post-stimulus onset and lasted approximately 100 ms. Interestingly the compensatory rebound phase began approximately half way through the buzz, indicating that the bats did not postpone emitting pulses throughout the duration of the buzz. The compensatory phase lasted up to 100 ms after the end of the buzz, although it appeared to contain a prominent notch (or brief reduction in pulse emissions) that coincided with the termination of the buzz. Notably, the buzz stimulus was the most effective stimulus for provoking a prominent pre-stimulus reduction in pulse emissions; during the final 100 ms leading up to the succeeding stimulus presentation pulse emission rates dropped progressively by up to 20 % (Fig. 4C).
To address the question of whether buzzes were more or less effective than the paired-pulse stimuli for suppressing pulse emissions, figure 4D directly compares the efficacy of the buzz stimulus during the first 200 ms post-stimulus relative to the paired-pulse stimulus. The buzz stimulus did not show a significantly different effect than the paired-pulse stimulus (post-hoc comparison, F9,19 = 4.2, P = 0.02, α = 0.008), although responses to buzz stimuli tended have slightly shorter suppressive phases and less prominent compensatory rebounds.
Experiment 4: Effects of changing the acoustic parameters of the noise stimulus on bat temporal patterns
We investigated whether changing the noise burst duration or bandwidth had significant effects on the bats' responses. To test the significance of stimulus durations, we repeated the experiments with regularly repeating 200 ms intervals but with 5, 10, 25 and 50 ms duration noise bursts (Fig. 5A). To test whether bandwidth of the stimulus was important, we measured the bats' responses to a regularly repeating narrow-bandwidth tonal stimulus (25 kHz, 25 ms, 200 ms intervals). Neither changes in stimulus duration or bandwidth had a statistically significant on the average temporal responses to the stimuli (repeated measures ANOVA, F45, 128 = 1.1, P = 0.36). The average response to the narrow-band tonal stimuli appeared shallower relative to the effects of the broadband stimuli presented at the same rate, but clearly the bats responded to the tonal stimuli (Fig. 5A) and the responses followed a time course similar to that of the broadband stimuli. Finally, the average response plots illustrated in figure 5B graphically confirm that the bats' temporal responses to FM sweep stimuli were qualitatively identical to the responses generated with noise burst stimuli. Collectively these data show that the onset of any acoustic stimulus overlapping in frequency with the bandwidth of the echolocation pulses may be expected to elicit shifts in pulse emission timing.
Figure 5.
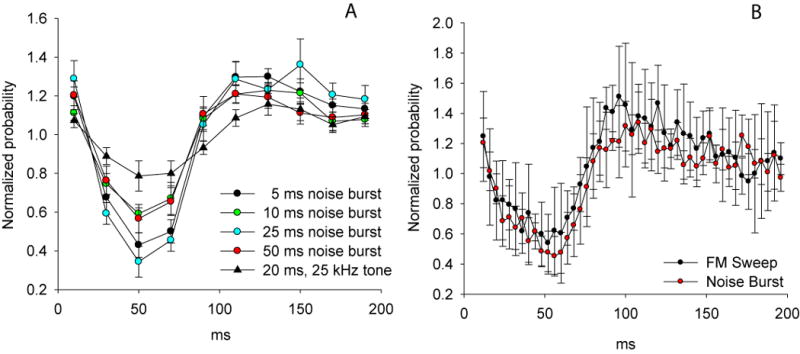
A) A comparison of the average temporal responses (mean ± s.e.) to regularly repeating noise bursts of different durations repeated at 5 Hz and a regularly repeating 25 kHz tonal stimulus lasting 20 ms also repeated at 5 Hz (n=10 bats). B) An illustration of the average temporal responses (mean ± s.e.) of ten bats echolocating in the presence of a regularly repeating downward FM-sweep (45 kHz to 20 kHz over 5 ms) repeated at 5 Hz for 20 minutes, and separately while listening to a 10 ms noise burst also repeated at 5 Hz. The first two 4-ms bins were excluded from the analysis because the FM-sweep stimulus was not reliably distinguishable from the bats' own pulses using automated methods.
Discussion
The results presented here demonstrate that free-tailed bats displayed a highly stereotyped shift in the timing of their echolocation pulse emission patterns in response to external acoustic stimuli. The temporal patterns of the bats' responses varied depending upon the temporal parameters of the stimuli but were apparently insensitive to changes in the acoustic properties of the stimulus. In general artificial noise bursts caused a pronounced but incomplete suppression of pulse emissions that began roughly 15-20 ms after stimulus onset, peaked 60 ms post-stimulus onset, and lasted up to approximately 100 ms following each stimulus. Similar patterns of vocal suppression were observed in every bat tested. The behavior did not require conditioning, did not show signs of habituation within trials and did not vary with repeated exposures to the same stimulus. The timing of subsequent pulse emissions during a compensatory rebound phase was found to be very sensitive to the temporal pattern and repetition rate of the acoustic stimulus. It is hypothesized that the observed behavior may provide a mechanism by which neighboring bats may coordinate the timing of their echolocation pulse emissions antiphonally, thereby minimizing acoustic overlap and ambiguities in the returning echoes.
The soonest a noise burst led to a significant change in the probability of a pulse being emitted was approximately 15-20 ms after stimulus onset, and the suppressive effect was greatest 50-60 ms after stimulus onset, even with longer and more complex stimuli such as the paired-pulse and buzz stimuli. The range of 15 to 60 ms is a critical time period in the context of active echolocation behavior, given that the most salient echoes returning from targets or obstacles up to 10 meters away would be returning over this time frame. Thus one of the net effects of the observed suppression could be reducing overlap between outgoing pulse emissions and returning echoes generated by the external noise stimuli.
The time course of the suppressive phase may also offer some insight into the underlying neural pathways. A 15 ms delay is indicative of a very short reflexive audio-vocal integration pathway, such as the direct midbrain connections between the ascending auditory system and descending vocal motor pathway that mediate the acoustic-laryngeal reflex (ALR) in little brown bats (Jen and Suga 1976). In the ALR, acoustic stimuli evoked an excitatory response from laryngeal muscles with a mere 6 ms latency in little brown bats (Jen and Ostwald 1977), however the functional significance of this reflex remains vague. It is possible that the ALR may be contributing to the initial suppression phase by providing a mechanism by which external acoustic stimuli could induce sufficient tension in the laryngeal muscles to constrain normal vocalizing. If so then all stimuli would be expected to have essentially the same effect on pulse emissions. Although that was not found to be true, the initial time course of the induced suppression appeared similar for all stimuli except the 50 ms interval stimuli, in response to which call rate increased rather than decreased during the first 25 ms post stimulus. Since the responses to all stimuli began to differ from one another after 25 ms post-stimulus, it seems evident that the ALR alone cannot account for much of this behavior, but it remains possible that the ALR contributes to the initial suppression phase. If so, any contributions of an ALR during the responses to the 50 ms interval stimuli must have been masked by other contributing factors.
Alternatively, electrical stimulations of the vocal control region of the anterior cingulate cortex (ACC) of the mustached bat evoked echolocation pulses with delays greater than 50 ms (Gooler and O'Neill 1986), which allows for the possibility that the arrival of inhibitory inputs from the auditory system to the ACC may explain why the suppressive phase peaked around 50-60 ms. It is also possible that the suppressive phase may be composed of both rapid reflexive inputs to the larynx and midbrain vocal pattern generators as well as slower forebrain pathways to the frontal cortex and ACC, but future studies will need to address this question directly.
The timing of the compensatory phase is also of critical importance. The bats' time course for rebounding from suppression was clearly influenced by the temporal pattern of the stimuli, but it must also be assumed that the bats' pulse emissions were constrained by respiratory patterns as well. The respiratory rate of a stationary free-tailed bat is typically eight to nine breaths per second (or 115 to 120 ms per breath) and the bats prefer to emit pulses at the initiation of each expiration (Suthers 1988). If for example a bat had intended to call 50 ms after stimulus onset and instead postponed pulse emission because of an interfering noise, then the bat would have to either A) emit pulses at an irregular time point in the respiratory cycle, B) shift the respiratory phase to accommodate a shift in pulse timing, or C) wait until the next respiratory cycle to emit a pulse. Which of these a bat opted for would clearly be influenced by stimulus rate: For a stimulus repeated every 200 ms, a pulse postponed from 50 ms post-stimulus could be shifted to the next breath cycle (roughly 165-170 ms after stimulus onset) without altering respiratory phases and still supersede the next stimulus presentation. That's not what they did however; when responding to the 200 ms stimulus interval the bats exhibited a clear preference for delaying their pulses only until 100-120 ms post-stimulus; therefore we must assume that they either made changes in their respiratory patterns or shifted the timing of their pulses within the respiratory cycle. A stimulus repeated every 100 ms would appear to pose more of a challenge for the bats since it would be difficult for the bats to vocalize continuously and also maintain a constant phase relationship with the stimulus without altering respiratory rate. Respiratory constraints on pulse timing may be one of the reasons the maximum depth of suppression in emission probability was typically only 55% in response to the slowest stimuli and significantly less with faster stimulus patterns.
In these experiments the bats were not performing any motivated behaviors (i.e. there was no pressing need to maintain the highest possible signal to noise ratios), and it is possible that they exhibit far more rigid control over the timing of the pulses when flying or foraging under more natural conditions. Alternatively it may be that in flight respiration imposes greater constraints on pulse timing owing to the fact that breathing and calling are coupled to wing beat rhythms in bats (Holderied and Helversen 2003; Lancaster et al. 1993; Speakman and Racey 1991). It seems probable that flying bats could benefit from adjusting the timing of their pulses when they can anticipate future interferences, but considering that such instances may be rare it may be that this behavior contributes only modestly to echolocation in flight. On the other hand, this behavior might be more relevant to the situation in the roost, where temporal overlap with regularly vocalizing neighbors is likely. Although free-tailed bats often live in very large, dense colonies, they are also known to roost in smaller groups, and even within large caves and buildings it is not unusual to find individuals segregated into smaller social groups. Thus while it is difficult to imagine how this behavior functions in the context of very large groups, there exists naturally occurring social situations in which the observed behavior could be beneficial. Because of the integral link between vocalization and respiration, all bats naturally exhibit a periodic rhythmicity in their pulse emissions, and it is this natural rhythmicity that would allow for one bat to anticipate the timing of a neighboring bat's pulse emissions based on the timing and pattern of preceding pulse emissions. In the presence of much larger groups, bats may instead treat the many echolocation pulses of other bats as continuous background noise, in which case they may utilize other adaptive mechanisms for improving echolocation such as simply calling louder.
The results of the paired-pulse and buzz stimulus experiments provided further insight into this behavior. The paired-pulse stimulus experiments illustrated that the partial suppression of pulse emissions caused by an initial stimulus can be sustained with subsequent pulses, but importantly the overall depth of suppression was not increased by additional stimuli. Similarly the results of the buzz stimulus experiments showed that while bats emitted significantly fewer pulses during the first half of the stimulus, they generally didn't postpone calling indefinitely. Notably, since none of the stimuli consistently reduced the probability of pulse emissions by more than approximately 55%, is seems likely that bats faced with continuous stimuli from many other bats would only be expected to reduce their average call rate by roughly half, and even then only for limited periods of time, after which they might very well begin to emit pulses more rapidly than in silence (as in figure 4C). The behavior described here would not lead to the suppression of all vocalizations within the roost. Other contextual and motivational factors necessarily influence whether and when bats emit pulses on a moment by moment basis. Furthermore the timing of pulse emissions may be affected differently by persistent background noise versus periodic interferences derived from a small number of vocalizing neighbors. To our knowledge there are no published reports describing the effects of population density on pulse emissions rates in bats.
In conclusion, the results presented here describe how external acoustic stimuli, possibly including those generated by other bats, may cause a postponement of imminent pulse emissions. Our evidence showing that the temporal pattern of the stimulus influences the time-course of this delay shows that the bats recognized and responded differently to changing stimulus temporal patterns and were not simply reacting to each preceding stimulus. It seems likely that this mechanism could rapidly lead to asynchronous pulse emissions among small groups of actively echolocating bats, although we have yet to show that this actually happens. Hopefully these results can propel future studies of this behavior under more natural conditions.
Acknowledgments
We thank Mr. Clint Netherland and the Texas A&M University Athletic Department for access to the bats of Kyle Field. We thank the Texas Parks and Wildlife Department for the collection permits. We thank Kristin Denton and Barbara Earnest for their help caring for the bats and their invaluable assistance and many helpful discussions. This study was funded by Texas A&M University and NIH NIDCD Grant No. DC007962 to MS.
Footnotes
Publisher's Disclaimer: This is a PDF file of an unedited manuscript that has been accepted for publication. As a service to our customers we are providing this early version of the manuscript. The manuscript will undergo copyediting, typesetting, and review of the resulting proof before it is published in its final citable form. Please note that during the production process errors may be discovered which could affect the content, and all legal disclaimers that apply to the journal pertain.
References
- Arlettaz R, Jones G, Racey PA. Effect of acoustic clutter on prey detection by bats. Nature. 2001;414:742–745. doi: 10.1038/414742a. [DOI] [PubMed] [Google Scholar]
- Bates ME, Stamper SA, Simmons JA. Jamming avoidance response of big brown bats in target detection. Journal of Experimental Biology. 2008;211:106–113. doi: 10.1242/jeb.009688. [DOI] [PubMed] [Google Scholar]
- Bohn K, Schmidt-French B, Ma ST, Pollak GD. Syllable acoustics, temportal patterns, and call composition vary with behavioral context in Mexican free-tailed bats. Journal of the Acoustical Society of America. 2008;124:1838–1848. doi: 10.1121/1.2953314. [DOI] [PMC free article] [PubMed] [Google Scholar]
- Brumm H. Signalling through acoustic windows: nightingales avoid interspecific competition by short-term adjustment of song timing. Journal of Comparative Physiology [A] : Neuroethology, Sensory, Neural and Behavioral Physiology. 2006;192:1279–1285. doi: 10.1007/s00359-006-0158-x. [DOI] [PubMed] [Google Scholar]
- Egnor SE, Wickelgren JG, Hauser MD. Tracking silence: adjusting vocal production to avoid acoustic interference. Journal of Comparative Physiology [A]: Neuroethology, Sensory, Neural and Behavioral Physiology. 2007;193:477–483. doi: 10.1007/s00359-006-0205-7. [DOI] [PubMed] [Google Scholar]
- Ficken RW, Ficken MS. Temporal pattern shifts to avoid acoustic interference in singing birds. Science. 1974;183:762–763. doi: 10.1126/science.183.4126.762. [DOI] [PubMed] [Google Scholar]
- Gillam EH, Ulanovsky N, McCracken GF. Rapid jamming avoidance in biosonar. Proceedings:Biological Sciences. 2007;274:651–660. doi: 10.1098/rspb.2006.0047. [DOI] [PMC free article] [PubMed] [Google Scholar]
- Gooler DM, O'Neill WE. The central control of biosonar signal production in bats demonstrated by microstimulation of anterior cingulate cortex in the echolocating bat, Pteronotus parnelli parnelli. In: Newman JD, editor. The physiological control of mammalian vocalization. New York: Plenum Press; 1986. pp. 153–184. [Google Scholar]
- Holderied MW, Helversen Ov. Echolocation range and wingbeat period match in aerial-hawking bats. Proceedings:Biological Sciences. 2003;270:2293–2299. doi: 10.1098/rspb.2003.2487. [DOI] [PMC free article] [PubMed] [Google Scholar]
- Jen PH, Suga N. Coordinated activities of middle-ear and laryngeal muscles in echolocating bats. Science. 1976;191:950–952. doi: 10.1126/science.1251206. [DOI] [PubMed] [Google Scholar]
- Jen PH, Ostwald J. Response of cricothyroid muscles to frequency-modulated sounds in FM bats, Myotis lucifugus. Nature. 1977;265:77–78. doi: 10.1038/265077a0. [DOI] [PubMed] [Google Scholar]
- Jones G. Sensory ecology: noise annoys foraging bats. Current Biology. 2008;18:1098–1100. doi: 10.1016/j.cub.2008.10.005. [DOI] [PubMed] [Google Scholar]
- Knapton RW. Intraspecific avoidance and interspecific overlap of song series in the eastern meadowlark. The Auk. 1987;104:775–779. [Google Scholar]
- Lancaster WC, Henson OW, Jr, Keating AW. Respiratory muscle activity during vocalization in flying bats. American Zoologist. 1993;33:149A. doi: 10.1242/jeb.198.1.175. [DOI] [PubMed] [Google Scholar]
- Loftus-Hills JJ. Analysis of an acoustic pacemaker in Strecker's chorus frog, Pseudacris streckeri (Anura: Hylidae) Journal of Comparative Physiology. 1974;90:75–87. [Google Scholar]
- Moore SW, Lewis ER, Narins PM, Lopez PT. The call-timing algorithm of the white-lipped frog, Leptodactylus albilabris. Journal of Comparative Physiology [A] : Neuroethology, Sensory, Neural and Behavioral Physiology. 1989;164:309–319. [Google Scholar]
- Obrist MK. Flexible bat echolocation-the influence of individual, habitat and conspecifics on sonar signal design. Behavioral Ecology and Sociobiology. 1995;36:207–219. [Google Scholar]
- Planque R, Slabbekoorn J. Spectral overlap in songs and temporal avoidance in a Peruvian bird assemblage. Ethology. 2008;114:262–271. [Google Scholar]
- Pollak GK, Marsh DS, Bodenhamer R, Souther A. A single-unit analysis of inferior colliculus in unanesthetized bats: response patterns and spike-count functions generated by constant-frequency and frequency-modulated sounds. Journal of Neurophysiology. 1978;41:677–691. doi: 10.1152/jn.1978.41.3.677. [DOI] [PubMed] [Google Scholar]
- Schwartz C, Tressler J, Keller H, Vanzant M, Ezell S, Smotherman M. The tiny difference between foraging and communication buzzes uttered by the Mexican free-tailed bat, Tadarida brasiliensis. Journal of Comparative Physiology [A] : Neuroethology, Sensory, Neural and Behavioral Physiology. 2007;193:853–863. doi: 10.1007/s00359-007-0237-7. [DOI] [PubMed] [Google Scholar]
- Simmons JA, Lavender WA, Lavender BA, Childs JE, Hulebak K, Rigden MR, Sherman J, Woolman B, O'Farrell MJ. Echolocation by free-tailed bats (Tadarida) Journal of Comparative Physiology [A] : Neuroethology, Sensory, Neural and Behavioral Physiology. 1978;125:291–299. [Google Scholar]
- Speakman JR, Racey PA. No cost of echolocation for bats in flight. Nature. 1991;350:421–423. doi: 10.1038/350421a0. [DOI] [PubMed] [Google Scholar]
- Suthers RA. The production of echolocation signals by birds and bats. In: Nachtigall PE, Moore PWB, editors. Animal Sonar: Processes and Performance. New York: Plenum Press; 1988. pp. 23–45. [Google Scholar]
- Tressler J, Smotherman M. Context-dependent effects of noise on echolocation pulse characteristics in free-tailed bats. Journal of Comparative Physiology [A] : Neuroethology, Sensory, Neural and Behavioral Physiology. 2009;195:923–934. doi: 10.1007/s00359-009-0468-x. [DOI] [PMC free article] [PubMed] [Google Scholar]
- Ulanovsky N, Fenton MB, Tsoar A, Korine C. Dynamics of jamming avoidance in echolocating bats. Proceedings:Biological Sciences. 2004;271:1467–1475. doi: 10.1098/rspb.2004.2750. [DOI] [PMC free article] [PubMed] [Google Scholar]
- Zelick R, Narins PM. Characterization of the advertisement call oscilator in the frog Eleutherodactylus coqui. Journal of Comparative Physiology [A]: Neuroethology, Sensory, Neural and Behavioral Physiology. 1985;156:223–229. [Google Scholar]