

Abstract
The cAMP response element modulator gene (Crem) encodes a variety of transcriptional regulators including the inducible cAMP early repressor, ICER. We previously showed that Crem knockout mice, which are deficient in CREM and ICER factors, display slightly increased long bone mass and decreased osteoclast number. These data are consistent with the notion that Crem regulates bone mass in part through an effect on osteoclast formation and/or function. Since ICER is strongly induced by cAMP, we asked whether the calcium-regulating hormone calcitonin, which stimulates cAMP production and inhibits osteoclastic bone resorption, could induce ICER in osteoclasts. The monocytic cell line RAW264.7 was treated with receptor activator of NF-κB ligand (RANKL) to induce osteoclast formation. Calcitonin caused a time- and dose-dependent induction of ICER mRNA and an increase in ICER protein abundance in RANKL-treated RAW264.7 cells. Calcitonin also induced ICER mRNA and protein in osteoclasts derived from primary mouse bone marrow cell cultures. Calcitonin-treated osteoclasts showed immunoreactivity with an anti-CREM antibody. Calcitonin decreased the activity of wild type and Crem knockout osteoclasts in vitro, and this inhibitory effect was greater in Crem knockout osteoclasts. Furthermore, calcitonin decreased calcitonin receptor mRNA expression in wild type osteoclasts but not in Crem knockout osteoclasts. These data suggest that calcitonin induction of ICER in osteoclasts might regulate osteoclast activity.
Keywords: calcitonin, ICER, CREM, osteoclast, bone resorption
Introduction
The cAMP responsive element modulator (CREM) proteins are members of the activating transcription factor/cAMP response element binding protein (ATF/CREB) transcription factor family [1]. CREM proteins mediate cAMP-dependent signal transduction by binding to cAMP response elements (CREs) in gene regulatory regions. The Crem gene contains four promoters (P1–P4) that direct the transcription of different CREM products. The intronic P2 promoter in the 3′ end of the Crem gene directs transcription of the inducible cAMP early repressor (ICER) [2]. Alternative splicing yields four ICER isoforms termed I, Iγ, II, and IIγ. Since ICER proteins have a DNA binding domain but lack a transactivation domain(s), they repress cAMP-dependent gene transcription. Functions of ICER include the regulation of circadian rhythms [3], suppression of T-cell responsiveness [4], neuronal plasticity and apoptosis [5] and repression of tumor formation in prostate [6]. ICER expression is induced primarily through the cAMP-PKA pathway in many tissues including pineal [7], thyroid gland [8], ovary [9], liver [10], heart [11], T lymphocytes [12] and Sterol cells [13]. However, other pathways also induce ICER include nerve growth factor via the ras-MAP kinase pathway in PC12 pheochromocytoma cells [14].
Crem knockout mice, which are deficient in all CREM/ICER factors show increased locomotion and reduced anxiety [15, 16] as well as alterations in cardiac function [17]. Male Crem knockout mice are sterile since their spermatids fail to undergo full differentiation to mature sperm [15, 18]. We previously showed that Crem knockout mice have a subtle bone phenotype characterized by slightly increased femoral trabecular thickness and cortical bone area, and a trend towards decreased osteoclast number in vivo [19]. Although the mechanism for these bone alterations is unknown, a reduction of osteoclast formation and/or function could be responsible. This could occur by direct or indirect mechanisms: CREM/ICER expression in osteoclasts could directly regulate osteoclast function or CREM/ICER expression in osteoblasts could mediate osteoclastogenesis indirectly. We previously reported that PTH induces ICER expression in osteoblastic MC3T3-E1 cells and mouse calvariae via the cAMP-PKA pathway [20, 21]. Osteoblasts also express a variety of other CREM transcripts [22]. However, whether CREM/ICER is expressed in osteoclasts is not known.
Calcitonin is a classical calcium-regulating hormone, which is used therapeutically to treat metabolic bone disorders such as osteoporosis and Paget’s disease due to its inhibitory effect on osteoclastic resorption [23]. Calcitonin signals directly in osteoclasts through the calcitonin receptor, a B-type G protein-coupled receptor highly expressed on the plasma membrane of osteoclasts [24]. The binding of calcitonin to the calcitonin receptor leads to activation of multiple signaling effectors, including adenylyl cyclase, MAP kinases and phospholipases C, D and A2 [24–27], which contribute to different responses [25, 28, 29]. Previous studies found that calcitonin affects osteoclast motility arrest, cytoskeleton changes and calcitonin receptor down-regulation through the PKA pathway [29–32].
Given that calcitonin acts on osteoclasts through the cAMP-PKA pathway, we hypothesized that calcitonin induces ICER in osteoclasts. In the present study, the osteoclast progenitor cell line RAW264.7 and bone marrow cells were treated with cytokines to induce osteoclast formation and then with calcitonin. We show that calcitonin induced all of the known ICER transcripts and ICER protein in osteoclasts. In an in vitro resorption assay, calcitonin decreased osteoclast function in wild type and Crem knockout osteoclasts and this inhibitory effect was greater in Crem knockout osteoclasts.
Results
We first asked whether calcitonin could induce ICER expression in osteoclasts derived from the RAW264.7 monocytic cell line. To determine the optimal time point for calcitonin treatment, RAW264.7 cells were treated with 30 ng/ml RANKL and osteoclast formation was measured as the number of TRAP-stained multinucleated cells present on days 3 through 6. Osteoclasts were first seen on day 3 and osteoclast number peaked on day 4 (not shown). Therefore, in subsequent experiments, RAW264.7 cells were treated with 10 nM calcitonin on day 4. Primers were used that would amplify each of the four known ICER transcripts [20]. ICER induction was not seen undifferentiated RAW264.7 cells (Fig. 1A). A 2 h treatment with calcitonin induced all of the four predicted ICER transcripts in RANKL-differentiated RAW264.7 cells, with amplicon sizes of 779 (ICER I), 743 (ICER Iγ), 382 (ICER II) and 346 bp (ICER IIγ) (Fig. 1A). MC3T3-E1 cells treated for 2 h with 10 μM forskolin showed the same pattern of ICER mRNA expression, thereby serving as a positive control for ICER induction [20, 21]. These products were not seen if reverse transcriptase was omitted from the reaction mixture (Fig. 1A). Calcitonin induction of ICER mRNA was first seen at 1 h; expression peaked at 10 h and declined to baseline by 16 h (Fig. 1B). To determine the dose response relation for calcitonin induction of ICER, osteoclasts were treated with different concentrations of calcitonin for 4 h. Calcitonin induced ICER transcripts over a dose range of 0.01–1000 nM with maximal induction at 1 nM (Fig. 1C).
Fig. 1.

Calcitonin induces ICER expression in differentiated RAW264.7 cultures. (A) RAW264.7 cells (RAW) were cultured with or without RANKL for 4 days to induce osteoclast formation. At day 4, cultures were treated with vehicle (Veh) or 10 nM calcitonin (CT) for 2 h, or given no treatment (Con). RNA was extracted and treated with (+) or without (−) reverse transcriptase (RT) and PCR was performed using primers that detect all four of the ICER transcripts as described under Materials and Methods. A 2 h incubation of osteoblastic MC3T3-E1 cells with 10μM forskolin (FSK) served as a positive control for ICER induction [21]. M, molecular weight marker. β-Actin was used as a loading control. (B) RAW cells were treated with 30 ng/ml RANKL for 4 days to induce osteoclast formation and then treated with vehicle (−) or 10 nM calcitonin (CT) (+) for up to 18 h. RNA was extracted every 2 h and ICER transcripts assessed by RT-PCR. GAPDH was used as a loading control. (C) RAW264.7 cells were treated with 30 ng/ml RANKL for 4 days to induce osteoclast formation, and then treated with 0.01–1000 nM calcitonin (CT) for 2 h. ICER transcripts were assessed by RT-PCR. GAPDH was used as internal control. (D) RAW cells were treated with 30 ng/ml RANKL to induce osteoclast formation, and then treated with vehicle (Veh) or 10 nM calcitonin (CT) for 7 h. Nuclear extracts were subjected to western blotting and probed with an anti-CREM antibody. ICER proteins were seen as inducible, low-molecular-weight proteins bands around the 14.3 kDa marker. PTH treated MC3T3-E1 cells were used as positive control for ICER protein induction. Tubulin was used as a loading control. These experiments were performed at least twice with similar results.
To determine whether calcitonin induced ICER protein, RAW264.7 cells were treated with 30 ng/ml RANKL for 4 days to induce osteoclast formation and then the cultures were treated with 10 nM calcitonin for 7 h. Nuclear extracts were prepared and subjected to western blotting with a polyclonal CREM antibody. Calcitonin induced several low molecular weight protein bands around that were recognized by the CREM antibody (Fig. 1D). These low molecular weight, inducible bands are characteristic of ICER [33]. MC3T3-E1 cells treated for 4 h with PTH, which served as a positive control for ICER induction, showed the same pattern of CREM immunoreactive protein expression. As seen in our previous studies [21], other immunoreactive bands were detected in the western blot. These could be other CREM proteins or nonspecific bands.
To determine whether calcitonin induced ICER expression in primary osteoclast cultures, bone marrow cells (BMCs) were derived from 6- to 8-week old mice and cultured with 30 ng/ml each of RANKL and M-CSF. Similar to RAW264.7 cultures, osteoclast formation peaked at day 4 (not shown). Therefore, in subsequent experiments, day 4 RANKL- and M-CSF-induced cultures were treated with 10 nM calcitonin or vehicle. A 2 h treatment with calcitonin induced all of the four ICER mRNA transcripts (Fig. 2A). Western blot confirmed the expression of ICER proteins (Fig. 2B). Immunohistochemistry was performed with a polyclonal CREM antibody to determine whether ICER proteins were expressed in osteoclasts within the cultures. Calcitonin treated osteoclasts showed immunoreactive staining in nuclei, which were localized primarily in the cell periphery. Vehicle-treated osteoclasts did not show staining (Fig. 2C). Calcitonin treatment also induced ICER mRNA and protein expression in osteoclasts differentiated from spleen cells (data not shown).
Fig. 2.

Calcitonin induces ICER expression in osteoclasts differentiated from bone marrow cell (BMC) cultures. (A) BMCs treated with or without 30 ng/ml each of RANKL and M-CSF for 4 days to induce osteoclast formation, then with vehicle (Veh) or 10 nM calcitonin (CT) for 2 h. RNA was extracted and subjected to RT-PCR to detect ICER mRNA expression as described under Material and Methods. MC3T3-E1 osteoblastic cells treated with 10 μM forskolin (FSK) were used as positive control for ICER induction [21]. GAPDH was used a loading control. M, molecular weight marker. (B) BMCs were treated with 30 ng/ml RANKL and 30 ng/ml M-CSF for 4 days to induce osteoclast formation, and then treated with vehicle (Veh) or 10 nM calcitonin (CT) for 7 h. Nuclear extracts were subjected to Western blotting and probed with an anti-CREM antibody. PTH treated MC3T3-E1 cells for 4 h were used as positive control for ICER induction. ICER proteins were identified as low molecular weight inducible bands. The tubulin was probed as a loading control. (C) BMCs were treated with 30 ng/ml RANKL and 30 ng/ml M-CSF for 4 days to induce osteoclast formation. Cultures were then treated with calcitonin and vehicle for 4 h and subjected to immunohistochemistry with an anti-CREM antibody. Osteoclasts showed immunoreactive staining in peripheral nuclei. These experiments were performed at least twice with similar results. Scale bars in the pictures, 100μm.
To determine whether ICER plays a role in the inhibitory of bone resorption by calcitonin, the activity of calcitonin in osteoclasts derived from wild type and Crem knockout mice were examined in vitro. Wild type and Crem knockout BMCs were plated onto BD BioCoat Osteologic discs, which are coated with a calcium phosphate substrate. BMCs were treated with 30 ng/ml each of RANKL and M-CSF for 4 days to induce osteoclast formation. Cultures were then treated with 10 nM calcitonin for up to 10 days more. Resorption was defined as the area of the discs that did not stain with von Kossa reagent (denuded of coating). The denuded area was measured every 2 days. Calcitonin inhibited resorption in both wild type and Crem knockout cultures. Inhibition of resorption was first seen after 2 days of calcitonin treatment and was greatest in magnitude at day 6 (Fig. 3A and 3B). At day 10 of calcitonin treatment, inhibition of resorption was not observed in wild type cultures but was evident in knockout cultures (Fig. 3A and 3B). From day 4 to 10 of calcitonin treatment, the percent inhibition of resorption was greater in Crem knockout cultures than in wild type cultures (Fig. 3C).
Fig. 3.

Calcitonin decreases osteoclast activity to a great extent in Crem knockout osteoclasts compared to wild type osteoclasts. Wild type and Crem knockout BMCs were plated on BD Osteologic discs as described in Materials and Methods. Cells were cultured for 4 days in the presence of 30 ng/ml each of RANKL and M-CSF to induce osteoclast formation, and then treated with 10 nM calcitonin (CT) or vehicle (Veh) for up to 10 days more. Medium containing RANKL, M-CSF and calcitonin or vehicle was refreshed every other day. At each time point, after washed out the cells, the discs were stained with von Kossa reagent as described in Materials and Methods. (A) Percent resorbed area in wild type (WT) cultures treated with vehicle or calcitonin. (B) Percent resorbed area in Crem knockout (KO) cell cultures with vehicle or calcitonin. (C) Percent inhibition by calcitonin in wild type and Crem KO cultures. Each value represents the mean ± SD of 4 wells. Different from vehicle-treated cultures in A and B; Different from wild type cultures in C. *p<0.05, ** p<0.01, ***p<0.001.
Inhibition of CTR expression in osteoclasts by calcitonin is thought to be responsible at least in part for the loss of calcitonin responsiveness in osteoclasts (escape). To determine whether calcitonin affects expression of CTR in the models used in this study, wild type and Crem knockout BMCs were treated with 30 ng/ml each of RANKL and M-CSF for 4 days to induce osteoclast formation, cultures were then treated with calcitonin for 5 hours and CTR expression was assessed by qRT-PCR. Calcitonin decreased CTR expression by 56% in wild type cultures but only by 4% in Crem knockout cultures (Fig. 4).
Fig. 4.
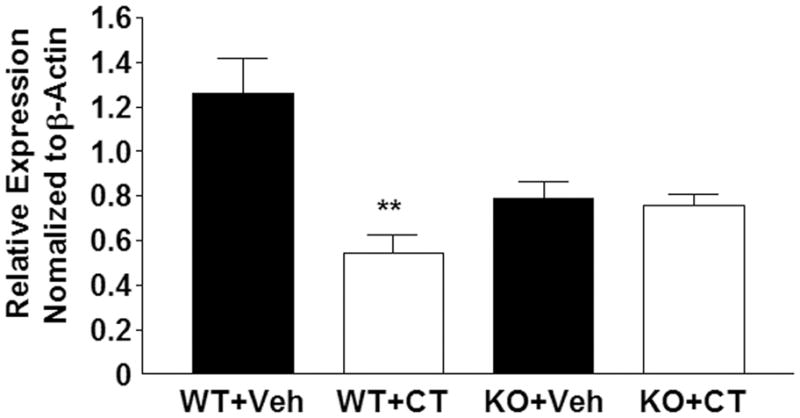
Calcitonin decreases calcitonin receptor expression in wild type osteoclasts but not in Crem knockout cultures. wide type and KO BMCs were treated with 30 ng/ml each of RANKL and M-CSF for 4 days to induce osteoclast formation, and then treated with vehicle (Veh) or 10 nM calcitonin (CT) for 5 h. Calcitonin receptor (CTR) expression relative to β-actin in wild type (WT) and Crem knockout (KO) osteoclasts treated with vehicle or calcitonin. Each value is the mean ± SD of 3 cultures. Different from vehicle-treated WT cultures, ** p<0.01.
Discussion
In the present study, we show for the first time that calcitonin induces all of the known ICER transcripts in osteoclasts derived from RAW264.7 cells and from murine bone marrow cells. Although calcitonin decreased the activity of both wild type and Crem knockout osteoclasts, its inhibitory effect was greater in Crem knockout osteoclasts. Calcitonin inhibits bone resorption in osteoclasts by signaling through the CTR, a member of the G protein-coupled receptor superfamily, and generating cAMP as a second messenger. This idea was further supported by observations that forskolin, a cAMP-PKA pathway agonist, induced ICER mRNA expression in osteoclasts derived from RANKL treated RAW264.7 cells (data not shown). ICER is strongly induced by the cAMP-PKA pathway in many systems including the pineal [2, 7, 33], endometrium [34], ovary [9], sertoli cells [13], thyroid gland [8], liver [10], T lymphocytes [12], heart [11] and osteoblasts [21]. Recently, the neuropeptide calcitonin gene-related peptide (CGRP) has been reported to inhibit Toll-like receptor (TLR)-stimulated Tnf and Ccl4 gene expression in bone marrow dendritic cells by inducing ICER through cAMP signaling [35]. However, in some cell types, ICER induction is mediated by other pathways. For example, nerve growth factor induces ICER in adrenal PC12 cells through the ras-MAP kinase pathway [14].
The calcitonin receptor is coupled to several signaling pathway. In addition to cAMP-PKA pathway [27, 36], both activation of protein kinase C (PKC) [28] and increased calcium levels [25, 30, 37–39] have been reported to be involved in the inhibition of osteoclastic bone resorption by calcitonin. Therefore, at least three signaling pathways (PKA, PKC and intracellular calcium) are involved in mediating the actions of calcitonin on osteoclasts. Whether ICER expression in osteoclasts is strictly coupled to the cAMP-PKA pathway remains unknown. Further experiments will be required to identify the exact signaling pathways involved in the ICER induction in osteoclasts.
Our previous studies revealed that male Crem knockout mice, which are deficiency of all CREM products, had slightly increased long bone mass, including trabecular thickness and cortical area. A histomorphometric analysis indicated no difference in the bone formation rate between the two genotypes [40]. However, there was a trend towards decreased osteoclast number per bone surface (NOc/Bs) and osteoclast surface per bone surface (OcS/BS) in Crem knockout mice [40]. These data suggest that Crem knockout mice may have reduced bone resorption due to decreased osteoclast number and/or osteoclast function. However, an in vitro CFU-GM assay showed that osteoclast precursor number was not affected by CREM deficiency, and an in vitro osteoclastogenesis assay showed that wild type and Crem knockout BMCs had similar osteoclastogenesis capability in response to RANKL and M-CSF [40]. Data in the present study using an in vitro resorption assay showed that Crem knockout osteoclasts exhibit similar activity compared to wild type osteoclasts. Taken together, these data allow us to speculate that the increased bone mass in Crem knockout mice is more likely due to reduced osteoclast number in vivo.
Based on its inhibitory effect on bone resorption, calcitonin has been used in the treatment of bone diseases including osteoporosis. However, when calcitonin is used to inhibit bone resorption, resistance to its activity develops (escape). This phenomenon has been reported in both in vivo [41, 42] and in vitro [43, 44] systems. Possible mechanisms include the recruitment of osteoclasts that are insensitive to calcitonin [45, 46] and/or downregulation of CTRs on osteoclasts [44]. In mature osteoclasts, even short-term treatment with low concentrations of calcitonin produced down-regulation of the CTR expression. This response is mediated by cAMP and is not seen in other cell types having CTRs [29, 47]. Since ICER is induced by cAMP, we reasoned that ICER may play a role in the escape phenomenon in response to calcitonin. In our present study, calcitonin inhibited in vitro resorption in wild type and Crem knockout osteoclasts and both groups showed the “escape” phenomenon. This indicated that ICER is not solely responsible for the escape of osteoclasts from calcitonin action. We also found that calcitonin inhibited resorption to a greater extent in Crem knockout osteoclasts, indicating that escape was blunted. We hypothesized that calcitonin-induced ICER could inhibit the internalization of calcitonin receptor or inhibit de novo CTR synthesis. We addressed the later hypothesis and showed that calcitonin significantly decreased CTR expression in wild type osteoclasts but had no effect on CTR expression in Crem knockout osteoclasts. This would place ICER in the pathway by which calcitonin inhibits CTR expression in osteoclasts.
The CTR promoter contains composite sites for nuclear factor of activated T-cells (NFAT)/activator protein 1 (AP1) binding [48]. Overexpression of NFATc1 in HEK293T and RAW264.7 cells increased the activity of both mouse and human CTR promoter-reporter constructs [49, 50]. It has been reported that ICER and NFAT/AP1 can form a ternary complex in vitro [51]. In human thymocytes, these ternary complexes ICER/NFAT/AP-1 complexes repress NFAT-mediated transcriptional activation of the IL-2, granulocyte-macrophage colony stimulating factor and tumor necrosis factor-α promoters [52]. In T lymphocytes, ICER binds to the proximal NFAT binding site in the Fas ligand (FasL) promoter, and attenuates cAMP-dependent FasL transcription [51]. In osteoclasts, it is possible that calcitonin-induced ICER forms a complex with NFAT at the NFAT/AP1 composite site in the CTR promoter and represses NFAT-mediated promoter activation. Such a mechanism would lead to a reduction in CTR expression and a loss of calcitonin responsiveness. It is also possible that ICER acts on other steps in the pathway. For example, RANKL activates CREB in osteoclasts, which synergizes with NFAT at the CTR promoter [53]. By forming an inactive heterodimer with CREB [2], ICER could repress CTR promoter activation. Alternatively, ICER homodimerizes might bind to CRE sites in CTR promoter, precluding the recruitment of other factors necessary for transcriptional activation (Fig. 4). Therefore, in Crem knockout mice, ICER deficiency results in loss of an inhibitory influence on these stimulatory factors, leading to prolonged effectiveness of calcitonin on osteoclasts. In conclusion, our results show that ICER is induced by calcitonin in osteoclasts and that ICER regulates the inhibitory effect of calcitonin on resorption by suppressing the calcitonin receptor expression. Future studies are designed to identify targets of ICER that regulate CTR expression in osteoclasts.
Material and Methods
Animals
Crem knockout mice were originally developed in a mixed genetic background (129Sv/C57BL/6) and kindly provided by Dr. Gunter Schutz [15]. Crem knockout mice have been maintained by breeding with C57BL/6 mice. Heterozygous knockout breeding units was established to generate wild type and knockout littermates. Animals were used at about 6–8 weeks of age. All animal care protocols were reviewed and approved by the University of Connecticut Health Center Animal Care Committee.
Cell culture
The murine monocytic cell line RAW264.7 was obtained from the American Type Cell Culture (ATCC, Rockville, MD). Cells were plated at 5 × 10⁴/well in 35 mm plates and grown in α-minimal essential medium (αMEM; Invitrogen, Grand Island, NY) containing 10% heat-inactivated fetal calf serum (HI-FCS, Hyclone, Logan, UT), 50 U/ml penicillin and 50 μg/ml streptomycin. The medium was supplemented with 30 ng/ml recombinant murine RANKL (R&D Systems, Minneapolis, MN). Medium was replaced on day 3. For bone marrow cell (BMC) cultures, femurs and tibiae from 6- to 8-week-old mice were dissected from surrounding tissues. The epiphyseal growth plates were removed and marrow flushed from the shafts with serum free αMEM. Cells were plated in 6-well dishes at 2 × 10⁶/well in αMEM containing 10% HI-FCS, 50 U/ml penicillin and 50 μg/ml streptomycin and treated with 30 ng/ml RANKL and 30 ng/ml M-CSF. Medium was changed on day 3. On day 4, cells were treated with 10 nM salmon calcitonin (Bachem Bioscience Inc, PA) or vehicle for different lengths of time. Murine osteoblastic MC3T3-E1 cells [54] were plated at 5 × 10⁴/well in 35 mm plates and grown in αMEM containing 10% HI-FCS, 50 U/ml penicillin and 50 μg/ml streptomycin. Cells were grown to confluence and treated with 10 nM bovine PTH (1–34) (Sigma-Aldrich, St. Louis, MO) and vehicle (1 mg/ml BSA containing 0.001 N HCl), or 10 μM forskolin (Sigma-Aldrich, St. Louis, MO) and vehicle (100% ethanol).
Tartrate resistant acid phosphatase (TRAP) staining
On days 3 through 6, cultures were stained for TRAP. Briefly, cells were washed twice with phosphate-buffered saline then fixed with 2.5% glutaraldehyde for 5 min. Cells were stained for TRAP using a leukocyte acid phosphatase kit (Sigma-Aldrich, St. Louis, MO) as previously described [55]. Osteoclasts were defined as TRAP-positive cells containing 3 or more nuclei.
RNA extraction
Total RNA was prepared from cultures using TRIzol reagent (Invitrogen Corporation, Carlsbad, CA) as previously described with minor modifications [56]. The first precipitation was done overnight. Pellets were resuspended in 0.3 ml 4 M guanidinium isothiocyanate (GTC) and RNA precipitated in 0.3 ml isopropanol for 1 h at −20°C. Total RNA was quantitated by absorbance at 260 nm and its purity assessed by measuring the OD260/OD280 absorbance ratio.
Reverse transcriptase-polymerase chain reaction (RT-PCR) and quantitative real-time PCR (qRT-PCR)
Reverse transcription was carried out with 3 μg RNA using Superscript™ II reverse transcriptase reagent (Invitrogen, Carlsbad, CA) according to manufacturer’s protocol. The resulting cDNA templates were used for RT-PCR. Amplification conditions used were an initial 2 min at 94°C, 27 cycles at 94°C for 45 sec, at 65°C for 45 sec and at 72°C for 2 min, followed by a final elongation at 72°C for 5 min. The reaction consisted of 0.25 μl RT product, 1 x PCR buffer, 1.5 mM MgCl2, 200 μM dNTP, 1.25U Taq DNA polymerase and 0.8 μM each of sense and antisense primers in PCR buffer. Primers used for detecting ICER were 5′-TATGCAAAAGCCCAACATGG-3′ (the unique 5′-untranslated region of ICER) and 5′-CTACTAATCTGTTTTGGGAGAGC-3′ (CREM DNA binding domain II reverse, position 1068 to 1090 of the mouse cDNA sequence) [57]. Murine glyceraldehyde phosphate dehydrogenase (GAPDH) and mouse β-actin were amplified as internal controls. Primers used for detecting GAPDH were 5′-TGAAGGTCGGTGTGAACGGATTTGGC-3′ and 5′-CATGTAGGCCATGAGGTCCACCAC-3′. PCR was performed as follows: 10 cycles at 94°C for 30 sec, 65°C for 1 min and 72°C for 1.5 min, then 10 cycles at 94°C for 30 sec, 60°C for 1 min and 72°C for 1.5 min, 5 cycles at 94°C for 30 sec, 55°C for 1 min and 72°C for 1.5 min, 6 cycles at 94°C for 30 sec, 50°C for 1 min and 72°C for 1.5 min, followed by a final elongation at 72°C for 5 min. Primers used for detecting β-actin were 5′-TTCTTTGCAGCTCCTTCGTTGCCG-3′ and 5′-TGGATGGCTACGTACATGGCTGGG-3′. PCR was performed as follows: 32 cycles at 94°C for 1 min, 60°C for 1 min and 72°C for 1 min, followed by a final elongation at 72°C for 5 min. For qRT-PCR, cDNA template derived from 3 μg RNA was diluted in 600 μl H2O and 5 μl was used to perform qRT-PCR with a Bio-Rad MyiQ thermocycler and a SYBR Green detection system. Amplification reactions were performed in 11 μl containing 0.5 μM primers and 5 μl SYBR-green supermix. For measuring calcitonin receptor (CTR) expression, the forward and reverse primers were 5′-AGTTGCCCTCTTATGAAGGAGAAG-3′ and 5′-GGAGTGTCGTCCCAGCACAT-3′. For measuring β-actin expression, the forward and reverse primers were 5′-ATCTGGCACCACACCTTCTACAA -3′ and 5′-ATGGCTGGGGTGTTGAAGGT -3′. CTR expression was normalized to β-actin expression in the same cDNA sample.
Preparation of nuclear extracts and Western blotting
Nuclear extracts were prepared as previously described [58]. Briefly, after calcitonin or vehicle treatment, cells were washed with phosphate buffered saline (PBS) and resuspended in buffer A (1 nM DTT, 0.5 mM PMSF, 20 μl polyethoxyethanol, 5 μl each of 10 mg/ml aprotinin, leupeptin and pepstatin A). Cells were collected by centrifugation and homogenized in 150 μl buffer B (1 mM DTT, 0.5 mM PMSF, 1 μl each of 10 mg/ml aprotinin, leupeptin and pepstatin A) and mixed vigorously with a vortex at 4°C for 2 h. Protein content of the extracts was quantified using the BCA assay [59]. Nuclear extracts (40 μg) were fractionated by electrophoresis on a 15% polyacrylamide/SDS gel, transferred to a PVDF membrane (Millipore Corporation, Bedford, MA), and incubated with a polyclonal anti-CREM antibody (1:1000 dilution) that recognizes all CREM and ICER proteins [33]. Following incubation with a horseradish peroxidase (HRP)-conjugated secondary anti-rabbit IgG (1:3000 dilution) (Cell Signaling, Danvers, MA). Signals were illuminated by a Phototope-HRP Western blot detection system (New England Biolabs, Beverly, MA) and detected with a BioMax film (Eastman Kodak Company, Rochester, NY).
Immunohistochemistry
Bone marrow cells (BMCs) were plated at 2.5 × 10⁵/well in 48-well-plates and treated with RANKL and M-CSF (30 ng/ml each) to induce osteoclast formation. On day 4, cultures were treated with 10 nM calcitonin or vehicle for 4 h. Cells were fixed with 2% paraformaldehyde, then washed with PBS and incubated with 0.1% NP-40 for 15 min. After washing with PBS, cells were incubated with 0.5% BSA blocking buffer for 1 h and probed with a polyclonal anti-CREM primary antibody (1:200 dilution) for 1 h at room temperature. Cells were washed with PBS and incubated with an HRP-conjugated secondary anti-rabbit IgG antibody (1:500 dilution) (Cell signaling, Danvers, MA) for 1 h at room temperature. Signals were using Aminoethyl Carbazole (AEC, Zymed Laboratories, Inc, South San Francisco, CA).
In vitro resorption assay
BMCs were harvested as described above and plated at 1.5 × 10⁵/well on BD BioCoat Osteologic MultiTest slides (BD Biosciences, Bedford, MA). Cells were treated with RANKL and M-CSF (30 ng/ml each) to induce osteoclast formation. Beginning on day 4, cultures were treated with 10 nM calcitonin. Cultures were given fresh medium containing RANKL and M-CSF and 10 nM calcitonin every other day for up to 10 days more. At the end of culture, cultures were washed with 4~6% NaOCl and agitated for 5 min to remove cells; discs were then washed 5 times with deionized water. Cultures were stained by the Von Kossa method. Cultures were treated with fresh 5% AgNO3 for 30 min, washed 3 times with water and developed with fresh 5% sodium carbonate in 25% formalin. After 3 washes with water, cells were fixed with 5% sodium thiosulphate for 2 min, washed with water and air-dried. Areas of resorption were analyzed by light microscopy and digital images were recorded; they were determined by maximizing the contrast controls in Adobe Photoshop (Adobe Systems, Inc., San Jose, CA, USA) and then inverting the images. Using the histogram function, the percentile of pixels of black in the gray scale was measured as a representation of the percentage of resorption area to total area. Percent inhibition by calcitonin was calculated as: [resorbed area in vehicle treated group - resorbed area in calcitonin treated group)/resorbed area in vehicle treated group] × 100.
Statistics
Data was analyzed with two-way ANOVA followed by Bonferroni post-test as indicated in the figure legends. P<0.05 was considered significant.
Fig. 5. A model for ICER regulation of calcitonin-inhibited osteoclast resorption.
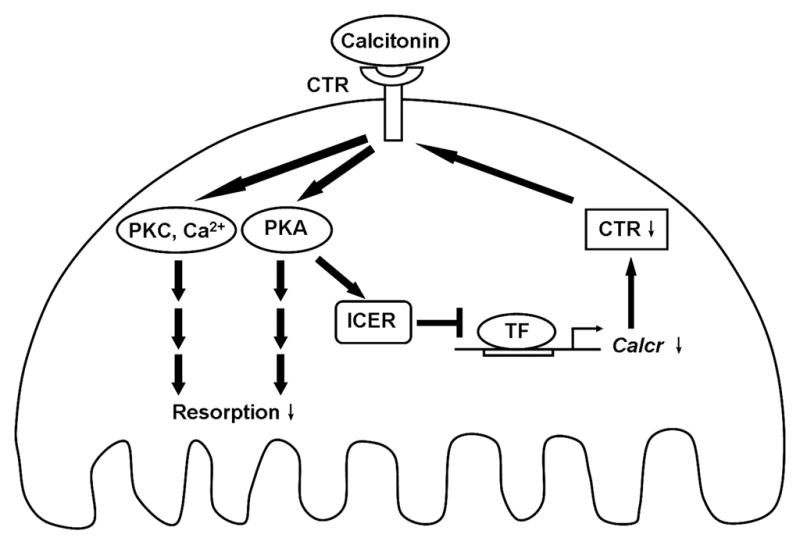
Calcitonin binds to the calcitonin receptor (CTR) and results in activation of multiple pathways including cAMP-PKA, PKC and intracellular calcium, which lead to the inhibition of osteoclast resorption. PKA activation also induces ICER expression. ICER may reduce CTR levels by blocking calcitonin receptor (calcr) gene transcription by positively acting transcription factor (TF). Decreased CTR levels results in the resistance of osteoclasts to calcitonin inhibition (escape).
Acknowledgments
This project was supported by a grant to B.E.K. (AR046542) from the National Institute of Arthritis and Musculoskeletal and Skin Diseases (NIAMS) of the National Institutes of Health.
References
- 1.De Cesare D, Sassone-Corsi P. Prog Nucleic Acid Res Mol Biol. 2000;64:343–369. doi: 10.1016/s0079-6603(00)64009-6. [DOI] [PubMed] [Google Scholar]
- 2.Stehle JH, Foulkes NS, Molina CA, Simonneaux V, Pevet P, Sassone-Corsi P. Nature. 1993;365:314–320. doi: 10.1038/365314a0. [DOI] [PubMed] [Google Scholar]
- 3.Tomita H, Nazmy M, Kajimoto K, Yehia G, Molina CA, Sadoshima J. Circ Res. 2003;93:12–22. doi: 10.1161/01.RES.0000079794.57578.F1. [DOI] [PubMed] [Google Scholar]
- 4.Bodor J, Bodorova J, Gress RE. J Leukoc Biol. 2000;67:774–779. doi: 10.1002/jlb.67.6.774. [DOI] [PubMed] [Google Scholar]
- 5.Mioduszewska B, Jaworski J, Kaczmarek L. J Neurochem. 2003;87:1313–1320. doi: 10.1046/j.1471-4159.2003.02116.x. [DOI] [PubMed] [Google Scholar]
- 6.Memin E, Yehia G, Razavi R, Molina CA. Prostate. 2002;53:225–231. doi: 10.1002/pros.10149. [DOI] [PubMed] [Google Scholar]
- 7.Stehle JH, Foulkes NS, Pevet P, Sassone-Corsi P. Mol Endocrinol. 1995;9:706–716. doi: 10.1210/mend.9.6.8592516. [DOI] [PubMed] [Google Scholar]
- 8.Lalli E, Sassone-Corsi P. Proc Natl Acad Sci U S A. 1995;92:9633–9637. doi: 10.1073/pnas.92.21.9633. [DOI] [PMC free article] [PubMed] [Google Scholar]
- 9.Mukherjee A, Urban J, Sassone-Corsi P, Mayo KE. Mol Endocrinol. 1998;12:785–800. doi: 10.1210/mend.12.6.0126. [DOI] [PubMed] [Google Scholar]
- 10.Servillo G, Penna L, Foulkes NS, Magni MV, Della Fazia MA, Sassone-Corsi P. Oncogene. 1997;14:1601–1606. doi: 10.1038/sj.onc.1200996. [DOI] [PubMed] [Google Scholar]
- 11.Folco EJ, Koren G. Biochem J. 1997;328 ( Pt 1):37–43. doi: 10.1042/bj3280037. [DOI] [PMC free article] [PubMed] [Google Scholar]
- 12.Bodor J, Spetz AL, Strominger JL, Habener JF. Proc Natl Acad Sci U S A. 1996;93:3536–3541. doi: 10.1073/pnas.93.8.3536. [DOI] [PMC free article] [PubMed] [Google Scholar]
- 13.Monaco L, Foulkes NS, Sassone-Corsi P. Proc Natl Acad Sci U S A. 1995;92:10673–10677. doi: 10.1073/pnas.92.23.10673. [DOI] [PMC free article] [PubMed] [Google Scholar]
- 14.Monaco L, Sassone-Corsi P. Oncogene. 1997;15:2493–2500. doi: 10.1038/sj.onc.1201636. [DOI] [PubMed] [Google Scholar]
- 15.Blendy JA, Kaestner KH, Weinbauer GF, Nieschlag E, Schutz G. Nature. 1996;380:162–165. doi: 10.1038/380162a0. [DOI] [PubMed] [Google Scholar]
- 16.Maldonado R, Smadja C, Mazzucchelli C, Sassone-Corsi P, Mazucchelli C. Proc Natl Acad Sci U S A. 1999;96:14094–14099. doi: 10.1073/pnas.96.24.14094. [DOI] [PMC free article] [PubMed] [Google Scholar]
- 17.Muller FU, Lewin G, Matus M, Neumann J, Riemann B, Wistuba J, Schutz G, Schmitz W. Faseb J. 2003;17:103–105. doi: 10.1096/fj.02-0486fje. [DOI] [PubMed] [Google Scholar]
- 18.Nantel F, Monaco L, Foulkes NS, Masquilier D, LeMeur M, Henriksen K, Dierich A, Parvinen M, Sassone-Corsi P. Nature. 1996;380:159–162. doi: 10.1038/380159a0. [DOI] [PubMed] [Google Scholar]
- 19.Liu F, Lee SK, Adams DJ, Gronowicz GA, Kream BE. Bone. 2007;40:1135–1143. doi: 10.1016/j.bone.2006.12.003. [DOI] [PMC free article] [PubMed] [Google Scholar]
- 20.Tetradis S, Nervina JM, Nemoto K, Kream BE. J Bone Miner Res. 1998;13:1846–1851. doi: 10.1359/jbmr.1998.13.12.1846. [DOI] [PubMed] [Google Scholar]
- 21.Nervina JM, Tetradis S, Huang YF, Harrison D, Molina C, Kream BE. Bone. 2003;32:483–490. doi: 10.1016/s8756-3282(03)00056-5. [DOI] [PubMed] [Google Scholar]
- 22.Liu F, Huang YF, Kream BE. Calcif Tissue Int. 2005;77:91–95. doi: 10.1007/s00223-005-0003-1. [DOI] [PubMed] [Google Scholar]
- 23.Favus MJ. Primer on the metabolic bone diseases and disorders of mineral metabolism. American Society for Bone and Mineral Research; Washington, DC: 2006. [Google Scholar]
- 24.Sexton PM, Findlay DM, Martin TJ. Curr Med Chem. 1999;6:1067–1093. [PubMed] [Google Scholar]
- 25.Chabre O, Conklin BR, Lin HY, Lodish HF, Wilson E, Ives HE, Catanzariti L, Hemmings BA, Bourne HR. Mol Endocrinol. 1992;6:551–556. doi: 10.1210/mend.6.4.1316547. [DOI] [PubMed] [Google Scholar]
- 26.Chen Y, Shyu JF, Santhanagopal A, Inoue D, David JP, Dixon SJ, Horne WC, Baron R. J Biol Chem. 1998;273:19809–19816. doi: 10.1074/jbc.273.31.19809. [DOI] [PubMed] [Google Scholar]
- 27.Nicholson GC, Moseley JM, Yates AJ, Martin TJ. Endocrinology. 1987;120:1902–1908. doi: 10.1210/endo-120-5-1902. [DOI] [PubMed] [Google Scholar]
- 28.Su Y, Chakraborty M, Nathanson MH, Baron R. Endocrinology. 1992;131:1497–1502. doi: 10.1210/endo.131.3.1324163. [DOI] [PubMed] [Google Scholar]
- 29.Wada S, Udagawa N, Nagata N, Martin TJ, Findlay DM. Endocrinology. 1996;137:312–320. doi: 10.1210/endo.137.1.8536630. [DOI] [PubMed] [Google Scholar]
- 30.Zaidi M, Datta HK, Moonga BS, MacIntyre I. J Endocrinol. 1990;126:473–481. doi: 10.1677/joe.0.1260473. [DOI] [PubMed] [Google Scholar]
- 31.Suzuki H, Nakamura I, Takahashi N, Ikuhara T, Matsuzaki K, Isogai Y, Hori M, Suda T. Endocrinology. 1996;137:4685–4690. doi: 10.1210/endo.137.11.8895334. [DOI] [PubMed] [Google Scholar]
- 32.Wada S, Udagawa N, Nagata N, Martin TJ, Findlay DM. Endocrinology. 1996;137:1042–1048. doi: 10.1210/endo.137.3.8603572. [DOI] [PubMed] [Google Scholar]
- 33.Molina CA, Foulkes NS, Lalli E, Sassone-Corsi P. Cell. 1993;75:875–886. doi: 10.1016/0092-8674(93)90532-u. [DOI] [PubMed] [Google Scholar]
- 34.Gellersen B, Kempf R, Telgmann R. Mol Endocrinol. 1997;11:97–113. doi: 10.1210/mend.11.1.9875. [DOI] [PubMed] [Google Scholar]
- 35.Harzenetter MD, Novotny AR, Gais P, Molina CA, Altmayr F, Holzmann B. J Immunol. 2007;179:607–615. doi: 10.4049/jimmunol.179.1.607. [DOI] [PubMed] [Google Scholar]
- 36.Nicholson GC, Livesey SA, Moseley JM, Martin TJ. J Cell Biochem. 1986;31:229–241. doi: 10.1002/jcb.240310305. [DOI] [PubMed] [Google Scholar]
- 37.Moonga BS, Alam AS, Bevis PJ, Avaldi F, Soncini R, Huang CL, Zaidi M. J Endocrinol. 1992;132:241–249. doi: 10.1677/joe.0.1320241. [DOI] [PubMed] [Google Scholar]
- 38.Kaji H, Sugimoto T, Miyauchi A, Fukase M, Tezuka K, Hakeda Y, Kumegawa M, Chihara K. Endocrinology. 1994;135:484–487. doi: 10.1210/endo.135.1.8013390. [DOI] [PubMed] [Google Scholar]
- 39.Malgaroli A, Meldolesi J, Zallone AZ, Teti A. J Biol Chem. 1989;264:14342–14347. [PubMed] [Google Scholar]
- 40.Liu F, Lee SK, Adams DJ, Gronowicz GA, Kream BE. Bone. 2007 doi: 10.1016/j.bone.2006.12.003. [DOI] [PMC free article] [PubMed] [Google Scholar]
- 41.Silva OL, Becker KL. Arch Intern Med. 1973;132:337–339. [PubMed] [Google Scholar]
- 42.Binstock ML, Mundy GR. Ann Intern Med. 1980;93:269–272. doi: 10.7326/0003-4819-93-2-269. [DOI] [PubMed] [Google Scholar]
- 43.Wener JA, Gorton SJ, Raisz LG. Endocrinology. 1972;90:752–759. doi: 10.1210/endo-90-3-752. [DOI] [PubMed] [Google Scholar]
- 44.Tashjian AH, Jr, Wright DR, Ivey JL, Pont A. Recent Prog Horm Res. 1978;34:285–334. doi: 10.1016/b978-0-12-571134-0.50012-0. [DOI] [PubMed] [Google Scholar]
- 45.Krieger NS, Feldman RS, Tashjian AH., Jr Calcif Tissue Int. 1982;34:197–203. doi: 10.1007/BF02411233. [DOI] [PubMed] [Google Scholar]
- 46.Feldman RS, Krieger NS, Tashjian AH., Jr Endocrinology. 1980;107:1137–1143. doi: 10.1210/endo-107-4-1137. [DOI] [PubMed] [Google Scholar]
- 47.Wada S, Martin TJ, Findlay DM. Endocrinology. 1995;136:2611–2621. doi: 10.1210/endo.136.6.7750484. [DOI] [PubMed] [Google Scholar]
- 48.Anusaksathien O, Laplace C, Li X, Ren Y, Peng L, Goldring SR, Galson DL. J Biol Chem. 2001;276:22663–22674. doi: 10.1074/jbc.M007104200. [DOI] [PubMed] [Google Scholar]
- 49.Kim Y, Sato K, Asagiri M, Morita I, Soma K, Takayanagi H. J Biol Chem. 2005;280:32905–32913. doi: 10.1074/jbc.M505820200. [DOI] [PubMed] [Google Scholar]
- 50.Shen Z, Crotti TN, Flannery MR, Matsuzaki K, Goldring SR, McHugh KP. Biochim Biophys Acta. 2007;1769:659–667. doi: 10.1016/j.bbaexp.2007.08.005. [DOI] [PubMed] [Google Scholar]
- 51.Bodor J, Bodorova J, Bare C, Hodge DL, Young HA, Gress RE. Eur J Immunol. 2002;32:203–212. doi: 10.1002/1521-4141(200201)32:1<203::AID-IMMU203>3.0.CO;2-C. [DOI] [PubMed] [Google Scholar]
- 52.Bodor J, Habener JF. J Biol Chem. 1998;273:9544–9551. doi: 10.1074/jbc.273.16.9544. [DOI] [PubMed] [Google Scholar]
- 53.Sato K, Suematsu A, Nakashima T, Takemoto-Kimura S, Aoki K, Morishita Y, Asahara H, Ohya K, Yamaguchi A, Takai T, Kodama T, Chatila TA, Bito H, Takayanagi H. Nat Med. 2006;12:1410–1416. doi: 10.1038/nm1515. [DOI] [PubMed] [Google Scholar]
- 54.Sudo H, Kodama HA, Amagai Y, Yamamoto S, Kasai S. J Cell Biol. 1983;96:191–198. doi: 10.1083/jcb.96.1.191. [DOI] [PMC free article] [PubMed] [Google Scholar]
- 55.Lee SK, Lorenzo JA. Endocrinology. 1999;140:3552–3561. doi: 10.1210/endo.140.8.6887. [DOI] [PubMed] [Google Scholar]
- 56.Woitge H, Harrison J, Ivkosic A, Krozowski Z, Kream B. Endocrinology. 2001;142:1341–1348. doi: 10.1210/endo.142.3.8044. [DOI] [PubMed] [Google Scholar]
- 57.Foulkes NS, Borrelli E, Sassone-Corsi P. Cell. 1991;64:739–749. doi: 10.1016/0092-8674(91)90503-q. [DOI] [PubMed] [Google Scholar]
- 58.Shapiro DJ, Sharp PA, Wahli WW, Keller MJ. DNA. 1988;7:47–55. doi: 10.1089/dna.1988.7.47. [DOI] [PubMed] [Google Scholar]
- 59.Smith PK, Krohn RI, Hermanson GT, Mallia AK, Gartner FH, Provenzano MD, Fujimoto EK, Goeke NM, Olson BJ, Klenk DC. Anal Biochem. 1985;150:76–85. doi: 10.1016/0003-2697(85)90442-7. [DOI] [PubMed] [Google Scholar]