

Abstract
Cartilage material properties are important for understanding joint function and diseases, but can be challenging to obtain. Three biphasic material properties (aggregate modulus, Poisson's ratio and permeability) can be determined using an analytical or finite element model combined with optimisation to find the material properties values that best reproduce an experimental creep curve. The purpose of this study was to develop an easy-to-use resource to determine biphasic cartilage material properties. A Cartilage Interpolant Response Surface was generated from interpolation of finite element simulations of creep indentation tests. Creep indentation tests were performed on five sites across a tibial plateau. A least-squares residual search of the Cartilage Interpolant Response Surface resulted in a best-fit curve for each experimental condition with corresponding material properties. These sites provided a representative range of aggregate moduli (0.48–1.58 MPa), Poisson's ratio (0.00–0.05) and permeability (1.7 × 10⁻¹⁵−5.4 × 10⁻¹⁵ m4/N s) values found in human cartilage.
Keywords: cartilage, biphasic theory, indentation testing
1. Introduction
Investigators have long been interested in determining the material properties of cartilage and using that knowledge to answer a variety of important clinical and research questions. For example, investigators have measured cartilage material properties to compare differences among species (Athanasiou et al. 1991, 1995), to compare different anatomical sites in single species (Athanasiou et al. 1994; Froimson et al. 1997) and to study differences between healthy and degenerated cartilage (Rivers et al. 2000; Vasara et al. 2005). Advances in imaging technologies have lead to recent studies that relate cartilage material properties to magnetic resonance imaging characteristics (Kurkijarvi et al. 2004; Nissi et al. 2004; Samosky et al. 2005; Wheaton et al. 2005; Lammentausta et al. 2006).
One common technique for the determination of cartilage material properties involves in vitro indentation testing of osteochondral specimens; also referred to as in situ indentation testing. In the biphasic creep indentation approach, the three biphasic material constants (aggregate modulus, HA; Poisson's ratio, ν and permeability, k) are determined by analysing creep indentation test results with a biphasic material model. The biphasic creep indentation approach was pioneered by Mow and colleagues (Mak et al. 1987; Mow et al. 1989), and the technique remains popular (Setton et al. 1994; Wayne et al. 2003; Roemhildt et al. 2006; Wang et al. 2006).
Creep indentation testing in situ requires access to a testing apparatus as well as an analytical and/or computational method to determine the biphasic material constants from the measured experimental data. The semi-analytic/semi-numerical method (Mak et al. 1987; Mow et al. 1989) and the finite element optimisation method (Athanasiou et al. 1995; Wang et al. 2006) are two established methods for estimating the material constants from experimental data. The biphasic constants are determined by a curve fitting and optimisation process that matches the solution from the analytical/numerical model to the experimental data. The difficulty with these approaches is that they involve the use of relatively sophisticated analytical and/or computational algorithms that require specialised skills to implement. The purpose of this study was to develop a simple-to-use resource to calculate the best-fit linear biphasic constants given existing experimental data from a standardised creep indentation test. This new method separates the finite element computation from the determination of material properties and enables researchers without a strong knowledge of finite elements and optimisation to obtain the material properties of cartilage from creep tests.
2. Methods
2.1 Creep indentation testing
Creep indentation tests were performed on a tibia from a fresh-frozen human knee joint. Five testing sites were selected across the tibia plateau. The testing system was modelled after the system described by Athanasiou et al. (1991). The system consisted of five separate components: computer and data acquisition card (DAQCard 1200, National Instruments, Austin, TX, USA), motion controller/driver (Model ESP300 Universal, Newport Corporation, Irvine, CA, USA), linear actuator (PI 230.25, Physik Instrument, Walbronn, Germany), load cell (1000 g Model 31/1426-02, Sensotec, Columbus, OH, USA) and amplifier (Vishay, Raleigh, NC, USA), and five degree of freedom positioning system. The system used a porous flat-ended indenter (2 mm in diameter) with a small fillet radius (127 μm) to apply a load to the surface of the cartilage. The indenter is made of 316 sintered stainless steel with a 50% porosity. Additional indenters have been manufactured to match the specifications of the indenter used in our finite element model and will be provided for free to any researcher who requests one.
The indenter was brought into contact with the cartilage surface and a small tare load (0.015 N) was allowed to equilibrate to make sure there was contact between the cartilage surface and the indenter. Then indenter force was ramped up to a target force of 0.35 N. The applied load was within ±2% of the target load within 12 s. The target load was then maintained until the slope of the displacement–time curve changed by less than 1.0 nm/s or until 4000 s, whichever occurred first. Data were acquired every 2.5 μm of displacement or every 100 s, whichever occurred first. The displacement of the indenter was monitored during the entire test, and the displacement value was corrected for machine compliance. The creep curve for one specimen is shown in Figure 1.
Figure 1.
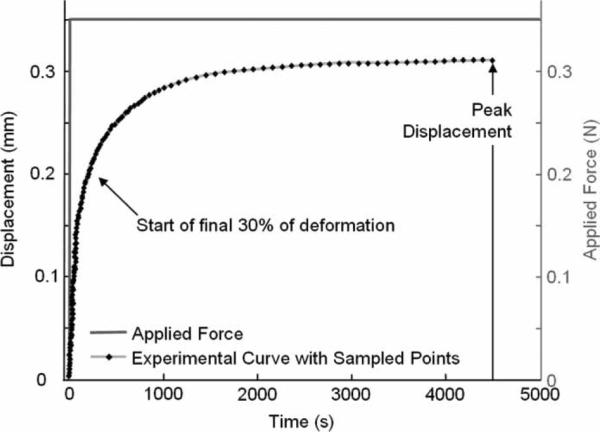
Experimental data and the equally-spaced sampled points on the experimental curve for a creep test. The start of the final 30% of the deformation and the peak displacement are indicated. The applied force profile for the creep test is depicted in grey.
Following the creep indentation test, the specimen thickness was measured at the test site. The needle probe method was used to measure specimen thickness (Athanasiou et al. 1991; Setton et al. 1994; Roemhildt et al. 2006). A validated specimen thickness measurement method is required because specimen thickness is considered a known value in the determination of material properties using the Cartilage Interpolant Response Surface.
2.2 Creation of the Cartilage Interpolant Response Surface
As an alternative to the semi-analytic/semi-numerical and finite element optimisation approaches, we created a simple-to-use resource called the Cartilage Interpolant Response Surface. Creation of the Cartilage Interpolant Response Surface is a two-step process. First, a finite element analysis was used to model the creep indentation test. Second, interpolation was used to create intermediate solutions between neighbouring finite element solutions.
For the finite element analysis, a poroelastic model was used. For quasi-static, small deformation analysis with constant permeability, poroelastic models have been shown to be mathematically equivalent to linear biphasic models (Levenston et al. 1998). The finite element model of the creep test is shown in Figure 2. Axisymmetric, quadrilateral continuum elements with bilinear displacement and bilinear pore pressure shape functions were used. The diameter of the cartilage specimen in the model (10.0 mm) was five times the diameter of the indenter (2.0 mm) to approximate the in situ testing conditions.
Figure 2.
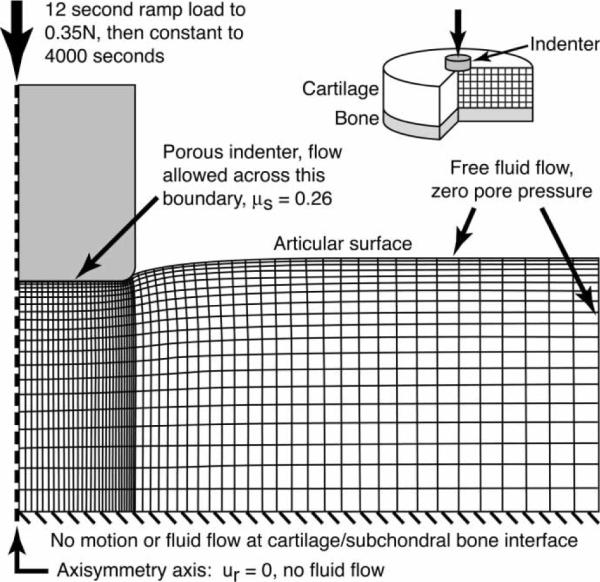
Finite element model of an indentation creep test with a flat, porous indenter having a small filet radius (127 μm) at the outer diameter. The mesh is biased in the radial and axial directions such that the smaller elements are under the indenter corner to reduce non-physiologic stress concentrations.
The indenter was modelled as a porous, rigid surface with a small fillet radius at the outer edge to reduce element distortion, avoid the creation of high strains and singularities within elements at the edge of contact, and reduce nonphysiologic stress concentrations seen with the square cornered indenter. The indenter permeability is several orders of magnitude greater than the permeability of the articular surface of cartilage (Athanasiou et al. 1991). Thus, flow at the cartilage surface has little resistance from the indenter and is modelled with a zero pore pressure boundary condition. Contact between the indenter and the cartilage surface was modelled with an experimentally determined coefficient of friction of μs = 0.26, specific to the indenter used in the experimental test. This value for the static coefficient of friction is similar to values previously used in modelling indenter cartilage contact (Kallemeyn et al. 2006; Li and Herzog 2006).
The nodes in the cartilage portion of the model were linearly biased in both the radial and axial directions to create a finer mesh under the corner of the indenter. The mesh density used was based on a convergence study (not presented).
In the finite element analysis, the applied loading consisted of a linear ramp to 0.35 N over 12 s followed by a constant-load creep phase to a total time of 4000 s. The non-linear, time-dependent finite element model was solved using ABAQUS/Standard (SIMULIA, Providence, RI, USA) with the non-linear geometric analysis option (NLGEOM). The permeability was assumed to be constant for each analysis, i.e. strain-independent.
The Cartilage Interpolant Response Surface was created specifically to model human articular cartilage. In its simplest form the Cartilage Interpolant Response Surface represents a smooth four-dimensional surface; the four variables correspond to cartilage thickness, and the three biphasic constants, HA, ν and k. The range of input values for the finite element analyses (Table 1) was guided by the range of linear biphasic material property values reported for human tibial cartilage (Akizuki et al. 1986). The spacing of values within each range was determined based on a sensitivity analysis (Figures 4–7). The aggregate modulus (HA) total range was broken into two sub-ranges because, all other inputs remaining constant, there was a greater linear variation in end-of-test displacement for lower aggregate modulus than for higher aggregate modulus. In the present implementation, specimen thickness varied from 1.0 to 3.5 mm.
Table 1.
The range of values used to generate the initial range of finite element solutions.
| Parameter | Range of values |
|---|---|
| Aggregate modulus, HA (MPa) | 0.3: 0.1: 0.5 and 0.65: 0.25: 1.9 |
| Poisson's ratio, ν | 0.0: 0.05: 0.30 |
| Permeability, k (10−15m4/N s) | 0.1: 2.0: 8.1 |
| Cartilage thickness (mm) | 1.0: 0.5: 3.5 |
The initial coarse set of solutions was then interpolated to create the fine interpolant response surface. The range of values are given as: lower bound: interval: upper bound.
Figure 4.
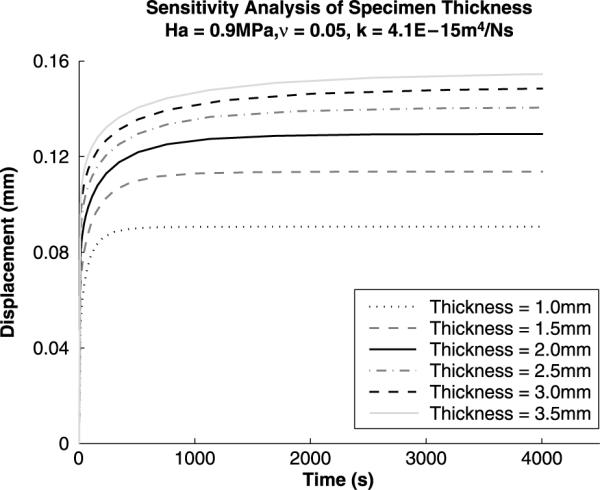
Sensitivity analysis for variations in specimen thickness. A linear increase in specimen thickness results in a non-linear increase in specimen end of test displacement. With increasing specimen thickness, there is a decrease in strain over the cartilage depth.
Figure 7.
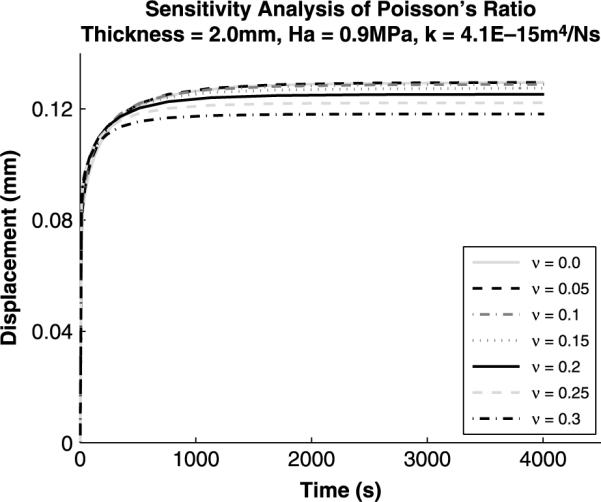
Sensitivity analysis for variations in Poisson's ratio. Poisson's ratio has an effect on both the rate of creep and the end of test displacement.
A total of 1890 finite element solutions were obtained spanning the input range of material properties (Table 1). Each solution represented a specific creep curve corresponding to specific values for cartilage thickness, HA, ν and k. Each ABAQUS-generated solution was sampled at 75 equally spaced points over the entire time period.
The initial Cartilage Interpolant Response Surface consisted of the 1890 discretised curves and was then further refined by interpolation. Shape-preserving, piecewise cubic Hermite polynomials (MATLAB, Mathworks, Inc., Natick, MA, USA) were used to interpolate the coarse Cartilage Interpolant Response Surface to create a fine Cartilage Interpolant Response Surface (Table 2) containing a total of 1,779,570 discretised creep curves. Each of these creep curves was represented by 75 equally spaced sampled points.
Table 2.
The range of values in the Cartilage Interpolant Response Surface.
| Parameter | Range of values |
|---|---|
| Aggregate modulus, HA (MPa) | 0.3: 0.025: 1.9 |
| Poisson's ratio, ν | 0.0: 0.025: 0.30 |
| Permeability, k (10−15m4/N s) | 0.1: 0.1: 8.1 |
| Cartilage thickness (mm) | 1.0: 0.1: 3.5 |
The interpolant response surface was created by interpolating between the curves generated in the initial finite element solutions (these values are presented in Table 1). The range of values for the interpolant response surface is the same as in Table 1 (input parameters to ABAQUS), but the interval between values is smaller. The range of values is given as: lower bound: interval: upper bound.
2.3 Determination of goodness-of-fit
A normalised root mean square error (RMSE) was calculated (Athanasiou et al. 1995) to assess the goodness-of-fit of the Cartilage Interpolant Response Surface approach. The RMSE normalised by peak displacement (Figure 1) was defined as:
| (1) |
N represents the total number of sample points, which ranged from 23 to 38 and depended on the specimen's creep time and total test time. Total test times ranged from 1237 to 2266 s for the specimens used in this study. In Equation (1), n represents each individual sampled point, and Model(tn) and Experimental(tn) represent the displacements at time tn for the model and the experimental creep curve, respectively.
Prior to searching the Cartilage Interpolant Response Surface to find the best-fit to a given experimental creep test, the known thickness of the cartilage specimen was used to decrease the search space to three dimensions corresponding to the three linear biphasic constants. A least-squares residual search was performed over the entire response surface, i.e. a given experimental result was compared with all 68,445 solutions of that thickness in the Cartilage Interpolant Response Surface to find the best-fit. The solution with the lowest normalised RMSE yielded the best-fit biphasic constants.
The initial conditions as modelled are difficult to achieve experimentally: perpendicular contact of the indenter and smooth cartilage surface and linear ramp loading. The data during the initial loading phase, defined to be the first 70% of the deformation, were not used to find the best-fit curve to be consistent with several previous studies that used the semi-analytical/semi-numerical method (Mow et al. 1989; Roemhildt et al. 2006). Removing the initial loading phase retains the final 30% of the displacement data over 90% of the total time (Figure 1). When comparing the Cartilage Interpolant Response Surface curves to the experimental data, the 75 sampled points used in Equation (1) were equally spaced in time over the entire test. Thus, with the removal of the initial loading phase, there were less than 75 sampled points over the final 30% of the displacement (Figure 1).
3. Results
The response surface consistently found displacement–time curves that closely matched experimental data. Representative experimental creep data from a single test site is plotted with matching Cartilage Interpolant Response Surface curve over the final 30% of the displacement (Figure 3). The range of biphasic material property values for the five test sites were aggregate moduli (0.48–1.58 MPa), Poisson's ratio (0.00–0.05) and permeability (1.7 × 10⁻¹⁵−5.4 × 10⁻¹⁵ m4/N s; Table 3). The normalised RMSE averaged for all test sites using the CIRS approach was 1.39%.
Figure 3.
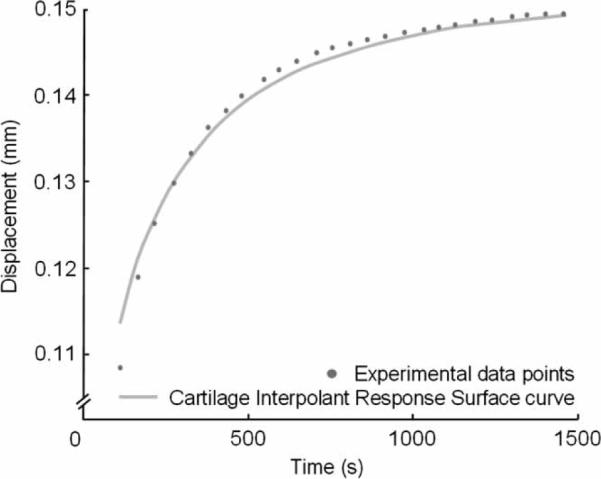
A representative plot of experimental data and best-fit Cartilage Interpolant Response Surface curve for a creep test. The total test time was 1496 s, and there were 26 sampled data points over the final 30% of the deformation.
Table 3.
The cartilage material properties obtained using the Cartilage Interpolant Response Surface method based on the last 30% of the deformation.
| Specimen test site | 1 | 2 | 3 | 4 | 5 |
|---|---|---|---|---|---|
| Thickness (mm) | 2.33 | 1.51 | 1.68 | 2.70 | 1.14 |
| Aggregate modulus (MPa) | 0.73 | 0.75 | 0.70 | 1.58 | 0.48 |
| Poisson's ratio | 0.00 | 0.00 | 0.00 | 0.00 | 0.05 |
| Permeability (10−15m4/N s) | 2.7 | 5.4 | 3.7 | 2.8 | 1.7 |
| Normalised RMSE | 2.37% | 0.374% | 0.677% | 2.38% | 1.15% |
4. Discussion
The purpose of this project was to develop an easy-to-use resource to calculate best-fit biphasic constants based on input from a standardised creep indentation test of human cartilage. Indentation testing is a material property measurement method for intact articular cartilage, but requires complex modelling approaches which may prohibit some researchers from using the indentation method (Lammentausta et al. 2006).
Sensitivity analysis (Figures 4–7) was performed on the Cartilage Interpolant Response Surface to determine the effects of specimen thickness, aggregate modulus, permeability and Poisson's ratio on the solutions. Linearly increasing specimen thickness resulted in a non-linear increase in the end of test displacement (Figure 4). Under the same applied load, increasing the specimen thickness decreases the strain over the cartilage depth. Aggregate modulus affects the end of test displacement value; increasing aggregate modulus decreases the end of test displacement value (Figure 5). Stiffer cartilage is displaced less by the same applied load. In agreement with previous analyses (Mak et al. 1987; Mow et al. 1989), permeability was found to affect the rate of creep of the cartilage (Figure 6). An increase in permeability allows the fluid to flow faster out of the matrix and the cartilage equilibrates faster. Poisson's ratio affects both the end of test displacement value, similar to aggregate modulus, and the rate of creep, similar to permeability (Figure 7). The effects of changing Poisson's ratio are minor compared to changing aggregate modulus or permeability.
Figure 5.
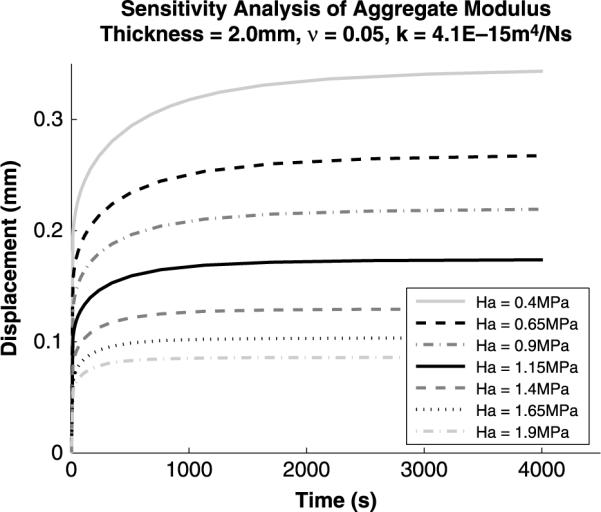
Sensitivity analysis for variations in aggregate modulus. A linear increase in aggregate modulus results in a linear decrease in the end of test displacement. As cartilage stiffness increases there is less displacement under the same applied load.
Figure 6.
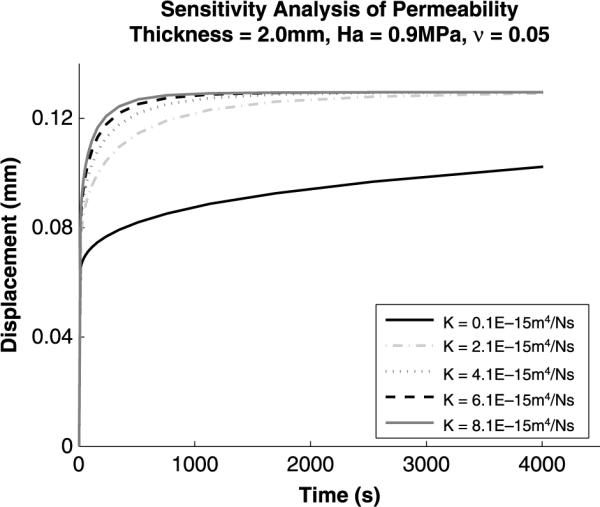
Sensitivity analysis for variations in permeability. An increase in permeability increases the rate of creep, and the cartilage equilibrates faster.
The effect of the coefficient of friction on the interface between the indenter and the articular cartilage was analysed before incorporating friction into the biphasic model for the Cartilage Interpolant Response Surface. The results from the biphasic model of an indentation test with frictionless (μs = 0) and no-slip interface conditions were compared to the experimentally determined friction value of μs = 0.26. First, computational creep curves were created for each interface condition and compared. The no-slip model computational curves had the smallest end-of-test displacement and thus, this interface condition was the stiffest. When determining experimental material property values, the stiff no-slip model underestimated the aggregate modulus values. The relatively compliant frictionless model overestimated the aggregate modulus.
Additionally, comparisons were made for each interface condition using the experimental data. The aggregate moduli from the frictionless model were always greater than or equal to those from the frictional model; the aggregate moduli from the no-slip model were generally less than those from the frictional model. The frictional interface condition calculated different material properties than the frictionless and no-slip interface conditions for experimental creep indentation tests on articular cartilage (results not shown). Frictionless and no-slip contact models represent only idealised approximations of the experiment. Using the experimentally determined coefficient of friction in the indentation model is a better approximation of the experiment.
The Cartilage Interpolant Response Surface will obtain optimal results given the biphasic theory when the predicted values are within the limits specified by the initial search region. Users should be aware that if the Cartilage Interpolant Response Surface predicted-values for either the aggregate modulus or the permeability are at their lower or upper limits the solution should not be trusted; Poisson's ratio solution is valid at the lower bound. In a previous study of patella and femoral cartilage, the Poisson's ratio value was zero for 100 out of 127 test sites (Froimson et al. 1997). If aggregate modulus or permeability is at their bounds, it is likely that the cartilage specimen is abnormal in some way (too thin, degenerated, etc.), and the bounds of the existing Cartilage Interpolant Response Surface do not permit an accurate determination of the biphasic constants. To analyse such a case, a new Cartilage Interpolant Response Surface would have to be created with a greater range for the material property in question.
The Cartilage Interpolant Response Surface is currently limited by the range of input material properties, but this will be expanded to include both diseased and normal cartilage for the entire knee joint. Additionally, it is necessary to use the test load, ramp time and indenter specified by our experimental set-up and to accurately measure specimen thickness at the test site. To assist other researchers, we will provide other investigators with the porous indenter that we used in our experiments.
Cartilage Interpolant Response Surfaces can be created for other experimental test set-ups. Indentation tests are commonly used to determine the material properties of animal cartilage in which the cartilage may be thinner and require a smaller test load (Athanasiou et al. 1991; Cao et al. 2006). Non-permeable indenters and/or hemispherical indenters are also commonly used for indentation testing (Toyras et al. 2001; Samosky et al. 2005; Li and Herzog 2006). Additionally, stress-relaxation tests can be used instead of creep tests to define material properties (Korhonen et al. 2002; Samosky et al. 2005). While not the subject of this paper, we have also created a Cartilage Interpolant Response Surface for a non-permeable hemi-spherical indenter used in a stress-relaxation test.
Mow et al. (1989) and Roemhildt et al. (2006) report difficulties achieving the modelled initial conditions experimentally, such as perpendicular contact of the indenter and smooth cartilage surface and linear ramp loading. To compensate for the differences, the initial 70% of the cartilage deformation is excluded from the determination of the material properties. We compared excluding the initial 30, 50 and 70% of the cartilage deformation when determining the material properties.
Excluding the initial 30, 50 or 70% of the deformation has small changes on the values of aggregate modulus and Poisson's ratio. Permeability has the greatest change; it changed by up to 25% when comparing excluding the initial 30% vs. the initial 70% (Table 4). The normalised RMSE increases by 1.5–2.4 times when excluding only the initial 30% and by 1.4–2 times when excluding only the initial 50% of the deformation compared to excluding the initial 70% of the deformation. The substantial increase in normalised RMSE illustrates that the experimental conditions do not match the model during the early deformation of the cartilage. Based on this analysis, we have decided to continue to remove the initial 70% of the deformation. Removing the initial 70% of the deformation retains over 90% of the total time of the creep test.
Table 4.
Comparison of biphasic material properties obtained at a single test site using the Cartilage Interpolant Response Surface when excluding 30, 50 or 70% of the initial deformation.
| 70% removed | 30% removed | Percent error | 50% removed | Percent error | |
|---|---|---|---|---|---|
| Aggregate modulus (MPa) | 0.73 | 0.73 | 0.0 | 0.3 | 0.0 |
| Poisson's ratio | 0.0 | 0.0 | 0.0 | 0.0 | 0.0 |
| Permeability (10−15m4/N s) | 2.7 | 2.1 | 22.2 | 2.4 | 11.1 |
| Normalised RMSE | 2.37% | 5.55% | 3.98% |
Mow et al. (1989) and Roemhildt et al. (2006) exclude 70% of the initial deformation. Percent error is determined in relationship to the biphasic material properties obtained when excluding 70% of the initial deformation.
Advances in cartilage modelling now account for the anisotropy of the tissue. The transversely isotropic biphasic model (Cohen et al. 1998) uses the entire experimental creep test for back-calculation of material properties and is a logical next step for the Cartilage Interpolant Response Surface method.
Indentation problems may also be solved by recent numerical methods which require more knowledge of finite elements and optimisation algorithms (Cao et al. 2006; Lei and Szeri 2007). Cao et al. (2006) use a biphasic finite element model and perform optimisation with a differential evolution genetic algorithm. The genetic algorithm requires much more time and more expertise to implement than the Cartilage Interpolant Response method. Lei and Szeri (2007) created a general algorithm to determine material parameters from experimental data which is neither load nor model specific. This method is adaptable to various biological soft-tissue problems, but requires finite element software and expertise. Additionally, this method takes 4–12 h for a two-parameter analysis, while the three biphasic material properties are obtained in less than 1 min using the Cartilage Interpolant Response Surface. Our method does not require finite element or optimisation knowledge, and thus it is more accessible.
The response surface is a useful resource for researchers who require cartilage material properties, but do not have the software for optimisation and finite element modelling required to determine material properties from experimental tests. The resource, VA-Squish, can be downloaded for use from https://simtk.org/home/va-squish.
Acknowledgements
We gratefully acknowledge the input from Dr Robert Spilker (Rensselaer Polytechnic Institute) and Dr Kyriacos Athanasiou (Rice University). This study was funded by the following sources: VA Rehabilitation R&D Service (A2592R), Stanford Regenerative Medicine Training Grant (R90 DK071508-02), NIH (EB005790-01), NIH (EB002524-04), and a Bio-X Student Fellowship.
Footnotes
Publisher's Disclaimer: The publisher does not give any warranty express or implied or make any representation that the contents will be complete or accurate or up to date. The accuracy of any instructions, formulae and drug doses should be independently verified with primary sources. The publisher shall not be liable for any loss, actions, claims, proceedings, demand or costs or damages whatsoever or howsoever caused arising directly or indirectly in connection with or arising out of the use of this material.
References
- Akizuki S, Mow VC, Lai WM, Pita J, Howell DS. Topographical variations of the biphasic indentation properties of human tibial plateau cartilage. Transactions of the 32nd Annual Orthopaedic Research Society; New Orleans. February 17–20 1986.1986. p. 406. [Google Scholar]
- Athanasiou KA, Rosenwasser MP, Buckwalter JA, Malinin TI, Mow VC. Interspecies comparisons of in situ intrinsic mechanical properties of distal femoral cartilage. J Orthop Res. 1991;9(3):330–340. doi: 10.1002/jor.1100090304. [DOI] [PubMed] [Google Scholar]
- Athanasiou KA, Agarwal A, Dzida FJ. Comparative study of the intrinsic mechanical properties of the human acetabular and femoral head cartilage. J Orthop Res. 1994;12:340–349. doi: 10.1002/jor.1100120306. [DOI] [PubMed] [Google Scholar]
- Athanasiou KA, Agarwal A, Muffoletto A, Dzida FJ, Constantinides G, Clem M. Biomechanical properties of hip cartilage in experimental animal models. Clin Orthop Relat Res. 1995;316:254–266. [PubMed] [Google Scholar]
- Cao L, Youn I, Guilak F, Setton LA. Compressive properties of mouse articular cartilage determined in a novel micro-indentation test method and biphasic finite element model. J Biomech Eng. 2006;128:766–771. doi: 10.1115/1.2246237. [DOI] [PubMed] [Google Scholar]
- Cohen B, Lai WM, Mow VC. A transversely isotropic biphasic model for unconfined compression of growth plate and chondroepiphysis. J Biomech Eng. 1998;120:491–496. doi: 10.1115/1.2798019. [DOI] [PubMed] [Google Scholar]
- Froimson MI, Ratcliffe A, Gardner TR, Mow VC. Differences in patellofemoral joint cartilage material properties and their significance to the etiology of cartilage surface fibrillation. Osteoarthritis Cartilage. 1997;5:377–386. doi: 10.1016/s1063-4584(97)80042-8. [DOI] [PubMed] [Google Scholar]
- Kallemeyn NA, Grosland NM, Pedersen DR, Martin JA, Brown TD. Loading and boundary condition influences in a poroelastic finite element model of cartilage stresses in a triaxial compression bioreactor. Iowa Orthop J. 2006;26:5–16. [PMC free article] [PubMed] [Google Scholar]
- Korhonen RK, Laasanen MS, Toyras J, Rieppo J, Hirvonen J, Helminen HJ, Jurvelin JS. Comparison of the equilibrium response of articular cartilage in unconfined compression, confined compression and indentation. J Biomech. 2002;35:903–909. doi: 10.1016/s0021-9290(02)00052-0. [DOI] [PubMed] [Google Scholar]
- Kurkijarvi JE, Nissi MJ, Kiviranta I, Jurvelin JS, Nieminen MT. Delayed gadolinium-enhanced MRI of cartilage (dGEMRIC) and T2 characteristics of human knee articular cartilage: topographical variation and relationships to mechanical properties. Magn Reson Med. 2004;52(1):41–46. doi: 10.1002/mrm.20104. [DOI] [PubMed] [Google Scholar]
- Lammentausta E, Kiviranta P, Nissi MJ, Laasanen MS, Kiviranta I, Nieminen MT, Jurvelin JS. T2 Relaxation time and delayed gadolinium-enhanced MRI of cartilage (dGEMRIC) of human patellar cartilage at 1.5 T and 9.4 T: relationships with tissue mechanical properties. J Orthop Res. 2006;24(3):366–374. doi: 10.1002/jor.20041. [DOI] [PubMed] [Google Scholar]
- Lei F, Szeri AZ. Inverse analysis of constitutive models: biological soft tissues. J Biomech. 2007;40:936–940. doi: 10.1016/j.jbiomech.2006.03.014. [DOI] [PubMed] [Google Scholar]
- Levenston ME, Frank EH, Grodzinsky AJ. Variationally derived 3-field finite element formulations for quasistatic poroelastic analysis of hydrated biological tissues. Comput Methods Appl Mech Eng. 1998;156:231–246. [Google Scholar]
- Li LP, Herzog W. Arthroscopic evaluation of cartilage degeneration using indentation testing – influence of indenter geometry. Clin Biomech. 2006;21:420–426. doi: 10.1016/j.clinbiomech.2005.12.010. [DOI] [PubMed] [Google Scholar]
- Mak AF, Lai WM, Mow VC. Biphasic indentation of articular cartilage – I. Theoretical analysis. J Biomech. 1987;20:703–714. doi: 10.1016/0021-9290(87)90036-4. [DOI] [PubMed] [Google Scholar]
- Mow VC, Gibbs MC, Lai WM, Zhu WB, Athanasiou KA. Biphasic indentation of articular cartilage – II. A numerical algorithm and an experimental study. J Biomech. 1989;22(8–9):853–861. doi: 10.1016/0021-9290(89)90069-9. [DOI] [PubMed] [Google Scholar]
- Nissi MJ, Toyras J, Laasanen MS, Rieppo J, Saarakkala S, Lappalainen R, Jurvelin JS, Nieminen MT. Proteoglycan and collagen sensitive MRI evaluation of normal and degenerated articular cartilage. J Orthop Res. 2004;22(3):557–564. doi: 10.1016/j.orthres.2003.09.008. [DOI] [PubMed] [Google Scholar]
- Rivers PA, Rosenwasser MP, Mow VC, Pawluk RJ, Strauch RJ, Sugalski MT, Ateshian GA. Osteoarthritic changes in the biochemical composition of thumb carpometacarpal joint cartilage and correlation with biomechanical properties. J Hand Surg. 2000;25(5):889–898. doi: 10.1053/jhsu.2000.16358. [DOI] [PubMed] [Google Scholar]
- Roemhildt ML, Coughlin KM, Peura GD, Fleming BC, Beynnon BD. Material properties of articular cartilage in the rabbit tibial plateau. J Biomech. 2006;39(12):2331–2337. doi: 10.1016/j.jbiomech.2005.07.017. [DOI] [PMC free article] [PubMed] [Google Scholar]
- Samosky JT, Burstein D, Grimson WE, Howe R, Martin S, Gray ML. Spatially-localized correlation of dGEMRIC-measured GAG distribution and mechanical stiffness in the human tibial plateau. J Orthop Res. 2005;23(1):93–101. doi: 10.1016/j.orthres.2004.05.008. [DOI] [PubMed] [Google Scholar]
- Setton LA, Mow VC, Muller FJ, Pita JC, Howell DS. Mechanical properties of canine articular cartilage are significantly altered following transaction of the anterior cruciate ligament. J Orthop Res. 1994;12(4):451–463. doi: 10.1002/jor.1100120402. [DOI] [PubMed] [Google Scholar]
- Toyras J, Lyyra-Laitinen T, Niinimaki M, Lindgren R, Nieminen MT, Kiviranta I, Jurvelin JS. Estimation of the Young's modulus of articular cartilage using an arthroscopic indentation instrument and ultrasonic measurement of tissue thickness. J Biomech. 2001;24:251–256. doi: 10.1016/s0021-9290(00)00189-5. [DOI] [PubMed] [Google Scholar]
- Vasara AI, Jurvelin JS, Peterson L, Kiviranta I. Arthroscopic cartilage indentation and cartilage lesions of anterior cruciate ligament-deficient knees. Am J Sports Med. 2005;33:208–414. doi: 10.1177/0363546504268040. [DOI] [PubMed] [Google Scholar]
- Wang L, Kalu DN, Banu J, Thomas JB, Gabriel N, Athanasiou KA. Effects of ageing on the biomechanical properties of rat articular cartilage. Proc IMechE Part H: J Eng Med. 2006;220(4):573–578. doi: 10.1243/09544119H04404. [DOI] [PubMed] [Google Scholar]
- Wayne JS, Kraft KA, Shields KJ, Yin C, Owen JR, Disler DG. MR imaging of normal and matrix-depleted cartilage: correlation with biomechanical function and biochemical composition. Radiology. 2003;228(2):493–499. doi: 10.1148/radiol.2282012012. [DOI] [PubMed] [Google Scholar]
- Wheaton AJ, Dodge GR, Elliott DM, Nicoll SB, Reddy R. Quantification of cartilage biomechanical and biochemical properties via T1-rho magnetic resonance imaging. Magn Reson Med. 2005;54:1087–1093. doi: 10.1002/mrm.20678. [DOI] [PubMed] [Google Scholar]