

Abstract
Background
Although the digital rectal exam (DRE) is a common method of screening for prostate cancer and other abnormalities, the limits of ability to perform this hands-on exam are unknown. Perceptible limits are a function of the size, depth, and hardness of abnormalities within a given prostate stiffness.
Methods
To better understand the perceptible limits of the DRE, we conducted a psychophysical study with 18 participants using a custom-built apparatus to simulate prostate tissue and abnormalities of varying size, depth, and hardness. Utilizing a modified version of the psychophysical method of constant stimuli, we uncovered thresholds of absolute detection and variance in ability between examiners.
Results
Within silicone-elastomers that mimic normal prostate tissue (21 kPa), abnormalities of 4 mm diameter (20 mm3 volume) and greater were consistently detectable (above 75% of the time) but only at a depth of 5 mm. Abnormalities located in simulated tissue of greater stiffness (82 kPa) had to be twice that volume (5 mm diameter,40 mm3 volume) to be detectable at the same rate.
Conclusions
This study finds that the size and depth of abnormalities most influence detectability, while the relative stiffness between abnormalities and substrate also affects detectability for some size/depth combinations. While limits identified here are obtained for idealized substrates, this work is useful for informing the development of training and allowing clinicians to set expectations on performance.
Keywords: Palpation, Prostate cancer, Abnormality detection, Medical simulation, Psychophysics
1. Introduction
Prostate cancer has a high incidence rate (one in six for men in the U.S.), with an estimated 192,280 new cases in 2009. When diagnosed in an early and less aggressive stage, the five-year survival rate approaches 100% [1]. To promote early detection, the American Cancer Society advises that screening via the digital rectal examination (DRE) and prostate specific antigen (PSA) blood test be conducted concurrently. The DRE is important because the PSA tends to both over diagnose (65–75% of findings reported as false positives for PSA greater than 4.0 ng/l [2]) and miss cancerous tumors (15.2% of findings reported as false negatives for PSA less than 4.0 ng/l [3]). Although the DRE plays an integral role in early detection and is a skill clinicians are expected to learn, the perceptible limits surrounding this exam are unknown. Therefore, there is no basis from which to set reasonable expectations about clinical performance or to develop appropriate training.
When conducting a DRE, the clinician's task is to detect hard nodules that vary in size, depth and hardness or prostate enlargement that varies in volume change and stiffness. The former typically relate to carcinoma, the latter signal benign prostatic hyperplasia (BPH) or prostatitis [4]. The size, depth, and hardness of nodules and relative stiffness of a given prostate contribute to the perceptible range of abnormalities. At present, neither the thresholds of absolute detection nor variance in ability between examiners have been identified.
In contrast, palpable limits have been studied in terms of the clinical (CBE) and self (BSE) breast exams [5]. In two studies with rubber-like materials, abnormality size emerged as the major dimension affecting the detection of lumps [6,7]. In general, larger lumps in more shallow positions pose the least difficulty. However, simulated lumps as small as 3.0 mm diameter were detectable when embedded in breast-like materials (which is an order of magnitude more pliant than prostate tissue) [9–10]. Aside from the lump size findings, abnormality depth and hardness appear to have a minimal impact, whereas the stiffness of surrounding tissue may decrease one's ability to detect deeper lumps [11].
Hall et al. have shown that training on silicone models effectively increases exam performance on natural breast tissue [12]. Most of their training, and that prescribed by others for use with silicone models [13–17], takes place at the level of hands-on skills. There is a focus on tactile skills because knowledge of disease and attitudes about domain are not strongly related to proficiency [18] and basic rules for diagnosing abnormalities as certain diseases are not difficult to master [19]. One major prerequisite for improving hands-on skills, however, is knowing the limits of tactile sensation, in this case with respect to the DRE.
When characterizing the limits on performance, the DRE differs from the breast exam in several key ways. First, a rectal wall is positioned between the finger and prostate, in addition to a glove and lubricant. Second, the clinician uses a single finger and is more constrained in search movement. Third, the prostate is a stiffer gland with less volume. Fourth, the exam typically takes place in less than 30 s in contrast to 2 min for the breast exam [7,20]. With these differences in mind, one common factor is that clinician performance in both exams does benefit from training.
In this work, the overall goal is to determine the perceptible limits of simulated abnormalities of various size, depth, and hardness within substrates of different stiffness when the examiner is constrained as with a DRE. In addition to determining the thresholds of absolute detection, we seek to determine the degree of variance in ability between examiners.
2. Methods
To analyze the limits of tactile perception in the DRE, we conducted a human-subjects experiment with 18 participants, using simulated prostates where abnormality size, depth, and hardness were varied within substrates of two stiffness levels. The objectives were to determine (1) the size of abnormalities detectable above 75% of the time at three discrete depths, (2) how substrate stiffness impacts the detectability of size/depth combinations, (3) if changes in abnormality hardness (consistent in objectives 1–2) impact detectability over size/depth combinations, (4) if some abnormalities require a minimum hardness be consistently detected, and (5) the variance in ability between participants.
2.1. Apparatus
An apparatus was built specifically for this study. The apparatus utilized silicone-elastomers to simulate the feel of prostate tissue and a rectal wall and employed a computer and electronics to control polyethelene balloons that simulated abnormalities. The computer also monitored the water pressure in the balloons and force on sensors embedded in the simulated tissue. The apparatus design is similar to that described in Ref. [19].
Twenty-three simulated prostates, 30 mm diameter and 20 mm tall, were mounted to a round platform that could be rotated so that the prostate under test was located beneath the examiner's finger. The idealized cyndrilical prostates did not include the surface undulations or an overall walnut shape, although the size was roughly the same as an actual prostate [19]. The platform containing the simulated prostates was housed within a structure that restricted access to and view of the simulated prostates. The examiner inserted his or her finger through an opening in the structure that was built of silicone-elastomer to mimic the rectal wall. The opening was angled at approximately 110° from the participant.
Each simulated prostate included a single polyethelene balloon embedded at one of three depths: 5, 10, and 15 mm. Balloons of seven volumes were used: 20, 40, 80, 200, 470, 1060, and 1770 mm3 that correspond to diameters of 4.0, 5.0, 7.5, 10.0, 15.0, 17.0, and 20.0 mm, respectively. Preliminary studies found that balloons of 3.0 mm diameter were inconsistently detected in stiffer simulated prostates and were not included. The balloons were filled with water, thereby controlling hardness. Balloons could be inflated to be hard, like a rock, but were not detectable when deflated. In this study, three hardnesses were used: 23, 27, and 31 durometers, type Shore A. These fall within the range used for simulated breast tumors [6,7]. Water pressure sensors (Honeywell, SenSym Pressure Sensor, Model SX100DD4) monitored the water pressure over time, which was logged by the computer.
In addition to factors of depth, size, and abnormality hardness, simulated prostates of two stiffness levels were used: 21 and 82 kPa. These have been evaluated via compression tests and fall into the measured range of prostate stiffness (mean elastic modulus = 44.20 kPa, SD = 25.89 kPa [8]). These stiffness values also fall in line with those deemed “realistic” in a subjective study with resident physicians and nurse practioner students [19]. Located in the backing of each prostate were four, laterally spaced pressure sensors (Flexiforce 0–1 lb, Tekscan, South Boston, MA) which logged the examiner's finger pressure over the simulated prostate.
2.2. Participants
Ten male and eight female participants (mean age = 20.4 years, SD = 1.38) were enrolled in the human-subjects study, approved by the IRB at the University of Virginia. No participant had prior clinical experience. A questionnaire also indicated that no participant had any remarkable prior experience working with his or her hands.
2.3. Experimental design
Using a modified version of the psychophysical method of constant stimuli [21], participants palpated the simulated prostates to determine the presence or absence of abnormalities. Typically the method of constant stimuli employs stimulus and blank trials presented in a randomized fashion where all stimulus combinations are presented an equal number of times. However, in the version we employed, we made three modifications to reduce participant fatigue. First, from all possible combinations (abnormality size, depth, hardness and substrate stiffness) only a subset of stimulus combinations were presented to participants (e.g., size 4 mm was used at 5 and 10 mm depth but not 15 mm depth). Pilot testing was conducted to remove combinations that were detectable 0% or 100% of the time. Second, the number of times that each stimulus combination was presented varied from two to four times depending on the difficulty of detecting the abnormality in the pilot study. Specifically, from the chosen subset of abnormalities, the most difficult to detect were presented four times, while the easiest to detect were presented two times. Third, due to hardware and time limitations, participants were presented with stimuli and blanks in one of six pre-determined random orders. Table 1 shows all stimulus combinations used and the number of times each was presented per participant in the experiment.
Table 1.
Stimulus combinations and number of presentations per participant.
| Abnormality dimensions |
Number of presentations at 82kPa stiffness | Number of presentations at 21 kPa stiffness | ||
|---|---|---|---|---|
| Size (diameter in mm) | Depth (mm) | Hardness (durometers, Shore A) | ||
| 4 | 5 | 31 | 4 | 2 |
| 4 | 10 | 31 | 2 | 4 |
| 5 | 5 | 23, 27, 31 | 3*,3*,3* | 3*,3*,2* |
| 5 | 10 | 23, 27, 31 | 3*,3*,3* | 3*,3*,3* |
| 7.5 | 5 | 31 | 3 | – |
| 7.5 | 10 | 31 | 3 | 2 |
| 7.5 | 15 | 31 | – | 4 |
| 10 | 5 | 31 | 2 | – |
| 10 | 10 | 23, 27, 31 | 4, 4, 4 | 4, 4, 2 |
| 10 | 15 | 23, 27, 31 | –, –, 2 | 4, 4, 3 |
| 15 | 10 | 31 | 3 | – |
| 15 | 15 | 23, 27, 31 | 4, 4, 4 | –, –, 2 |
| 17 | 10 | 31 | 2 | – |
| 17 | 15 | 31 | 3 | – |
| 20 | 15 | 31 | 2 | – |
Stimulus combinations only presented in Session 3 and examined by four participants.
2.4. Procedure
Every participant participated in two experimental sessions, held on separate days for 90 min each. In session 1, each participant completed a 5 min pre-test questionnaire, a 5 min hands-on practice, and an 80 min hands-on experiment. During session 2, each participant completed a 5 min hands-on practice, an 80 min hands-on experiment and a 5 min post-test questionnaire. During sessions 1 and 2, participants palpated 96 simulated prostates, half of which contained an abnormality (the balloons were not inflated for the other half). Four participants returned for session 3, which was a 5 min hands-on practice and a 45 min hands-on experiment. Session 3 participants palpated 48 additional simulated prostates, 24 of which contained an abnormality.
Participants were given 20 s to examine a single prostate. At the conclusion of each exam, participants informed the proctor (via “yes” or “no”) as to whether an abnormality was present. Verbal responses were recorded by the proctor on paper. Participants were given a 10 s break between subsequent examinations, a 60 s break after every 10–17 examinations and a 5 min break after every 32–42 examinations. During each exam, the proctor also monitored the pressure exerted on the prostates to ensure that finger pressure remained within 4 and 6 N and that the quadrants were palpated in the specified order. During the hands-on practice session, participants had been taught to utilize a consistent search technique. The technique was to move one's finger across the prostate surface in lines parallel with and then perpendicular to the participant's seated position. When traversing these line paths, participants used small, dime-sized circular motions.
3. Results
The results are summarized in five subsections corresponding with the five objectives.
3.1. Absolute threshold – abnormality size, depth, and substrate stiffness combinations
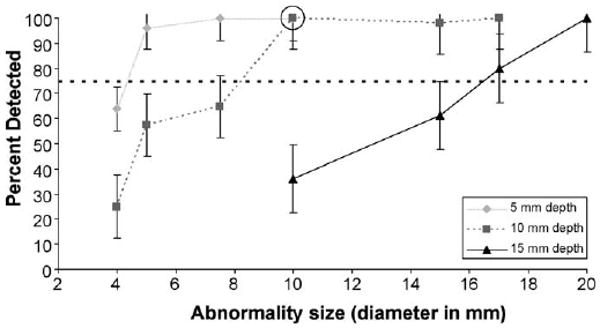
Scenarios across participants were combined to determine the size of abnormalities consistently detectable (above 75% of the time for all participants combined) at the three discrete depths for two levels of prostate stiffness. Deeper abnormalities were more difficult to detect for all abnormality sizes. For the stiffer substrate (82 kPa), the abnormality size threshold was 5 mm diameter at 5 mm depth, 10 mm diameter at 10 mm depth, and 17 mm diameter at 15 mm depth (Fig. 1). For the more pliant substrate (21 kPa), the abnormality size threshold was 4 mm diameter at 5 mm depth, 5 mm diameter at 10 mm depth, and 15 mm diameter at 15 mm depth (Fig. 2). Therefore, both increases to substrate stiffness and abnormality depth make similarly sized abnormalities harder to detect.
Fig. 1.
Psychophysical functions for the detectability of abnormalities at 5, 10 and 15 mm depths as a function of abnormality size for prostate stiffness of 82 kPa. The dotted line denotes the 75% correct threshold. The circle denotes a size/depth combination expected to minimally surpass the 75% threshold when abnormality hardness is decreased, and is referenced in Fig. 3. Standard error bars are shown around the data points.
Fig. 2.
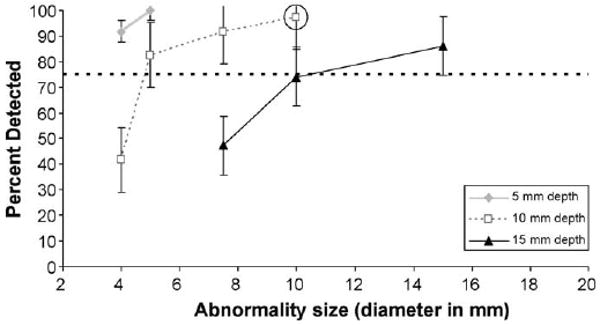
Psychophysical functions for the detectability of abnormalities at 5, 10 and 15 mm depths as a function of abnormality size for prostate stiffness of 21 kPa. The dotted line denotes the 75% correct threshold. The circle denotes a size/depth combination expected to minimally surpass the 75% threshold when abnormality hardness is decreased, and is referenced in Fig. 3. Standard error bars are shown around the data points.
3.2. Effect of substrate stiffness on abnormality detection
The detection rate for larger abnormalities in stiffer substrates (Fig. 1) is similar to smaller abnormalities in more pliant substrates (Fig. 2), given equal depth. For example, at a depth of 15 mm, 17 mm abnormalities in the 82 kPa substrate were detected at approximately the same percentage (80%) as 10 mm abnormalities in the 21 kPa substrate (74%).
3.3. Effect of abnormality hardness on abnormality detection
To investigate the effect of abnormality hardness (held constant in objectives 1–2) on detectability, we analyzed specific size/depth combinations that were expected to minimally surpass the 75% threshold when abnormality hardness was decreased (see circled data points in Fig. 1 and Fig. 2). Fig. 3 illustrates the impact of varying the hardness of an abnormality that is 10 mm diameter and 10 mm depth, for both 21 and 82 kPa substrates. At the lowest abnormality hardness (23 durometers, type Shore A) the detect-ability rate in the stiffer substrate (82 kPa) drops close to the 75% threshold from the 100% detectable threshold when its hardness is greater. In contrast, the detectability rate in the more pliant substrate (21 kPa) was unaffected by changes to abnormality hardness.
Fig. 3.
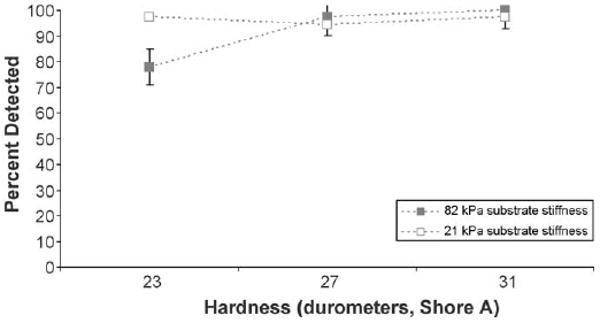
Psychophysical functions for the detectability of abnormalities 10 mm diameter at 10 mm depth as a function of abnormality hardness for prostate stiffness levels of 82 and 21 kPa. Standard error bars are shown around the data points.
3.4. Absolute threshold – abnormality hardness
Some size/depth combinations require a minimum abnormality hardness to be detected 75% of the time. Fig. 4 shows how abnormality hardness affects the detectability of four different size/depth combinations in both substrates. In stiffer substrates (two top plots – 82 kPa), the decrease in detection rate with changes in the abnormality hardness is more evident. The detection rate decreased by 38% (Fig. 4a) and by 42% (Fig. 4b) when the hardness of the two abnormalities decreased from 31 to 23 durometers. In contrast for the 21 kPa simulated prostates, the detection rate exhibited a more gradual decrease (by 10% (Fig. 4c) and by 14% (Fig. 4d)) when abnormality hardness was decreased.
Fig. 4.
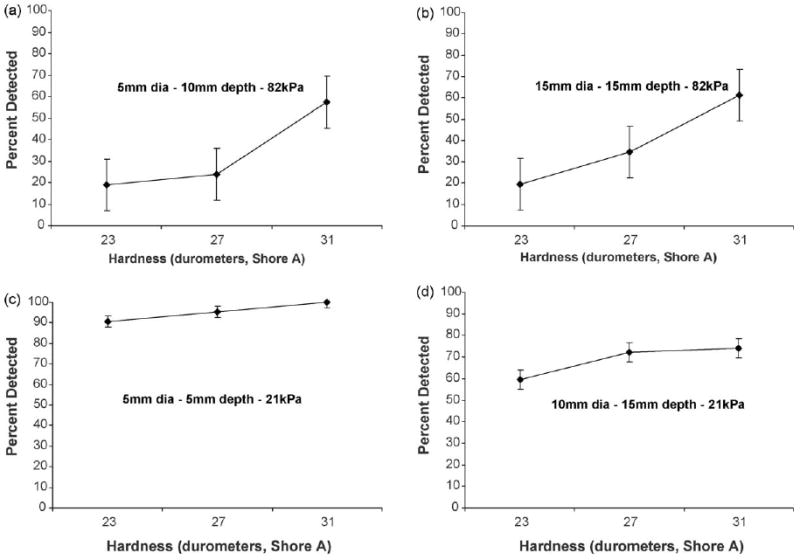
Psychophysical functions for the detectability of four different size/depth combinations in two prostate stiffness levels as a function of abnormality hardness: (a) 5 mm diameter abnormality at a 10 mm depth embedded within prostate of stiffness 82 kPa, (b) 15 mm diameter abnormality at a 15 mm depth embedded within prostate of stiffness 82 kPa, (c) 5 mm diameter abnormality at a 5 mm depth embedded within prostate of stiffness 21 kPa, (d)10 mm diameter abnormality at a 15 mm depth embedded within prostate of stiffness 21 kPa. Standard error bars are shown around the data points.
3.5. Variance in detection performance between examiners
Detection varied across stimulus combinations (abnormality size, depth, hardness and substrate stiffness) encountered by each participant and also between participants. The hit rate for each participant was defined as the number of abnormalities detected by the participant divided by the total number of abnormalities presented to that participant. Participants' hit rates ranged from 95.8% to 48.5% (mean = 74.0%, SD = 13.0%), as indicated by the solid points in Fig. 5. Three (out of 18) participants were below one standard deviation of the mean hit rate. The distribution of participants' hit rates is shown in Fig. 6.
Fig. 5.
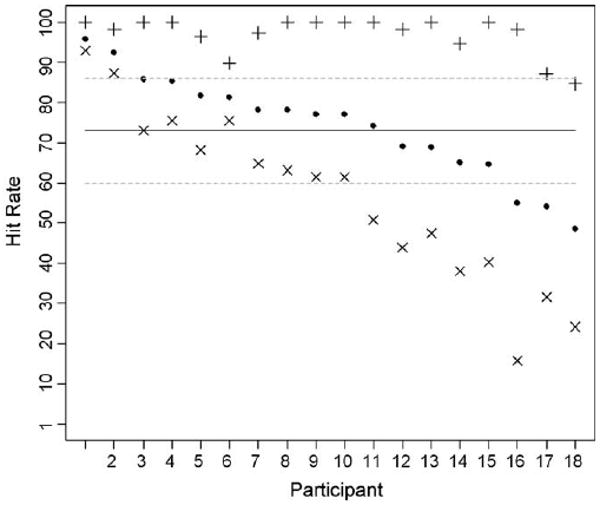
Hit rates for all 18 participants. The solid points represent the hit rate for all stimulus combinations, the crosses (+) represent the hit rate for “easy” stimulus combinations, and the exes (×) represent the hit rates for “difficult” stimulus combinations. The solid line represents the mean hit rate for all stimulus combinations and the dashed lines represent one standard deviation above or below the mean hit rate for all stimulus combinations.
Fig. 6.
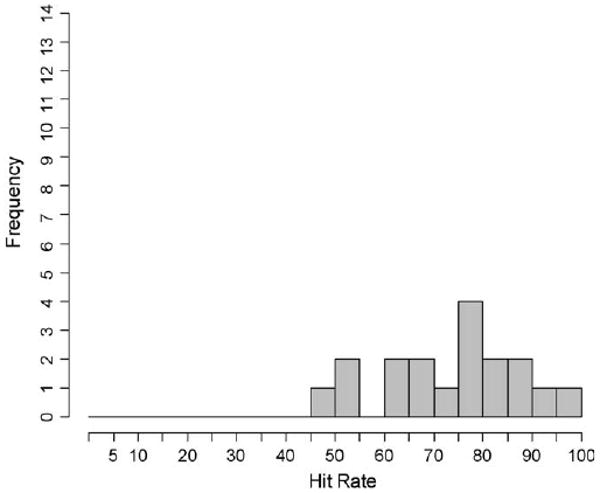
Distribution of participants' hit rates for all stimulus combinations.
Furthermore, all stimulus combinations that were detected more than 90% of the time (from Figs. 1 and 2) were classified as “easy” stimulus combinations. All stimulus combinations that were detected less than 90% of the time were classified as “difficult” stimulus combinations. Participants' hit rates for “easy” stimulus combinations are indicated by the crosses (+) in Fig. 5, whereas hit rates for “difficult” stimulus combinations are indicated by the exes (χ). The mean hit rate for all participants decreased (96.9% to 56.4%) while the standard deviation in hit rate increased (4.8% to 21.4%) from the “easy” to “difficult” stimulus combinations. Fig. 7 shows the hit rate distributions for these subsets of stimulus combinations.
Fig. 7.
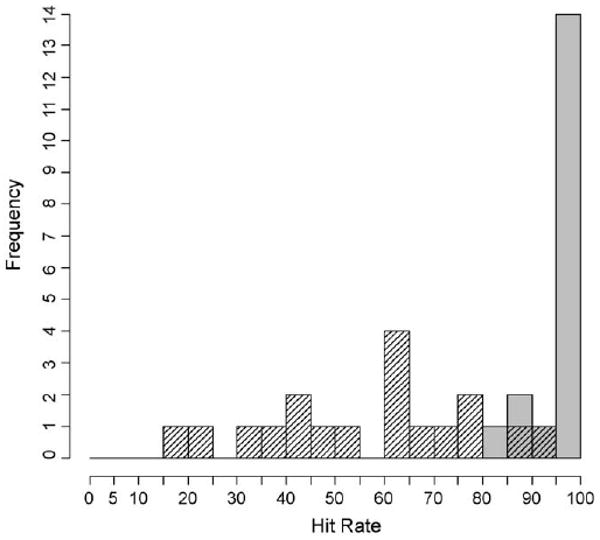
Distribution of participants' hit rates for “easy” and “difficult” stimulus combinations. The “easy” stimulus combinations are indicated by the solid grey bars and the “difficult” stimulus combinations are indicated by the shaded bars.
The Pearson's product-moment correlation model was used to determine that there was no significant correlation between participants' hit rates and false alarm rates (r = -0.174, p = 0.489) for all stimulus combinations (Fig. 8).
Fig. 8.
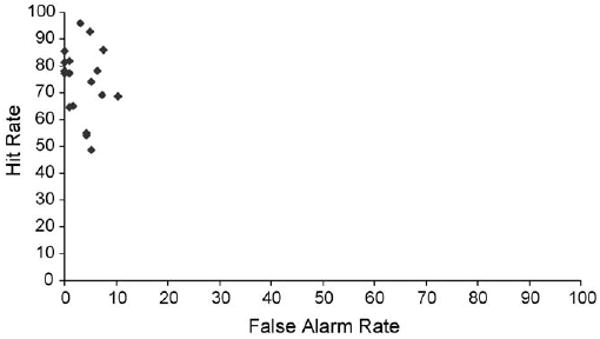
Hit rate for all stimulus combinations versus false alarm rate for each participant.
4. Discussion
This study sought to characterize the range of prostate abnormalities that are palpable via digital rectal examination. Among the four factors (abnormality size, depth, hardness, and substrate stiffness), our overall finding was that at a depth of 5 mm, the majority of abnormalities can be detected independent of prostate stiffness or abnormality hardness or size. However, abnormalities located more deeply must be larger to be consistently detected. This is especially pertinent for the stiffer substrates, where abnormalities must be 10– 17 mm diameter to be consistently detected at depths 10– 15 mm. In more pliant substrates, detectable abnormalities at depths 10–15 mm are smaller (5–10 mm diameter). These results may aid in the development of training regimens so that scenarios utilize reasonable ranges per the four factors. Additionally the between examiner variance may also have implications in the clinic for a starting point in placing expectations on detection performance.
In comparison to simulated breast lumps, we found that the size of prostate abnormalities had be larger to be consistently detectable (5 mm compared to 3 mm) [6,7]. Additionally, our study found that depth played a larger role in abnormality detection. These findings are most likely due to the differences in substrate stiffness (21 or 82 kPa compared to 1–5 kPa).
Compared to size and depth, the hardness of an abnormality did not play as large a role, similar to results related to simulated breast tissue [6]. While hardness was not as prominent a factor overall, it did emerge as relevant when substrate stiffness and abnormality hardness were varied for the more deeply embedded (5–15 mm diameter and 10–15 mm depth) abnormalities. Detecting the hardness of an abnormality is most pertinent to detecting changes in prostate stiffness due BPH or prostititus, and therefore is relevant to larger and more deeply embedded tumors.
When we considered the performance of individual examiners, we uncovered that there were clearly a set of “easy” and “difficult” stimulus combinations. More effective training may need to be developed that reduces the number of “easy” training scenarios that yield high levels of detection performance and little variance between examiners. It is clearly the “difficult” scenarios that yield a lower level of detection performance and greater variability.
This experiment utilized simulated prostates in a simulated environment. The simulated prostates did not include fibrous tissue, varying surface texture, or undulations of the surface. Additionally, the experimental environment lacked any of the typical patient–clinician interactions. Ideally, future studies will augment our findings by using in vivo human prostate tissue with known abnormalities of various size, depth, and hardness. As a first approximation, however, this study afforded a repeatable and controlled method and the results are valuable for gathering data on thresholds of detection and variance between examiners, similar to that done for the breast exam.
In relation, when analyzing the individual examiners, we also identified a low false alarm rate. This is likely because the simulated prostates did not include non-homogenous, fibrous tissue. The introduction of such elements would likely increase detection thresholds. That said, our false alarm finding does not indicate that better detectors are more willing to answer “yes” to improve their performance. Finally, participants were required to use the defined search technique. Other work indicates that search technique plays a role in detection performance [22] and should inform investigations, similar to that presented in here, to further quantify the impact of technique on improving the detection of smaller and deeper tumors.
Acknowledgments
The authors would like to acknowledge the support and clinical guidance of Marcus L. Martin, M.D. (School of Medicine, University of Virginia) and Reba Moyer Childress, SN, FNP, APRN-BC (School of Nursing, University of Virginia). The research described was supported in part by Grant Number T15LM009462 from the National Library of Medicine. The content is solely the responsibility of the authors and does not necessarily represent the official views of the National Library of Medicine or the National Institutes of Health.
Sources of support: (1) The Congressionally Directed Medical Research Program administered by the Department of the Army and (2) The National Library of Medicine T15 training grant: A Systems Engineering Focus on Medical Informatics
Abbreviations
- DRE
digital rectal examination
- PSA
prostate specific antigen
- BPH
benign prostatic hyperplasia
- CBE
clinical breast examination
- BSE
self breast examination
- kPa
kilopascals
Footnotes
Conflict of interest
None.
Publisher's Disclaimer: This article appeared in a journal published by Elsevier. The attached copy is furnished to the author for internal non-commercial research and education use, including for instruction at the authors institution and sharing with colleagues.
Other uses, including reproduction and distribution, or selling or licensing copies, or posting to personal, institutional or third party websites are prohibited.
In most cases authors are permitted to post their version of the article (e.g. in Word or Tex form) to their personal website or institutional repository. Authors requiring further information regarding Elsevier's archiving and manuscript policies are encouraged to visit:
Contributor Information
Leigh A. Baumgart, Email: lab3h@virginia.edu.
Gregory J. Gerling, Email: gg7h@virginia.edu.
Ellen J. Bass, Email: ejb4n@virginia.edu.
References
- 1.American Cancer Society. Overview: Prostate cancer. 2009 [cited 03/10/09]; Available from: http://www.cancer.org/docroot/CRI/CRI_2_1x.asp?rnav=criov&dt=36.
- 2.Smith DS, Humphrey PA, Catalona WJ. The early detection of prostate carcinoma with prostate specific antigen. Cancer. 1997;80(9):1852–6. [PubMed] [Google Scholar]
- 3.Thompson IM, Pauler DK, Goodman PJ, Tangen CM, Lucia MS, Parnes HL, et al. Prevalence of prostate cancer among men with a prostate specific antigen level <=4.0 ng per milliliter. N Engl J Med. 2004;350(22):2239–46. doi: 10.1056/NEJMoa031918. [DOI] [PubMed] [Google Scholar]
- 4.Jarvis C. Physical Examination And Health Assessment. 4th. St. Louis, MO: Saunders; 2004. [Google Scholar]
- 5.Güth U, Huang DJ, Huber M, Schötzau A, Wruk D, Holzgreve W, et al. Tumor size and detection in breast cancer: Self-examination and clinical breast examination are at their limit. Cancer Detect Prev. 2008;32(3):224–8. doi: 10.1016/j.cdp.2008.04.002. [DOI] [PubMed] [Google Scholar]
- 6.Bloom HS, Criswell EL, Pennypacker HS, Catania AC, Adams CK. Major stimulus dimensions determining detection of simulated breast lesions. Percept Psychophys. 1982;32(3):251–60. doi: 10.3758/bf03206229. [DOI] [PubMed] [Google Scholar]
- 7.Fletcher SW, O'Mailey MS, Bunce LA. Physicians' ability to detect lumps in silicone breast models. J Am Med Assoc. 1985;253(15):2224–8. [PubMed] [Google Scholar]
- 9.Krouskop T, Wheeler T, Kallel F, Garra B, Hall T. Elastic moduli of breast and prostate tissues under compression ultrasound. Imaging. 1998;20:260–74. doi: 10.1177/016173469802000403. [DOI] [PubMed] [Google Scholar]
- 10.Samani A, Bishop J, Luginbuhl C, Plewes D. Measuring the elastic modulus of ex-vivo small tissue samples. Phys Med Biol. 2003;48:2183–98. doi: 10.1088/0031-9155/48/14/310. [DOI] [PubMed] [Google Scholar]
- 11.McDermott MM, Dolan NC, Huang J, Reifler D, Rademaker AW. Lump detection is enhanced in silicone breast models simulating postmenopausal breast tissue. J Gen Intern Med. 1996;11(2):112–4. doi: 10.1007/BF02599588. [DOI] [PubMed] [Google Scholar]
- 12.Hall DC, Adams CK, Stein GH, Stephenson HS, Goldstein MK, Pennypacker HS. Improved detection of human-breast lesions following experimental training. Cancer. 1980;46(2):408–14. doi: 10.1002/1097-0142(19800715)46:2<408::aid-cncr2820460233>3.0.co;2-p. [DOI] [PubMed] [Google Scholar]
- 13.Pilgrim CA, Lannon C, Harris PR, Cogburm W, Fletcher SW. Improving clinical breast examination training in a medical school. J Gen Intern Med. 1993;8(12):685–8. doi: 10.1007/BF02598289. [DOI] [PubMed] [Google Scholar]
- 14.McDermott MM, Dolan NC, Rademaker A. Effect of breast tissue characteristics on the outcome of clinical breast examination training. Acad Med. 1996;71(5):505–7. doi: 10.1097/00001888-199605000-00024. [DOI] [PubMed] [Google Scholar]
- 15.Pennypacker H, Iwata M. MammaCare: a case history in behavioural medicine. In: Blackman D, Lejeune H, editors. Behaviour Analysis in Theory and Practice. Hillsdale, N.J: Lawrence Erlbaum Assoc; 1991. pp. 259–288. [Google Scholar]
- 16.Gerling GJ, Weissman AM, Thomas GW, Dove EL. Effectiveness of a dynamic breast examination training model to improve clinical breast examination (CBE) skills. Cancer Detect Prev. 2003;27(6):451–6. doi: 10.1016/j.cdp.2003.09.008. [DOI] [PubMed] [Google Scholar]
- 17.Iannotti RJ, Finney LJ, Sander AA, De Leon JM. Effect of clinical breast examination training on practitioner's perceived competence. Cancer Detect Prev. 2002;26(2):146–8. doi: 10.1016/s0361-090x(02)00029-6. [DOI] [PubMed] [Google Scholar]
- 18.Lee KC, Dunlop D, Dolan NC. Do clinical breast examination skills improve during medical school? Acad Med. 1998;73(9):1013–9. doi: 10.1097/00001888-199809000-00025. [DOI] [PubMed] [Google Scholar]
- 19.Gerling GJ, Rigsbee S, Childress RM, Martin ML. The design and evaluation of a computerized and physical simulator for training clinical prostate exams. IEEE Trans Syst Man Cybern A Syst Hum. 2009;39(2):388–403. [Google Scholar]
- 20.Campbell HS, Fletcher SW, Pilgrim CA, Morgan TM, Lin S. Improving physicians' and nurses' clinical breast examination: a randomized controlled trial. Am J Prev Med. 1991;7(1):1–8. [PubMed] [Google Scholar]
- 21.Gescheider GA. Psychophysics: the fundamentals. Lawrence Erlbaum Associates; 1997. [Google Scholar]
- 22.Wang N, Gerling GJ, Childress RM, Martin ML. Characterizing Finger Palpation in the Detection of Prostate Cancers and Abnormalities. Proceedings of the Human Factors and Ergonomics Society Annual Meeting. 2008:813–7. [Google Scholar]