

Abstract
Enhancing reading ability in peripheral vision is important for the rehabilitation of people with central-visual-field loss from age-related macular degeneration (AMD). Previous research has shown that perceptual learning, based on a trigram letter-recognition task, improved peripheral reading speed among normally-sighted young adults (Chung, Legge & Cheung, 2004). Here we ask whether the same happens in older adults in an age range more typical of the onset of AMD. Eighteen normally-sighted subjects, aged 55 to 76 years, were randomly assigned to training or control groups. Visual-span profiles (plots of letter-recognition accuracy as a function of horizontal letter position) and RSVP reading speeds were measured at 10° above and below fixation during pre- and post-tests for all subjects. Training consisted of repeated measurements of visual-span profiles at 10° below fixation, in 4 daily sessions. The control subjects did not receive any training. Perceptual learning enlarged the visual spans in both trained (lower) and untrained (upper) visual fields. Reading speed improved in the trained field by 60% when the trained print size was used. The training benefits for these older subjects were weaker than the training benefits for young adults found by Chung et al. Despite the weaker training benefits, perceptual learning remains a potential option for low-vision reading rehabilitation among older adults.
Introduction
Age-related macular degeneration (AMD) afflicts approximately one out of ten Americans aged 80 years and older (Eye Disease Prevalence Research Group, 2004). Advanced AMD often results in bilateral central scotomas, damaging the fovea. AMD patients with central scotomas have to rely on their peripheral vision for daily visual functions such as reading. Since normal peripheral reading is difficult and slow (Chung, Mansfield & Legge, 1998), it is not surprising that AMD patients with central scotomas always have reduced reading performance (Faye, 1984; Fine & Peli, 1995; Fletcher, Schuchard & Watson, 1999; Legge, Ross, Isenberg & LaMay, 1992; Legge, Rubin, Pelli & Schleske, 1985). The current study investigated the possibility of improving peripheral reading performance in a group of normally sighted older people using perceptual learning with a simple trigram letter-recognition task.
Conventional rehabilitation for AMD patients with central scotomas often includes training on eccentric viewing and magnifier usage (Goodrich et al., 2004; Goodrich & Mehr, 1986; Holcomb & Goodrich, 1976; Nilsson & Nilsson, 1986; Stelmack, Massof & Stelmack, 2004). Eccentric-viewing and magnifier-usage training has been shown to improve reading performance among AMD patients (Cheong, Lovie-Kitchin, Bowers & Brown, 2005; Goodrich et al., 2004; Nilsson, Frennesson & Nilsson, 1998, 2003). These rehabilitation efforts focus on teaching the patients strategies to deal with their vision loss, and how to use their low-vision aids effectively.
Alternatively, the perceptual system can be modified or “retuned” through perceptual learning (see Gibson (1963) and Goldstone (1998) for reviews). Gibson (1963, p. 29) defined perceptual learning as “[any] relatively permanent and consistent change in the perception of a stimulus array, following practice or experience with this array.” Some researchers have shown that low-vision patients may benefit from perceptual learning (Chung, Legge & Cheung, 2004; Legge et al., 2008; Sommerhalder et al., 2003).
Recent research findings suggest that letter recognition imposes a perceptual limit on word recognition and reading speed (Legge et al., 2007; Legge, Mansfield & Chung, 2001; Pelli, Farell & Moore, 2003; Pelli & Tillman, 2007). Visual span is a spatial property of the visual field defined as the number of characters that can be recognized without moving the eyes (Legge, Ahn, Klitz & Luebker, 1997; O’Regan, 1990). Since shrinkage of the visual span has been shown to limit normal peripheral reading (Legge, Mansfield & Chung, 2001), peripheral reading speed may improve if the size of the peripheral visual span is enlarged.
Chung, Legge and Cheung (2004) showed that perceptual learning enlarged the visual-span size in normal peripheral vision in a group of young adults. They also found a corresponding improvement in reading speed. Chung et al.’s study raised the possibility of benefits of perceptual learning in improving reading performance among AMD patients with central scotomas. However, Chung et al.’s study was conducted with young normally sighted adults, whereas the onset of AMD typically occurs after 60 years of age.
Perceptual learning in vision has been found to have neural correlates in the visual cortex (Karni & Sagi, 1991; Neary, Anand & Hotson, 2005; Schoups, Vogels, Qian & Orban, 2001; Schwartz, Maquet & Frith, 2002; Song et al., 2005; Yang & Maunsell, 2004). Recent research has suggested that plasticity in the perceptual system decreases with aging (Smirnakis et al., 2005; Sunness, Liu & Yantis, 2004). If perceptual learning in the visual system depends on reorganization in visual cortex, decreased cortical plasticity in aging could have adverse implications for the potential benefits of visual perceptual learning in older adults.
In this study, we used a similar perceptual-learning paradigm as in Chung, Legge and Cheung’s study and report results from a group of older subjects. If similar learning effects can be demonstrated in older normally sighted subjects, there would be an increased likelihood that such perceptual learning could be used in low-vision reading rehabilitation. On the other hand, reduced perceptual learning in this older group could reveal decreased plasticity in the visual system with aging.
Methods
Subjects
Eighteen normally-sighted adults (10 females and 8 males) aged 55 to 76 years were recruited from the University of Minnesota Retirees Volunteer Center to participate in this study. Refractive errors were corrected using trial lenses. Our subjects were randomly assigned to a training group (T1 to T9) and an age-matched control group (C1 to C9). Informed consent was obtained from each subject before the experiment. Subjects received monetary compensation for their time. The protocol of this study followed the tenets of the Declaration of Helsinki and was approved by the Institutional Review Board of the University of Minnesota.
Prior to the experiments, each subject was tested on four clinical vision tests: (a) the Lighthouse Distance Visual Acuity Test (Optelec US Inc, Massachusetts, USA), (b) the Pelli-Robson Contrast Sensitivity Test (Haag-Streit UK, Essex UK) (Pelli, Robson & Wilkins, 1988), (c) the Lighthouse Near Visual Acuity Test (Optelec US Inc, Massachusetts, USA), and (d) the MNREAD Reading Acuity Test (Optelec US Inc, Massachusetts, USA) (Mansfield, Ahn, Legge & Luebker, 1993; Mansfield & Legge, 2007). All tests were done binocularly.
Subjects were tested on the MNREAD in both regular and reversed contrast polarities. The three summary measures from the MNREAD test, reading acuity, critical print size and maximum reading speed, were calculated using the method described by Cheung, Kallie, Legge & Cheong (2008). Table 1 summarizes the results of the clinical vision tests. We found no significant difference (uncorrected ps > 0.05) between the control and the training groups in age and the measures from the clinical vision tests.
Table 1.
Summary table of clinical test results. W is the Wilcoxon two-sample rank sum statistic1 (Wilcoxon, 1945) and is the sum of the ranks for the control group with the minimum (sum of 1 to 9, i.e., 45) subtracted. p is the two-sided p-value associated with W.
| Control | Training | |||||
|---|---|---|---|---|---|---|
| Mean (SD) | Median | Mean (SD) | Median | W | p | |
| Age (year) | 65.4 (7.6) | 68 | 65.6 (8.2) | 64 | 37 | 0.790 |
| Distance visual acuity (logMAR) | −0.11 (0.11) | −0.12 | −0.17 (0.06) | −0.20 | 56.5 | 0.169 |
| Near visual acuity (logMAR) | 0.00 (0.10) | −0.02 | −0.01 (0.09) | 0.00 | 39.5 | 0.965 |
| Log contrast sensitivity | 1.90 (0.07) | 1.88 | 1.93 (0.07) | 1.95 | 30 | 0.347 |
| MNREAD–regular polarity | ||||||
| Reading acuity (logMAR) | −0.06 (0.11) | −0.11 | −0.14 (0.13) | −0.14 | 54 | 0.251 |
| Critical print size (logMAR) | 0.18 (0.17) | 0.15 | 0.13 (0.15) | 0.12 | 45 | 0.730 |
| Maximum reading speed (wpm) | 177.07 (20.11) | 177.84 | 194.04 (25.38) | 196.52 | 26 | 0.222 |
| MNREAD–reversed polarity | ||||||
| Reading acuity (logMAR) | −0.05 (0.15) | −0.02 | −0.13 (0.12) | −0.16 | 52 | 0.331 |
| Critical print size (logMAR) | 0.18 (0.13) | 0.17 | 0.08 (0.14) | 0.03 | 60 | 0.094 |
| Maximum reading speed (wpm) | 170.26 (19.34) | 171.00 | 186.58 (24.40) | 188.97 | 26 | 0.222 |
Experimental design
The basic design of the current experiment was similar to that of Chung, Legge and Cheung (2004). Pre- and post-tests for both the control (C1 to C9) and the training (T1 to T9) subjects consisted of measurements of visual-span profiles and RSVP reading speeds at 10° eccentricity in both upper and lower visual fields. Schuchard, Naseer and de Castro (1999) reported a median scotoma height of 18° among 255 patients (see Cheung & Legge (2005) for a review). If the scotoma was approximately centered at the fovea, a retinal location near the scotoma boundary that could be used for reading in these patients would be approximately 10° away from the fovea. Taking 10° eccentricity as representative of a field location used for reading in AMD, we tested our subjects at 10° eccentricity in the upper and lower visual fields. These same retinal locations were also used in the study by Chung, Legge and Cheung (2004).
The training subjects participated in four consecutive days of training between the pre- and post-tests. Training consisted of repeated measurements of visual-span profiles at 10° eccentricity in the lower visual field, the same as one of the two retinal locations used in the pre- and post-tests. No feedback was provided during training. Pre- and post-tests were six days apart for both the training subjects and the control subjects, who did not receive any training. We also tested the untrained upper visual field in both pre- and post-tests to assess whether training effects would transfer to an untrained retinal location.
Visual-span profile measurements
Visual-span profiles were measured using the methods described in previous studies (Chung, Legge & Cheung, 2004; Legge et al., 2007; Legge, Mansfield & Chung, 2001; Yu, Cheung, Legge & Chung, 2007). The stimuli used were trigrams, random strings of three letters taken from the 26 lower-case letters of the English alphabet, presented in Courier font. Repeats of letters within a trigram were allowed. Subjects were asked to recognize trigrams presented at different horizontal distances from the midline, measured in number of letter positions. Figure 1 shows an example of a visual-span profile.
Figure 1.

Example of a visual-span profile. In a visual-span profile, letter-recognition accuracy (proportion correct) is plotted against letter position left or right of the midline. Letter-recognition accuracy is measured with trigram stimuli, random strings of three letters. In this example, the trigram for the lower visual field (VF) presentation, “lmy”, is at letter position +3, indicating that the middle letter of the trigram is located at 3 letter positions to the right of the midline. The trigram for the upper VF, “olf”, is at letter position −4. Letter-recognition accuracy is calculated by accumulating data from multiple trigram trials at each letter position. Proportion correct for letter recognition at each letter position is converted into information transmitted in bits. The area under the visual span indicates the visual-span size. Using letter positions −4 to +4, the visual span in this figure transmits 28.5 bits of information. In the current study, subjects fixated on a green dot 10° above or below letter position 0.
Subjects fixated on a green dot 10° above or below letter position 0. Print size was fixed at an x-height of 3.5°, which was larger than the critical print size at 10° in young adults (Chung, Legge & Cheung, 2004; Chung, Mansfield & Legge, 1998), for all visual-span profile measurements (including pre- and post-test trials for both control and training groups, and training trials for the training group). Subjects pressed a button to trigger each trial, and then the trigram was shown for 106 ms (8 video frames at 76 Hz). They were then asked to name aloud the three letters of each trigram, from left to right, guessing if unsure. The experimenter recorded the responses on a computer for subsequent data analysis. The gaze of the subjects was not monitored for the trigram task because the exposure duration was too short for subjects to move their eyes away from the fixation point during a trial. No trials for the trigram task were cancelled and all the trained subjects received the same amount of training.
We measured letter recognition accuracy using strings of three letters instead of isolated letters because of their closer approximation to English text. The middle trigram letters are representative of interior letters of words in general, and the inner and outer trigram letters are representative of the first and last letters of words. Legge, Mansfield and Chung (2001) found that letter recognition accuracy differed for the inner, middle and outer letters of a trigram. To take into account all the three within-trigram letter positions, recognition accuracy at each letter position was calculated by accumulating across trials in which letters in that position occurred as the inner, middle and outer letter of the trigrams. Eleven letter positions (−5 to +5) were used in this study. Although presenting trigrams from letter positions −5 to +5 also provided us data for letter positions −6 and +6 from the outer letter of a trigram, data from letter positions −6 and +6 were not included in the data analysis because data from the inner and middle letters of a trigram were not available for these two outermost letter positions. Similarly, data from the inner letter of a trigram were not available for letter positions −5 and +5. Therefore, our current data analyses were based on letter positions −4 to +4, for which data from outer, middle and inner letters within a trigram were all available.
The visual-span profiles were fitted with an asymmetric Gaussian function (Legge, Mansfield & Chung, 2001):
where p(x) is the proportion correct for letter recognition at letter position x, A is the peak amplitude of the Gaussian, and σL and σR are two parameters governing the left and right spread of the function respectively.
Proportion correct letter recognition, derived from the fitted curve, was converted to bits of information transmitted using the formula derived from the confusion matrices collected in Beckmann and Legge’s (2002) study. According to Shannon (1948), 100% accuracy in recognizing one of 26 equally likely alternatives would correspond to a transmission of log2(26) or 4.7 bits of information. Information transmitted at letter positions −4 to +4 were summed up to characterize the size of the visual span.
Each pre- and post-test visual-span profile at 10° above and below fixation was compiled from 385 trigram trials (35 trigram trials at each letter position). Our training subjects were trained for four consecutive days with 880 trigram trials per day (3520 trials across 4 training days). Each daily session lasted about 1 hour and 45 minutes.
RSVP reading speed measurements
We measured reading speed by presenting sentences using the rapid-serial-visual-presentation (RSVP) method. Words within a sentence were presented sequentially one word at a time, left justified at the same location on the display. All letters, including the first character of each sentence and proper nouns were rendered in lowercase. We used a set of 2658 sentences assembled by Chung, Mansfield and Legge (1998). A different sentence was randomly picked from the sentence pool for each trial. In other words, none of the observers saw the same sentence twice.
At the beginning of the trial, a row of x’s was displayed at the testing location, acting as both a location cue and a pre-mask. Subjects pressed a button to initiate the presentation. After the last word of the sentence was presented, a row of x’s was displayed again as a post-mask. We asked the subjects to fixate on a line 10° above (for lower visual field testing) or below (for upper visual field testing) the words while the sentence was being presented in the periphery. Horizontal eye movements along the fixation line were allowed.
Subjects read the sentence aloud and the experimenter recorded the number of words correctly spoken. A second experimenter monitored the gaze of the subjects for vertical eye movements. A trial was discarded and repeated (with a different sentence) when vertical eye movements were detected (estimated accuracy of 1.5°). Across all subjects, about 5% of all trials were discarded due to vertical eye movements. Reading accuracy was calculated as the proportion of words correctly read.
We used the method of constant stimuli to estimate the 80% threshold exposure time for RSVP reading. For each estimate, reading accuracy was measured for six exposure times (seconds per word). Data were collected in blocks of 18 trials (one sentence per trial). Three sentences per exposure time in random order were tested in each block. Each threshold estimate was based on two blocks of trials. Reading accuracy was plotted against exposure time and fitted with a Weibull function. The 80% threshold exposure time was estimated from the fitted function and converted to reading speed in words per minute (wpm).
Reading speeds were measured at 10° eccentricity in the upper and lower visual field with the print size that was used in the visual-span training (3.5°) and a smaller print size (2.5°) during the pre- and post-tests. The conditions with the smaller print size were included to test for possible transfer of training effects to a different print size because Chung, Legge and Cheung (2004) found generalized training effects across a range of print sizes despite the single print size used in training. Both print sizes are larger than the critical print size at 10° eccentricity in young adults (Chung, Legge & Cheung, 2004; Chung, Mansfield & Legge, 1998).
Apparatus
We programmed and generated the stimuli in MATLAB 5.2.1 (MathWorks, Massachusetts, USA) using the Psychtoolbox extensions (Brainard, 1997; Pelli, 1997) on a Power Mac G4 computer (Apple, California, USA). Stimuli were presented on a Sony GDM-FW900 monitor (Sony Corporation of America, New York, USA). Viewing distance was kept at 40 cm by using a chinrest. A near spectacle add of +2.50D was given to all subjects to correct for this viewing distance. Courier, a fixed-width font, was used for both the trigram and the reading tasks. Both trigrams and words were rendered as black text on a white background with Michelson contrast of 100%. Background luminance was 87.7 cd/m2. All computer-based tests, including training, were done with binocular viewing in a dark room.
Data Analysis
The pre- and post-test visual-span data from the 18 subjects were grouped with a nested structure–test type (pre- vs. post-test) within retinal location (lower vs. upper visual field) within a subject. A nonlinear mixed-effects (NLME) model using the asymmetric Gaussian function was fitted to the grouped data set to estimate the group means and variances (Cheung, Kallie, Legge & Cheong, 2007; Lindstrom & Bates, 1990; Pinheiro & Bates, 1995, 2000). Then, the visual-span function parameters for each subject were estimated with the “best linear unbiased predictor” (BLUP) (Henderson, 1975; Robinson, 1991). The 3520 trigram training trials for the training subjects were divided into 16 blocks of 220 trials. The training data were grouped and analyzed similarly with a NLME model. The pre- and post-test RSVP reading data (reading accuracy as a function of exposure time) were grouped and analyzed similarly with a NLME model using the Weibull function.
Many of our analyses involved comparison between our training and control groups or between our training and Chung, Legge and Cheung’s (2004) training groups. Due to possible violations of normality and other assumptions in conventional statistical tests, we used a combination of Friedman test (Friedman, 1937), the Wilcoxon two-sample rank sum test (Wilcoxon, 1945) and bootstrapping (Efron, 1979, 1981) for statistical analyses. For each Freidman test, we reported Friedman’s χ2, with the associated p-value. For each Wilcoxon test, we reported W, the Wilcoxon two-sample rank sum statistic (the sum of the ranks for the control group with the minimum possible sum of ranks subtracted), with the associated two-tailed p-value. In some cases, we used bootstrapping with 10000 resampling to estimate the standard error and 95% confidence intervals using the biased-corrected and accelerated percentile method (BCa) (Efron, 1987). All data analyses were implemented in R (http://www.r-project.org/) (Ihaka & Gentleman, 1996) with the NLME library (Pinheiro & Bates, 2000).
Results
Training effects on visual-span profiles
Figures 2 and 3 show the pre- and post-test visual-span profiles for the training and control subjects respectively. Post-test data were missing for the upper visual field of T6. T6’s data were kept in the analysis except when we analyzed the training effects on the visual span in the upper visual field.
Figure 2.

Pre- and post-test visual-span profiles of the training group (T1 to T9). Top panels are profiles for the untrained upper visual field. Bottom panels are profiles for the trained lower visual field. Pre-test data are plotted in open circles and dashed lines. Post-test data are plotted in filled circles and solid lines. Post-test data are missing for the upper visual field of T6.
Figure 3.

Pre- and post-test visual-span profiles of the control group (C1 to C9). The top panels are profiles for the upper visual field. The bottom panels are profiles for the lower visual field. Pre-test data are plotted in open circles and dashed lines. Post-test data are plotted in filled circles and solid lines.
The post-test visual-span profiles overlap with the pre-test profiles in the control group, indicating relatively small changes between pre- and post-tests. In contrast, the post-test visual-span profiles of the training subjects shifted upward, compared with the pre-test visual-span profiles, indicating enlargement of the visual span due to training. These upward shifts were found not only in the trained lower visual field (LVF), but also in the untrained upper visual field (UVF), the “transferred” field.
The left panel of Figure 4 is a scatter plot of post-test visual-span size against pre-test visual-span size. Data from the training group (filled symbols) are further above the equality line than the data from the control group (open symbols). The right panel of Figure 4 plots the average increases from pre- to post-test along with the 95% BCa confidence intervals for the different groups and different conditions.
Figure 4.
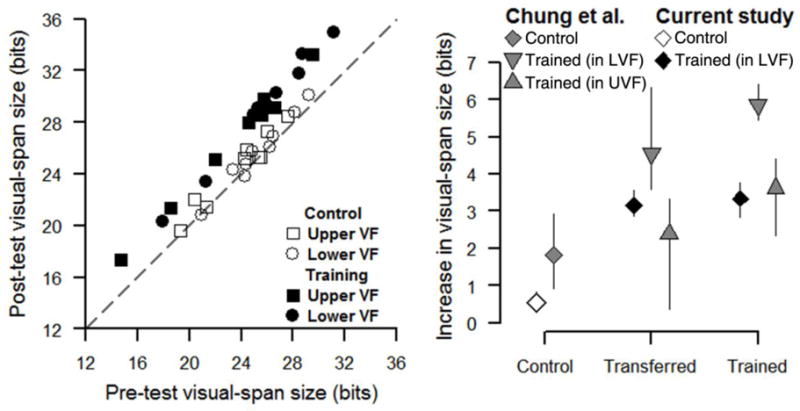
Effects of training on visual-span size. Left panel is a scatter plot of post-test visual-span size plotted against pre-test visual-span size for individual subjects. Data from the current study are plotted as squares for the upper visual field and as circles for the lower visual field. Data are plotted as open symbols for the control group and as filled symbols for the training group. The gray dashed line is the equality line. The right panel plots the average increase in visual-span size for the control group (averaging data in the upper and lower visual fields), and transferred and trained retinal locations for the training group. Data from Chung, Legge and Cheung’s (2004) study of young adults were re-analyzed and are also plotted for comparison. Data from the control and training groups in the current study are plotted as open and filled diamonds respectively. Chung et al.’s data are plotted in gray as diamonds for the control group, upright triangles for the training group who received training in the upper visual field (UVF) and upside-down triangles for the training group who received training in the lower visual field (LVF). Data for the control groups were averaged across visual fields because there was little difference between the two visual fields in terms of increase in visual-span size. Error bars indicate the 95% bootstrap BCa confidence intervals.
Visual-span size increased from pre- to post-test for the control group (lower visual field: 0.38 ± 0.50 bits (mean ± SD), p = 0.055; upper visual field: 0.70 ± 0.69 bits, p = 0.027). Visual-span size increased significantly more at both the trained (LVF: 3.34 ± 0.76 bits) and transferred (UVF: 3.15 ± 0.54 bits) retinal locations in our training group, compared with our control group (Ws = 0, ps < 0.001).
The two main procedural differences between the visual-span measurements for older adults in our study and corresponding measurements for young adults by Chung, Legge and Cheung (2004) were: (1) we used a fixed print size of 3.5°, while Chung et al. used 1.4× the critical print size of each subject; and (2) we collected data on 11 letter positions (−5 to +5), while Chung et al. collected data on 13 letter positions (−6 to +6). Despite these differences, it is reasonable to compare the results between the two studies. We compared the pre-test visual-span sizes of our older subjects to Chung et al.’s (2004) young adults.2 In the upper visual field, Chung et al.’s young adults had significantly larger visual spans (mean ± sebootstrap = 26.15 ± 0.84 bits), than our older subjects (23.59 ± 0.83 bits) (W = 242, p = 0.01). However, we found no significant difference in the visual-span size between Chung et al.’s young adults (27.16 ± 0.63 bits) and our older subjects (25.49 ± 0.75 bits) in the lower visual field (W = 214, p = 0.10).
Average data from Chung, Legge and Cheung’s (2004) study of young adults have also been plotted in the right panel of Figure 4 for comparison. Chung et al. had one control group and two training groups. One of their training groups was trained in the lower visual field, and the other group was trained in the upper visual field. Our training subjects, who were trained in the lower visual field, improved less at the trained retinal location (mean difference in visual-span size ± sebootstrap = 3.34 ± 0.24 bits) than Chung et al.’s LVF training group (5.88 ± 0.23 bits).
We found a significant positive correlation between the pre-test visual-span size and the increase in visual-span size for the trained retinal location (r = 0.743, p = 0.023, two-tailed), but not for the transferred retinal location (r = 0.567, p = 0.142, two-tailed) in our training group. This finding may indicate that the potential for training benefits is greater for subjects with better performance prior to training.
Block-by-block changes in visual-span size across training
Figure 5 shows block-by-block changes in visual-span size across training for each trained subject. Data from each of the four training days were divided into four training blocks, with 220 trigram trials in each block. Pre-test visual-span size was subtracted from the visual-span sizes of the training blocks. Our training subjects showed improvements in the visual-span size within sessions and lapses in the training effects from the last block of one training day to the first block of the next training day.
Figure 5.

Block-by-block changes in visual-span size (bits of information transmitted) during four days of training. Each panel shows data for one trained subject. Each open circle represents the increase in the visual-span size compared with pre-test values, based on a block of 220 trigram trials. Post-test changes in visual-span size, compared with the pre-test values, are plotted as open squares. The dark vertical grid lines indicate the transitions between training days.
Average block-by-block changes in the visual-span size in the current study and Chung, Legge and Cheung’s (2004) study are plotted in the left panel of Figure 6. Chung et al. had four training days with five blocks of training trials in each day, while in the present study we had four blocks in each of the four training days. The right panel of Figure 6 shows the average block-by-block changes in visual-span size within a training day. Our older subjects showed very similar within-day improvements to the younger subjects studied by Chung et al. Overall, within-day training benefits for our training group were not significantly different from those for Chung et al.’s LVF training group (Friedman χ2 = 0, p = 1).3
Figure 6.

Average block-by-block changes in visual-span size vs. block # across the four training days (left panel) and block # within a training day (right panel). In the left panel, the first block in each day is labeled as D#B1 (Day # Block 1). Boundaries between consecutive days are indicated by the vertical dashed lines. In both panels, data from the current study are plotted as open circles. Data from Chung, Legge and Cheung’s (2004) study are plotted as open upright triangles (UVF training group) and open upside-down triangles (LVF training group). The horizontal locations of the symbols for three sets of data have been shifted slightly relative to each other to increase visibility. Error bars indicate ± 1 standard error estimated with 10000 bootstrap replicates.
We calculated the between-day lapse in training benefits by subtracting the visual-span size for the first training block of each training day (except the first day) from the last training block of the previous day. A positive lapse shows a decrement in training benefit and a negative lapse shows improvement overnight. Our training group had significantly larger lapses than Chung, Legge and Cheung’s (2004) LVF training group after day 2 (medians = 1.015 (older) vs. −0.133 (young) bits, W = 0, p < 0.001) and day 3 (medians = 0.579 vs. 0.120 bits, W = 10, p = 0.050).
If aging decreases the ability to retain training benefits from day to day, we would expect to find correlation between the lapse size and age. Despite our relatively small sample size, we did find significant correlation (r = 0.67, p = 0.048, two-tailed) between the between-day lapse (averaged across the training days for each subject) and age.
The day-to-day increases (difference between the first block of a training day and that of the following training day) after day 1, day 2 and day 3 of training were 1.10 ± 0.05 (mean ± sebootstrap), 0.07 ± 0.05, and 0.45 ± 0.05 bits respectively for our training group, and were 1.03 ± 0.38, 1.72 ± 0.24, and 0.85 ± 0.18 bits respectively for Chung, Legge and Cheung’s LVF training group. Our older subjects had a significantly smaller day-to-day increase than Chung et al.’s younger subjects between day 2 and day 3 (W = 54, p < 0.001).
Transfer of training effects to RSVP reading
RSVP reading speeds were measured in four different conditions as combinations of two visual-field locations (upper vs. lower) and two print sizes (2.5° vs. 3.5°). Figure 7 plots the post-test reading speed against the pre-test reading speed. The filled (black or gray) symbols represent data for the training subjects and the open symbols represent data for the control subjects. In Figure 7, the black squares are further above the equality line than the open squares, representing a greater improvement in post-test reading speed for the trained subjects compared with the control subjects under the trained condition (i.e., lower visual field with print size of 3.5°). Table 2 summarizes the transfer of training effects to RSVP reading. RSVP reading speed increased significantly more in the training group (60% increase) than in the control group (16% increase) only in the combination that was used in the trigram training.
Figure 7.

Scatter plot of post-test reading speed against pre-test reading speed for individual subjects. Data are plotted as diamonds (2.5°) and triangles (3.5°) for the upper visual field (transferred), and as circles (2.5°) and squares (3.5°) for the lower visual field (trained). Data are plotted in open symbols for the control group and in filled symbols (black for the trained field and gray for the transferred field) for the training group. The gray dashed line is the equality line.
Table 2.
Summary table of post/pre ratios of RSVP reading speed. UVF–upper visual field; LVF–lower visual field. W is the Wilcoxon two-sample rank sum statistic (Wilcoxon, 1945). p is the two-sided p-value associated with W.
| Control | Training | ||||||
|---|---|---|---|---|---|---|---|
| Mean (SD) | Median | Mean (SD) | Median | W | p | ||
| UVF | 2.5° | 1.31 (0.40) | 1.13 | 1.49 (1.26) | 1.16 | 41 | 1 |
| 3.5° | 1.26 (0.47) | 1.08 | 1.45 (0.46) | 1.31 | 26 | 0.222 | |
| LVF | 2.5° | 1.19 (0.28) | 1.11 | 1.34 (0.50) | 1.40 | 29 | 0.340 |
| 3.5° | 1.16 (0.21) | 1.07 | 1.60 (0.71) | 1.39 | 16 | 0.031 | |
Discussion
We have shown that training in peripheral vision with the trigram letter recognition task results in an increase in the size of the visual span for older adults, similar to previous findings for young adults (Chung, Legge & Cheung, 2004). The training effects were weaker for the older adults as shown by the average increase in visual-span size at the trained (3.34 bits) or transferred (3.15 bits) retinal location, compared with the corresponding training effects for young adults in Chung et al.’s study (5.86 bits and 4.55 bits respectively).
An important goal of the study was to determine if the training effects would transfer to an improvement in peripheral reading speed. Chung et al. (2004) showed that for young adults, the trigram training transferred to improved peripheral reading speed, extending across a range of print sizes and from the upper to the lower visual field and vice versa. But unlike these findings with young adults, training of our older adults resulted in faster reading only for the trained print size and at the trained retinal location.
We consider three possible explanations for the weaker training effects among older adults. First, we found that smaller visual spans in the pre-test were associated with less improvement due to training for the older adults. We did observe slightly lower pre-test visual spans (approximately 2 bits smaller) in our older subjects compared with the younger subjects in Chung et al.’s (2004) study in both the upper and lower visual fields, although the difference reached statistical significance only in the upper visual field. This lower baseline performance in our older subjects might be a factor contributing to weaker training effects.
Second, age-related deficits in deploying visual attention to peripheral targets might result in smaller pre-test visual spans. Age-related deficits in deploying visual attention have been shown in a target localization task, in which a peripheral target is presented among distracters (Sekuler & Ball, 1986; Sekuler, Bennett & Mamelak, 2000; Ball, Beard, Roenker, Miller & Griggs, 1988). The detrimental effects of a simultaneous central task on the performance in a peripheral task increased with age in a divided-attention paradigm (Sekuler et al., 2000; Ball et al., 1988; Ball, Roenker & Bruni, 1990).
A third explanation for the weaker training effects for our older adults might be found in the pattern of training effects across days (one training session per day). Our findings showed that young and older adults had very similar within-day improvements but the older adults were less effective in retaining the gains between days (Figure 6). Apparently, the limitation in perceptual learning in older adults is due to ineffective consolidation of learning between days. Our correlational analyses also showed that the ability to retain training benefits between days decreased as a function of increasing age. Fahle and Daum (1997) found no age effects on perceptual learning when the training was completed within a day. The between-day lapses may explain why we found different results from Fahle and Daum and weaker perceptual learning benefits in older people.
It is possible that extra within-day training for our older adults might have stabilized training gains. Chung, Legge and Cheung (2004) had an extra block of trials in each training day for their younger subjects, and this extra training block might have prevented the between-day lapses. In our study, we used one fewer training blocks per day to guard against fatiguing our older subjects. As shown in Figure 6, the within-day training progression seems to have reached the plateau between the third block and the fourth block of training for our older subjects. However, Richards, Bennett and Sekuler (2006) found that an initial age-deficit in the performance on a divided-attention task was eliminated by additional practice for the older subjects. Although within-day training had reached the plateau for our older subjects, it remains possible that additional training might have helped the consolidation of training benefits and prevented the between-day lapse.
Some factor besides the amount of daily practice might account for between-day lapses in training gains for our older subjects. Consolidation of perceptual learning is known to occur during sleep (Karni, Tanne, Rubenstein, Askenasy & Sagi, 1994; Stickgold, James & Hobson, 2000). It is possible that disturbed sleep in normal aging (Ohayon, Carskadon, Guilleminault & Vitiello, 2004) might account for poorer retention of perceptual learning between days. In brief, the weaker training effects for our older subjects might not be due to early sensory limitations, but perhaps due to consolidation of training benefits.
Reduced cortical plasticity, at the synaptic level, may be the underlying reason for the inability to retain training benefits between the daily sessions, which resulted in the overall weaker training benefits and limited transfer of learning, among our older subjects. Memory and learning are accompanied by changes in synapses among neurons. Formation, elimination and modification of synapses have been tied to the changes in dendritic spines (Matsuzaki, Honkura, Ellis-Davies & Kasai, 2004; Yang, Wang, Frerking & Zhou, 2008; Yuste & Bonhoeffer, 2001). Nevertheless, stability of dendritic spines increases with age, reducing the synaptic plasticity (Grutzendler, Kasthuri & Gan, 2002; Holtmaat et al., 2005; Trachtenberg et al., 2002). As the aging visual cortex becomes less plastic, perceptual learning becomes more difficult.
Although cortical plasticity may diminish in old age, there is evidence for cortical reorganization in patients with macular degeneration (Baker, Peli, Knouf & Kanwisher, 2005; Dilks, Baker, Peli & Kanwisher, 2009; Schumacher, Jacko, Primo, Main, Moloney, Kinzel & Ginn, 2008; Liu, Cheung, Schuchard, Glielmi, Hu, He & Legge, submitted). It has been shown that after central field loss, the former foveal cortex starts responding to stimuli presented at the preferred retinal locus (PRL) (Baker et al., 2005; Schumacher et al., 2008) or even at some non-PRL locations (Dilks et al., 2009), although the extent of reorganization may depend on attention and feedback processes (Liu et al., submitted).
Where in the visual pathway might we find the neural basis for the perceptual learning we have observed? Some studies on visual perceptual learning have suggested that changes in the primary visual cortex (V1) underlie behavioral changes (Karni & Sagi, 1991; Schoups, Vogels, Qian & Orban, 2001; Schwartz, Maquet & Frith, 2002), while others have suggested that the neural site of perceptual learning lies beyond V1 (Ghose, Yang & Maunsell, 2002; Yang & Maunsell, 2004).
Generalization of perceptual learning across field locations or stimuli depends on the site in the visual pathway altered by the training (Fahle & Poggio, 2002). Some perceptual-learning effects are found to be retinotopically specific (Karni & Sagi, 1991; Poggio, Fahle & Edelman, 1992; Ahissar & Hochstein, 1996). This specificity implies that the neural changes occur in early visual areas which are retinotopically organized. There is also evidence that learning can sometimes be transferred from one retinal location to another (Richards et al., 2006; Sireteanu & Rettenbach, 2000; Xiao et al., 2008) and from trained tasks and stimuli to untrained ones (Beard, Levi, & Reich, 1995; Sireteanu & Rettenbach, 2000; Green & Bavelier, 2003; Webb, Roach & McGraw, 2007). In these cases, it is likely that the site of perceptual learning is in a higher-level nonretinotopic visual area.
The neural site of perceptual learning probably depends on the task involved. Ahissar and Hochstein (1997) found that as task difficulty in perceptual learning increases, the training benefits become more specific to the trained retinal location, indicating neural correlates earlier in the visual pathway. For the present study, the trigram task might be a more difficult task for our older subjects compared with the younger subjects in Chung et al.’s (2004) study, which might account for the weaker transfer of training to reading.
The mechanism of perceptual learning may be different for different tasks, depending on the exact nature of the neural computation and/or visual pathway recruited for the task (Lu & Dosher, 2004). Recent studies on models of perceptual learning showed that the improvements in performance could be accounted for by template retuning (elimination of the external noise by tuning the weighting of the information; Lu & Dosher, 2004; Li, Levi & Klein, 2004) or a combination of stimulus enhancement and template retuning (Dosher & Lu, 1998, 1999). Without using the external noise paradigm (Dosher & Lu, 1998, 1999; Lu & Dosher, 2004), we cannot interpret our perceptual learning findings in this framework. However, we can speculate about the basis of the learning by considering the sensory components of visual span. The size of the visual span is probably affected by lower-level sensory factors, such as crowding, positional uncertainty, and changes in peripheral acuity (for a review, see Legge, 2007, Ch. 3). We briefly consider two factors that might account for the enlargement of visual span after training—reduction of spatial uncertainty about letter positions or reduction in crowding.
Chung and Legge (2009) showed that positional uncertainty about letters can account for errors in the perceptual ordering of letters. Such errors would manifest as a reduction in accuracy in the derivation of visual span profiles. Chung and Legge proposed a simple noise model explaining the positional uncertainty by assuming that the encoded position of each letter is Gaussian distributed, and that the spread of the distribution determines the precision of localizing the letter. It is possible that training resulted in a reduction of this Gaussian noise, and corresponding increase in letter-recognition accuracy and larger visual spans.
It has also been suggested that crowding is a major factor limiting the visual span for reading (Pelli et al., 2007). The learning effect found in the present paper may be accounted for by a reduction in crowding. Chung (2007) investigated whether peripheral reading speed can be improved by reducing crowding in peripheral vision through training on identifying crowded letters. Surprisingly, while the study did show that training reduced crowding (i.e., accuracy for recognizing crowded letters increased), there was no corresponding increase in peripheral reading speed. However, the author acknowledged that failing to find improvement in reading speed might have been due to details of the training task e.g., subjects identified only the middle letter of the trigrams presented at a single fixed position (10° directly below the fixation point).
Despite the weaker and more variable training effects demonstrated by our older subjects, they did demonstrate improved reading speed in peripheral vision following training. The significant gain (mean 60%) in reading speed occurred in the trained lower visual field at the trained print size of 3.5°. An improvement in reading speed of 60% or more would be of significance in rehabilitation for people with central-field loss. If the improvement were to be restricted to the trained print size, appropriate prescription of magnifiers would be necessary to enlarge print to the appropriate size.
Summary and conclusions
In this study, we found that the size of visual spans in the peripheral vision of older adults increase as a result of perceptual learning. The training task was letter recognition using trigram stimuli. We also found a transfer of training to improved reading speed in the trained field with the trained print size. Training benefits were smaller among our older subjects, compared to Chung, Legge and Cheung’s (2004) young adults. The primary difference was due to an inability of older subjects to retain training benefits between daily sessions. The weaker training benefits in older subjects might be due to age-related reduced cortical plasticity, which may make it more difficult to retain training benefits overnight. Despite the weaker training benefits, enlargement of the visual span resulting from perceptual learning remains a potential option for peripheral reading rehabilitation among older adults.
Acknowledgments
Preliminary results were presented at the Vision 2005: the 8th International Conference on Low Vision Activity and Participation (Yu, Cheung, Legge & Chung, 2005 April). The authors thank the dedicated subjects for their participation in the study. This research was supported by a University of Minnesota Doctoral Dissertation Fellowship to S.-H.C., a NIH Grant EY002934 to G.E.L. and a NIH Grant EY012810 to S.T.L.C.
Footnotes
Due to our relatively small sample size and the possible violation of the normality assumption required for a t test, we decided to use its nonparametric counterpart, the Wilcoxon rank sum test (Wilcoxon, 1945).
This comparison was based on the same number of letter positions (−4 to +4) for both our older subjects and Chung et al.’s young subjects.
Despite the extra block of training on each training day in Chung et al.’s study, the pattern of our results remained the same when we compared our last training block with Chung et a.’s 4th training block on each day (Friedman χ2 = 1, p = 0.317).
Publisher's Disclaimer: This is a PDF file of an unedited manuscript that has been accepted for publication. As a service to our customers we are providing this early version of the manuscript. The manuscript will undergo copyediting, typesetting, and review of the resulting proof before it is published in its final citable form. Please note that during the production process errors may be discovered which could affect the content, and all legal disclaimers that apply to the journal pertain.
References
- Ahissar M, Hochstein S. Learning pop-out detection: specificities to stimulus characteristics. Vision Res. 1996;36:3487–3500. doi: 10.1016/0042-6989(96)00036-3. [DOI] [PubMed] [Google Scholar]
- Ahissar M, Hochstein S. Task difficulty and the specificity of perceptual learning. Nature. 1997;487:401–406. doi: 10.1038/387401a0. [DOI] [PubMed] [Google Scholar]
- Ahn SJ, Legge GE, Luebker A. Printed cards for measuring low-vision reading speed. Vision Research. 1995;35:1939–1944. doi: 10.1016/0042-6989(94)00294-v. [DOI] [PubMed] [Google Scholar]
- Baker CI, Peli E, Knouf N, Kanwisher NG. Reorganization of visual processing in macular degeneration. The Journal of Neuroscience. 2005;25:614–618. doi: 10.1523/JNEUROSCI.3476-04.2005. [DOI] [PMC free article] [PubMed] [Google Scholar]
- Ball KK, Beard BL, Roenker DL, Miller RL, Griggs DS. Age and visual search: Expanding the useful field of view. Journal of the Optical Society of America A. 1988;5:2210–2219. doi: 10.1364/josaa.5.002210. [DOI] [PubMed] [Google Scholar]
- Ball K, Roenker DL, Bruni JR. Developmental changes in attention and visual search throughout adulthood. In: Enns JT, editor. The development of attention: Research and theory. Amsterdam: Elsevier; 1990. pp. 489–508. [Google Scholar]
- Beard BL, Levi DM, Reich LN. Perceptual learning in parafoveal vision. Vision Research. 1995;35:1679–1690. doi: 10.1016/0042-6989(94)00267-p. [DOI] [PubMed] [Google Scholar]
- Beckmann PJ, Legge GE. Preneural limitations on letter identification in central and peripheral vision. Journal of the Optical Society of America A: Optics, Image Sciences, and Vision. 2002;19:2349–2362. doi: 10.1364/josaa.19.002349. [DOI] [PubMed] [Google Scholar]
- Brainard DH. The Psychophysics Toolbox. Spatial Vision. 1997;10:433–436. [PubMed] [Google Scholar]
- Cheong AMY, Lovie-Kitchin JE, Bowers AR, Brown B. Short-term in-office practice improves reading performance with stand magnifiers for people with AMD. Optometry and Vision Science. 2005;82:114–127. doi: 10.1097/01.opx.0000153244.93582.ff. [DOI] [PubMed] [Google Scholar]
- Cheung SH, Kallie CS, Legge GE, Cheong AMY. Nonlinear mixed-effects modeling of MNREAD data. Investigative Ophthalmology and Visual Science. 2008;49:828–835. doi: 10.1167/iovs.07-0555. [DOI] [PubMed] [Google Scholar]
- Cheung SH, Legge GE. Functional and cortical adaptations to central vision loss. Visual Neuroscience. 2005;22:187–201. doi: 10.1017/S0952523805222071. [DOI] [PMC free article] [PubMed] [Google Scholar]
- Chung STL. Learning to identify crowded letters: Does it improve reading speed? Vision Research. 2007;47:3150–3159. doi: 10.1016/j.visres.2007.08.017. [DOI] [PMC free article] [PubMed] [Google Scholar]
- Chung STL, Legge GE. Precision of position signals for letters. Vision Research. 2009;49:1948–1960. doi: 10.1016/j.visres.2009.05.004. [DOI] [PMC free article] [PubMed] [Google Scholar]
- Chung STL, Legge GE, Cheung SH. Letter-recognition and reading speed in peripheral vision benefit from perceptual learning. Vision Research. 2004;44:695–709. doi: 10.1016/j.visres.2003.09.028. [DOI] [PMC free article] [PubMed] [Google Scholar]
- Chung STL, Mansfield JS, Legge GE. Psychophysics of reading: XVIII. The effect of print size on reading in normal peripheral vision. Vision Research. 1998;38:2949–2962. doi: 10.1016/s0042-6989(98)00072-8. [DOI] [PubMed] [Google Scholar]
- Dilks DD, Baker CI, Peli E, Kanwisher N. Reorganization of visual processing in macular degeneration is not specific to the “Preferred Retinal Locus”. The Journal of Neuroscience. 2009;29:2768–2773. doi: 10.1523/JNEUROSCI.5258-08.2009. [DOI] [PMC free article] [PubMed] [Google Scholar]
- Dosher BA, Lu ZL. Perceptual learning reflects external noise filtering and internal noise reduction through channel reweighting. Proceedings of the National Academy of Science. 1998;95:13988–13993. doi: 10.1073/pnas.95.23.13988. [DOI] [PMC free article] [PubMed] [Google Scholar]
- Dosher BA, Lu ZL. Mechanisms of perceptual learning. Vision Research. 1999;39:3197–3221. doi: 10.1016/s0042-6989(99)00059-0. [DOI] [PubMed] [Google Scholar]
- Efron B. Bootstrap methods: another look at the jackknife. Annals of Statistics. 1979;7:1–26. [Google Scholar]
- Efron B. Nonparametric estimates of standard error: the jackknife, the bootstrap and other methods. Biometrika. 1981;68:589–599. [Google Scholar]
- Efron B. Better bootstrap confidence intervals. Journal of the American Statistical Association. 1987;82:171–185. [Google Scholar]
- Eye Disease Prevalence Research Group. Prevalence of age-related macular degeneration in the United States. Archives of Ophthalmology. 2004;122:564–572. doi: 10.1001/archopht.122.4.564. [DOI] [PubMed] [Google Scholar]
- Fahle M, Daum I. Visual learning and memory as functions of age. Neuropsychologia. 1997;35:1583–1589. doi: 10.1016/s0028-3932(97)00069-9. [DOI] [PubMed] [Google Scholar]
- Fahle M, Poggio T. Perceptual learning. Cambridge, MA: MIT Press; 2002. [Google Scholar]
- Faye EE. Clinical low vision. 2. Boston: Little Brown & Co; 1984. [Google Scholar]
- Fenn KM, Nusbaum HC, Margoliash D. Consolidation during sleep of perceptual learning of spoken language. Nature. 2003;425:614–616. doi: 10.1038/nature01951. [DOI] [PubMed] [Google Scholar]
- Fine EM, Peli E. Scrolled and rapid serial visual presentation texts are read at similar rates by the visually impaired. Journal of the Optical Society of America A: Optics, Image Sciences, and Vision. 1995;12:2286–2292. doi: 10.1364/josaa.12.002286. [DOI] [PubMed] [Google Scholar]
- Fletcher DC, Schuchard RA, Watson G. Relative locations of macular scotomas near the PRL: Effect on low vision reading. Journal of Rehabilitation Research and Development. 1999;36:356–364. [PubMed] [Google Scholar]
- Friedman M. The use of ranks to avoid the assumption of normality implicit in the analysis of variance. Journal of the American Statistical Association. 1937;32:675–701. [Google Scholar]
- Ghose GM, Yang T, Maunsell JHR. Physiological correlates of perceptual learning in monkey V1 and V2. Journal of Neurophysiology. 2002;87:1867–1888. doi: 10.1152/jn.00690.2001. [DOI] [PubMed] [Google Scholar]
- Gibson EJ. Perceptual learning. Annual Review of Psychology. 1963;14:29–56. doi: 10.1146/annurev.ps.14.020163.000333. [DOI] [PubMed] [Google Scholar]
- Goldstone RL. Perceptual learning. Annual Review of Psychology. 1998;49:585–612. doi: 10.1146/annurev.psych.49.1.585. [DOI] [PubMed] [Google Scholar]
- Goodrich GL, Kirby J, Oros T, Wagstaff P, McDevitt B, Hazan J, Peters LJ. Goldilocks and the three training models: A comparison of three models of low vision reading training on reading efficiency. Visual Impairment Research. 2004;6:135–152. [Google Scholar]
- Goodrich GL, Mehr EB. Eccentric viewing training and low vision aids: Current practice and implications of peripheral retinal research. American Journal of Optometry and Physiological Optics. 1986;63:119–126. [PubMed] [Google Scholar]
- Green CS, Bavelier D. Action video game modifies visual selective attention. Nature. 2003;423:534–537. doi: 10.1038/nature01647. [DOI] [PubMed] [Google Scholar]
- Grutzendler J, Kasthuri N, Gan WB. Long-term dendritic spine stability in the adult cortex. Nature. 2002;420:812–816. doi: 10.1038/nature01276. [DOI] [PubMed] [Google Scholar]
- Henderson CR. Best linear unbiased estimation and prediction under a selection model. Biometrics. 1975;31:423–447. [PubMed] [Google Scholar]
- Holcomb JG, Goodrich GL. Eccentric viewing training. Journal of the American Optometric Association. 1976;47:1438–1443. [PubMed] [Google Scholar]
- Holtmaat AJGD, Trachtenberg JT, Wilbrecht L, Shepherd GM, Zhang X, Knott GW, Svoboda K. Transient and persistent dendritic spines in the neocortex in vivo. Neuron. 2005;45:279–291. doi: 10.1016/j.neuron.2005.01.003. [DOI] [PubMed] [Google Scholar]
- Ihaka R, Gentleman R. R: a language for data analysis and graphics. Journal of Computational and Graphical Statistics. 1996;5:299–314. [Google Scholar]
- Karni A, Sagi D. Where practice makes perfect in texture discrimination: Evidence for primary visual cortex plasticity. Proceedings of the National Academy of Sciences of the United States of America. 1991;88:4966–4970. doi: 10.1073/pnas.88.11.4966. [DOI] [PMC free article] [PubMed] [Google Scholar]
- Karni A, Tanne D, Rubenstein BS, Askenasy JJM, Sagi D. Dependence on REM sleep of overnight improvement of a perceptual skill. Science. 1994;265:679–682. doi: 10.1126/science.8036518. [DOI] [PubMed] [Google Scholar]
- Legge GE. Psychophysics of reading in normal and low vision. Mahweh, NJ: Erlbaum; 2007. [Google Scholar]
- Legge GE, Ahn SJ, Klitz TS, Luebker A. Psychophysics of reading: XVI. The visual span in normal and low vision. Vision Research. 1997;37:1999–2010. doi: 10.1016/s0042-6989(97)00017-5. [DOI] [PubMed] [Google Scholar]
- Legge GE, Cheung S-H, Chung STL, Lee HW, Gefroh J, Kwon M. Training peripheral vision to read. In: Riser JJ, Ashmead DH, Ebner FF, Corn Anne L, editors. Blindness and Brain Plasticity in Navigation and Object Perception. New York: Lawrence Erlbaum Associates; 2008. pp. 208–226. [Google Scholar]
- Legge GE, Cheung S-H, Yu D, Chung STL, Lee H-W, Owens DP. The case for the visual span as a sensory bottleneck in reading. Journal of Vision. 2007;7(2):9, 1–15. doi: 10.1167/7.2.9. http://journalofvision.org/7/2/9/ [DOI] [PMC free article] [PubMed]
- Legge GE, Mansfield JS, Chung STL. Psychophysics of reading: XX. Linking letter recognition to reading speed in central and peripheral vision. Vision Research. 2001;41:725–734. doi: 10.1016/s0042-6989(00)00295-9. [DOI] [PubMed] [Google Scholar]
- Legge GE, Ross JA, Isenberg LM, LaMay JM. Psychophysics of reading. XII. Clinical predictors of low-vision reading speed. Investigative Ophthalmology and Visual Science. 1992;33:677–687. [PubMed] [Google Scholar]
- Legge GE, Rubin GS, Pelli DG, Schleske MM. Psychophysics of reading. II. Low vision. Vision Research. 1985;25:253–265. doi: 10.1016/0042-6989(85)90118-x. [DOI] [PubMed] [Google Scholar]
- Li RW, Levi DM, Klein SA. Perceptual learning improves efficiency by retuning the decision template’ for position discrimination. Nat Neurosci. 2004;7:178–183. doi: 10.1038/nn1183. [DOI] [PubMed] [Google Scholar]
- Lindstrom MJ, Bates DM. Nonlinear mixed-effects models for repeated measures data. Biometrics. 1990;46:673–687. [PubMed] [Google Scholar]
- Liu T, Cheung S-H, Schuchard RA, Glielmi CB, Hu X, He S, Legge GE. Incomplete cortical reorganization in macular degeneration. IVOS. doi: 10.1167/iovs.09-4926. (submitted) [DOI] [PMC free article] [PubMed] [Google Scholar]
- Lu Z-L, Dosher BA. Perceptual learning retunes the perceptual template in foveal orientation identification. Journal of Vision. 2004;4(1):5, 44–56. doi: 10.1167/4.1.5. http://journalofvision.org/4/1/5/ [DOI] [PubMed]
- Mansfield JS, Ahn SJ, Legge GE, Luebker A. A new reading acuity chart for normal and low vision: Ophthalmic and Visual Optics/Noninvasive Assessment of the Visual System. Optical Society of America Technical Digest. 1993;3:232–235. [Google Scholar]
- Mansfield JS, Legge GE. The MNREAD acuity chart. In: Legge GE, editor. Psychophysics of Reading in Normal and Low Vision. Mahwah, NJ: Lawrence Erlbaum Associates; 2007. pp. 167–191. [Google Scholar]
- Matsuzaki M, Honkura N, Ellis-Davies GCR, Kasai H. Structural basis of long-term potentiation in single dendritic spines. Nature. 2004;429:7612–766. doi: 10.1038/nature02617. [DOI] [PMC free article] [PubMed] [Google Scholar]
- Neary K, Anand S, Hotson JR. Perceptual learning of line orientation modifies the effects of transcranial magnetic stimulation of visual cortex. Experimental Brain Research. 2005;162:23–34. doi: 10.1007/s00221-004-2117-5. [DOI] [PubMed] [Google Scholar]
- Nilsson UL, Frennesson C, Nilsson SEG. Location and stability of a newly established eccentric retinal locus suitable for reading, achieved through training of patients with a dense central scotoma. Optometry and Vision Science. 1998;75:873–878. doi: 10.1097/00006324-199812000-00009. [DOI] [PubMed] [Google Scholar]
- Nilsson UL, Frennesson C, Nilsson SEG. Patients with AMD and a large absolute central scotoma can be trained successfully to use eccentric viewing, as demonstrated in a scanning laser ophthalmoscope. Vision Research. 2003;43:1777–1787. doi: 10.1016/s0042-6989(03)00219-0. [DOI] [PubMed] [Google Scholar]
- Nilsson UL, Nilsson SEG. Rehabilitation of the visually handicapped with advanced macular degeneration. A follow-up study at the low vision clinic, Department of Ophthalmology, University of Linköping. Documenta Ophthalmologica. 1986;62:345–367. doi: 10.1007/BF00168266. [DOI] [PubMed] [Google Scholar]
- O’Regan JK. Eye movements and reading. In: Kowler E, editor. Eye movements and their role in visual and cognitive processes. New York: Elsevier; 1990. pp. 395–454. [Google Scholar]
- Ohayon MM, Carskadon MA, Guilleminault C, Vitiello MV. Meta-analysis of quantitative sleep parameters from childhood to old age in healthy individuals: Developing normative sleep values across the human lifespan. Sleep. 2004;27:1255–1273. doi: 10.1093/sleep/27.7.1255. [DOI] [PubMed] [Google Scholar]
- Pelli DG. The VideoToolbox software for visual psychophysics: transforming numbers into movies. Spatial Vision. 1997;10:437–442. [PubMed] [Google Scholar]
- Pelli DG, Farell B, Moore DC. The remarkable inefficiency of word recognition. Nature. 2003;423:752–756. doi: 10.1038/nature01516. [DOI] [PubMed] [Google Scholar]
- Pelli DG, Robson JG, Wilkins AJ. The design of a new letter chart for measuring contrast sensitivity. Clinical Vision Sciences. 1988;2:187–199. [Google Scholar]
- Pelli DG, Tillman KA. Parts, wholes, and context in reading: a triple dissociation. PLoS ONE. 2007;2(8):e680. doi: 10.1371/journal.pone.0000680. http://www.plosone.org/doi/pone.0000680. [DOI] [PMC free article] [PubMed]
- Pelli DG, Tillman KA, Freeman J, Su M, Berger TD, Majaj NJ. Crowding and eccentricity determine reading rate. Journal of Vision. 2007;7(2):20, 1–36. doi: 10.1167/7.2.20. http://journalofvision.org/7/2/20/ [DOI] [PubMed]
- Pinheiro JC, Bates DM. Technical Report 91. Department of Biostatistics, University of Wisconsin; Madison: 1995. Model building for nonlinear mixed-effects models. [Google Scholar]
- Pinheiro JC, Bates DM. Mixed-effects models in S and S-plus. New York: Springer; 2000. [Google Scholar]
- Poggio T, Fahle M, Edelman S. Fast perceptual learning in visual hyperacuity. Science. 1992;256:1018–1021. doi: 10.1126/science.1589770. [DOI] [PubMed] [Google Scholar]
- Richards E, Bennett PJ, Sekuler AB. Age related differences in learning with the useful field of view. Vision Research. 2006;46:4217–4231. doi: 10.1016/j.visres.2006.08.011. [DOI] [PubMed] [Google Scholar]
- Robinson GK. That BLUP is a good thing: the estimation of random effects. Statistical Science. 1991;6:15–32. [Google Scholar]
- Schoups A, Vogels R, Qian N, Orban G. Practising orientation identification improves orientation coding in V1 neurons. Nature. 2001;412:549–553. doi: 10.1038/35087601. [DOI] [PubMed] [Google Scholar]
- Schuchard RA, Naseer S, de Castro K. Characteristics of AMD patients with low vision receiving visual rehabilitation. Journal of Rehabilitation Research and Development. 1999;36:294–302. [PubMed] [Google Scholar]
- Schumacher EH, Jacko JA, Primo SA, Main KL, Moloney KP, Kinzel EN, Ginn J. Reorganization of visual processing is related to eccentric viewing in patients with macular degeneration. Restorative Neurology and Neuroscience. 2008;26:391–402. [PubMed] [Google Scholar]
- Schwartz S, Maquet P, Frith C. Neural correlates of perceptual learning: A functional MRI study of visual texture discrimination. Proceedings of the National Academy of Sciences of the United States of America. 2002;99:17137–17142. doi: 10.1073/pnas.242414599. [DOI] [PMC free article] [PubMed] [Google Scholar]
- Sekuler R, Ball K. Visual localization: age and practice. Journal of the Optical Society of America A: Optics, Image Sciences, and Vision. 1986;3:864–867. doi: 10.1364/josaa.3.000864. [DOI] [PubMed] [Google Scholar]
- Sekuler AB, Bennett PJ, Mamelak M. Effects of aging on the useful field of view. Experimental Aging Research. 2000;26:103–120. doi: 10.1080/036107300243588. [DOI] [PubMed] [Google Scholar]
- Shannon CE. A mathematical theory of communication. The Bell System Technical Journal. 1948;27:623–656. [Google Scholar]
- Sireteanu R, Rettenbach R. Perceptual learning in visual search generalizes over tasks, locations, and eyes. Vision Research. 2000;40:2925–2949. doi: 10.1016/s0042-6989(00)00145-0. [DOI] [PubMed] [Google Scholar]
- Smirnakis SM, Brewer AA, Schmid MC, Tolias AS, Schüz A, Augath M, Inhoffen W, Wandell BA, Logothetis NK. Lack of long-term cortical reorganization after macaque retinal lesions. Nature. 2005;435:300–307. doi: 10.1038/nature03495. [DOI] [PubMed] [Google Scholar]
- Sommerhalder J, Oueghlani E, Bagnoud M, Leonards U, Safran AB, Pelizzone M. Simulation of artificial vision: I. Eccentric reading of isolated words, and perceptual learning. Vision Research. 2003;43:269–283. doi: 10.1016/s0042-6989(02)00481-9. [DOI] [PubMed] [Google Scholar]
- Song Y, Ding Y, Fan S, Qu Z, Xu L, Lu C, Peng D. Neural substrates of visual perceptual learning of simple and complex stimuli. Clinical Neurophysiology. 2005;116:632–639. doi: 10.1016/j.clinph.2004.09.019. [DOI] [PubMed] [Google Scholar]
- Stelmack JA, Massof RW, Stelmack TR. Is there a standard of care for eccentric viewing training? Journal of Rehabilitation Research & Development. 2004;41:729–738. doi: 10.1682/jrrd.2003.08.0136. [DOI] [PubMed] [Google Scholar]
- Stickgold R, James L, Hobson JA. Visual discrimination learning requires sleep after training. Nature Neuroscience. 2000;3:1237–1238. doi: 10.1038/81756. [DOI] [PubMed] [Google Scholar]
- Sunness JS, Liu T, Yantis S. Retinotopic mapping of the visual cortex using functional magnetic resonance imaging in a patient with central scotomas from atrophic macular degeneration. Ophthalmology. 2004;111:1595–1598. doi: 10.1016/j.ophtha.2003.12.050. [DOI] [PubMed] [Google Scholar]
- Trachtenberg JT, Chen BE, Knott GW, Feng G, Sanes JR, Welker E, Svoboda K. Long-term in vivo imaging of experience-dependent synaptic plasticity in adult cortex. Nature. 2002;420:788–194. doi: 10.1038/nature01273. [DOI] [PubMed] [Google Scholar]
- Webb BS, Roach NW, McGraw PV. Perceptual Learning in the Absence of Task or Stimulus Specificity. PLoS ONE. 2007;2(12):e1323. doi: 10.1371/journal.pone.0001323. [DOI] [PMC free article] [PubMed] [Google Scholar]
- Wilcoxon F. Individual comparisons by ranking methods. Biometrics. 1945;1:80–83. [Google Scholar]
- Xiao LQ, Zhang JY, Wang R, Klein SA, Levi DM, Yu C. Complete transfer of perceptual learning across retinal locations enabled by double training. Current Biology. 2008;18:1922–1926. doi: 10.1016/j.cub.2008.10.030. [DOI] [PMC free article] [PubMed] [Google Scholar]
- Yang T, Maunsell JHR. The effect of perceptual learning on neuronal responses in monkey visual area V4. Journal of Neuroscience. 2004;24:1617–1626. doi: 10.1523/JNEUROSCI.4442-03.2004. [DOI] [PMC free article] [PubMed] [Google Scholar]
- Yang Y, Wang XB, Frerking M, Zhou Q. Spine expansion and stabilization associated with long-term potentiation. Journal of Neuroscience. 2008;28:5740–5751. doi: 10.1523/JNEUROSCI.3998-07.2008. [DOI] [PMC free article] [PubMed] [Google Scholar]
- Yu D, Cheung S-H, Legge GE, Chung STL. Effect of letter spacing on visual span and reading speed. Journal of Vision. 2007;7(2):2, 1–10. doi: 10.1167/7.2.2. http://journalofvision.org/7/2/2/ [DOI] [PMC free article] [PubMed]
- Yuste R, Bonhoeffer T. Morphological changes in dendritic spines associated with long-term synaptic plasticity. Annual Review of Neuroscience. 2001;24:1071–1089. doi: 10.1146/annurev.neuro.24.1.1071. [DOI] [PubMed] [Google Scholar]