Abstract
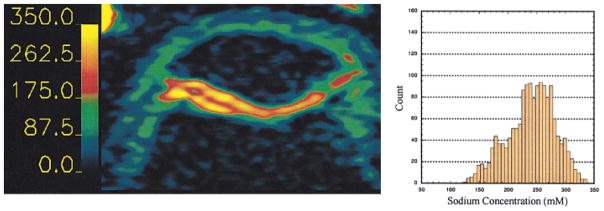
One of the initiating steps of osteoarthritis is the loss of proteoglycan (PG) molecules from the cartilage matrix. One method for assessing cartilage integrity, therefore, is to measure the PG content or fixed charge density (FCD) of cartilage. This report shows the feasibility of calculating FCD by 23Na MRI and introduces MRI protocols for human studies, in vivo. 23Na MRI was used to measure the sodium concentration inside bovine patellar cartilage. The sodium concentration was then converted to FCD (mM) by considering ideal Donnan equilibrium. These FCD measurements were compared to FCD measurements obtained through standard dimethylmethylene blue PG assays. There was a high correlation (slope = 0.89, r2 = 0.81) between the FCD measurements obtained by 23Na MRI and those obtained by the PG assays. These methods were then employed in quantifying the FCD of articular cartilage of human volunteers in vivo. Two imaging protocols were compared: one using a birdcage coil, the other using a transmit/receive surface coil. Both methodologies gave similar results, with the average sodium concentration of normal human patellar cartilage ranging from ~240 to 260 mM. This corresponds to FCDs of −158 mM to −182 mM.
Osteoarthritis (OA) is a metabolically active joint disorder of multiple etiologies. It is generally described as degradation of the cartilage matrix with symptoms of joint stiffness and swelling, bony enlargements, and pain. Biochemically, it is associated with reduced proteoglycan (PG) content, increased water content, and changes in the arrangement of collagen molecules. OA affects over 40 million Americans and more than 80% of people age 55 and older (1). As there is no cure for OA, an early diagnosis would allow for many treatment options, including the administration of possible chondroprotective agents, strategies for mechanical stress reduction, changes in physical activity, and occupational changes. Additionally, proper monitoring of cartilage health during the drug discovery process is the only way to evaluate potential therapeutic agents during development.
It has been well established that one of the primary stages of cartilage degeneration is the loss of PG from the extracellular matrix. This has been demonstrated by studying natural and induced PG depletion in animal models for OA (2–5), and diseased human specimens (6–9), and by laboratory PG depletions on ex vivo specimens using enzymes (10–14). This loss can be correlated to the severity of the disease based on histological grading schemes (8). Additionally, it has been found that the PG produced by the chondrocytes in osteoarthritic cartilage is similar to juvenile PG with respect to both the amount of chondroitin-6-sulfate and chondroitin-4-sulfate, and to the amount of keratan sulfate produced (15). Furthermore, PG fragments can be found in synovial fluid (16).
Several experimental MRI methods aimed at achieving early indications of cartilage degeneration have been reported. These methods all measure PG content indirectly through a charged diffusible tracer compound. Manganese ions (17,18) and nitroxide free radicals (2) interact electrostatically with the negatively charged PG and distribute according to where the PG occurs in the cartilage. Once distributed, they produce a relaxation enhancement effect on the water to create contrast. However, these two species are toxic and no safe delivery system has yet been devised.
The most popular contrast agent being used to measure FCD in cartilage, in vivo, is negatively charged Gd(DTPA)2− (11,19–24). As opposed to the previously mentioned contrast agents, this ion maps the absence of PG in the cartilage. The rationale for this is that the negatively charged PG will repel Gd(DTPA)2− unless there is a vacancy. This vacancy allows Gd(DTPA)2− to enter the cartilage and distribute according to the degree of PG loss. As a paramagnetic contrast agent, Gd(DTPA)2− relaxes the water associated with it much more efficiently, causing a drop in T1 and a change in the signal intensity. In calculating FCD by this method, one computes a T1 map based on post-Gd(DTPA)2− injection images and calculates the concentration of contrast agent in the tissue (25). This Gd(DTPA)2− concentration is then related to glycosaminoglycan concentration ([GAG]). However, there are some problems associated with this technique. First, effective penetration of the contrast agent requires several hours, accompanied by joint exercise. Second, maps must be acquired quickly so that the contrast agent concentration does not change during the experiment. Third, this method currently assumes that the relaxivity of Gd(DTPA)2− in cartilage is equal to the relaxivity of Gd(DTPA)2− in saline. However, it has recently been shown that the relaxivity of Gd(DTPA)2− depends on the macro-molecular content of the tissue (26), and it is well known that the macromolecular content of articular cartilage varies with depth. This suggests that the relaxivity of Gd(DTPA)2− is not constant throughout the tissue, which will lead to errors in quantifying [GAG]. Additionally, the specificity of [GAG] quantitation may be in question because collagen depletion may alter the relaxivity of the contrast agent, which in turn would be manifested in the GAG measurement. Lastly, possible interactions of the contrast agent with potential chondroprotective agents have to be measured.
One major consequence associated with the loss of PG is the loss of sodium ions from the tissue. The loss of the negatively charged PG lowers the FCD in the tissue, thereby releasing positively charged sodium ions. This loss can be calculated by considering ideal Donnan equilibrium:
| [1] |
where [Na+bath] is the sodium concentration in the bath and [Na+tissue] is the sodium concentration in the tissue (27). [Na+bath] in synovial fluid is typically 140–150 mM, while in phosphate-buffered saline (PBS) it is 154 mM. Normal human cartilage FCD ranges from ~ −50 to −250 mM, depending on age and location (28).
23Na NMR spectroscopy has extensively been used to study PG-depleted cartilage (11,12,27,29–35). Many of these studies showed that the relaxation times of the 23Na nuclei are altered in degraded cartilage, or that the signal intensity of the 23Na MR image is less intense for degraded cartilage. For example, Lesperance et al. (27) showed that 23Na NMR spectroscopy can track FCD in cartilage plugs. They also obtained a low-resolution sodium image of a cartilage specimen, but FCD was not calculated. Insko et al. (12) not only showed the progressive loss of sodium NMR signal with increased PG degradation, but also demonstrated changes in the 23Na relaxation times. Another experiment by Reddy et al. (30) showed that trypsin degradation of the PG in cartilage decreases the sodium intensity in a 23Na MRI image. Furthermore, several studies have shown 23Na MRI and MRS to be completely feasible in vivo (30,32,36,37).
The objective of the experiments detailed in this work were to: 1) compare the FCD calculations obtained through 23Na MRI with those obtained by standard chemical PG assays, 2) optimize RF coils and strategies for in vivo applications of this method, and 3) demonstrate the feasibility of in vivo quantitation of FCD by 23Na MRI.
MATERIALS AND METHODS
In Vitro FCD Mapping
Nine whole veal patellae were carefully split down the long axis, through the cartilage and bone, yielding two connected halves. Acrylic dishes were built with impermeable dividers in the center, creating two separate chambers. The patellae were placed in the dish, cartilage side down, with the divider wedged in the break in the patellae. One chamber contained a trypsin and PBS solution, while the other had only PBS. Trypsin concentrations were 20, 50, or 200 μg/ml. Degradation lasted 2 hr. After degradation, the patellae were soaked in fresh PBS to remove the trypsin and then imaged.
Imaging experiments were performed on a 4.0T GE Signa Scanner at the University of Pennsylvania Hospital. The resonance frequency of 23Na at 4.0T is 45 MHz. Sodium quantitation was performed by co-imaging the patellae with saline/agarose calibration phantoms as generally described and validated previously (38). These phantoms were 150, 200, 250, and 300 mM NaCl in 10% agarose. A 23Na 3D gradient-echo pulse sequence was employed with a 7-cm solenoid volume coil, TR = 80 ms, TE = 2.4 ms, FOV = 16 × 16 cm, 256 × 64 matrix size, slice thickness = 4.0 mm, and NEX = 16. The TR was chosen to be 80 ms to avoid potential problems associated with an increase in 23Na T1 in degraded cartilage (12). The frequency-encode direction was chosen to place the highest resolution through the depth of the cartilage. The 256 × 64 matrix was reconstructed to 256 × 256 by standard GE reconstruction methods. A calibration curve correlating pixel intensity with [Na] was calculated from the phantoms, with compensation for differences between the phantoms and the cartilage. A 5.5-ms was used for the cartilage, and a 9-ms was used for the phantoms. No disparity of the for degraded vs. nondegraded cartilage was present, as the broadening of the 23Na line due to magnetic field inhomogeneities outweighed the change in linewidth due to degradation. T1 compensation was not necessary because the images were acquired with TR ≥ 4 T1’s. This calibration curve was then applied to the 23Na MR image, yielding pixel values in concentration units (millimolar sodium). The solid content of the cartilage was compensated for by assuming an overall water volume fraction of 0.82 (39). FCD was then calculated by equations derived assuming ideal Donnan equilibrium.
Following imaging, the two cartilage halves were pried off the bone and digested separately with 0.5 mg/ml papain in PBS overnight at 60°C. Standard dimethylmethylene blue (DMMB) assays on both the cartilage and the soaking mediums were performed (40). These provided measurements of total [GAG], which allowed the computation of FCD. The DMMB solution was prepared by the following procedure: 8 mg of DMMB was added to 496.5 ml of doubly-deionized water which contained 1 g sodium formate, 2.5 ml ethanol, and 1 ml formic acid (pH = 3.6, A535 = 0.47). Absorbances at 535 nm were measured with a Spectronic UV1 Spectrophotometer (Thermo Spectronic, Rochester, NY). Absorbance was calibrated vs. known concentrations of chondroitin sulfate C (Sigma Chemicals, St. Louis, MO), which ranged from 0–300 μg/ml in PBS. Then 50 μl of each calibration point (N = 6) was added to 2 ml of the DMMB medium in a 4.5-ml methacrylate cuvette, and the % transmittance was read immediately. The standard curve was generated by plotting the absorbance of each calibration point vs. the mass of the chondroitin sulfate. Referencing the spectrometer to zero concentration was accomplished with 50 μl PBS in 2 ml DMMB medium. The samples from both the papain digestions and the degradation media were made by bringing 15 μl of the papain digestions or 5 μl of the degradation media up to 50 μl total volume with PBS, and adding 2 ml DMMB. The % transmittance was read immediately and the amount of [GAG] was determined from the standard curve. The total [GAG] for each specimen was calculated by adding the [GAG] determined from the degradation media with that determined from the papain digest. [GAG] in the control sides was determined solely from the papain digest medium. FCD was calculated from [GAG] by assuming 2 moles of negative charge per mole of chondroitin sulfate (one sulfate and one carboxylate) and a molecular weight of chondroitin sulfate of 502.5 g/mole (11,27). The calculation of FCD from the PG assay is shown in Eq. [2]:
| [2] |
FCD was calculated from the 23Na MR images using Eq. [1].
Human Imaging Protocols
Two human imaging protocols were tested. All human experiments were performed under an IRB-approved technical development protocol. The first imaging protocol involved the use of a quadrature birdcage that was 17 cm in diameter and 12.5 cm long, with 16 struts. Three sodium calibration phantoms, 150, 200, and 250 mM NaCl in 10% agarose, were simultaneously imaged with the entire knee joint of five healthy volunteers. The phantoms were placed on the side of the patella. Imaging parameters were as follows: data matrix = 256 × 64, 16 slices, FOV = 20 cm, slice thickness = 6.0 mm, NEX = 22, TR = 80 ms, TE = 2.4 ms, and flip angle = 90°. The 256 × 64 matrix was reconstructed to 256 × 256 by standard GE reconstruction methods. The number of averages was chosen to be 22 to achieve a sufficient signal-to-noise ratio (SNR), while limiting the duration to 30 min. A 4.5-ms was used in the [Na] map calculation, as initial results with in vitro human samples indicated this reduced compared to bovine samples.
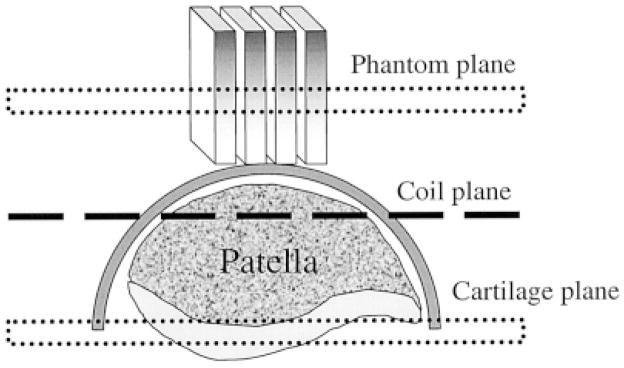
The second protocol is depicted in Fig. 1, and was as follows. Four sodium phantoms were constructed as rectangular bars, 60 × 60 × 10 mm. The concentrations were 100, 150, 200, and 250 mM in 10% agarose. An 8-cm-diameter surface coil was placed on the patella of three healthy volunteers so as to position the patellar cartilage ~2 cm from the coil. Two high [Na] phantoms were placed at the edge of the coil to mark its position in the images. The four calibration phantoms were placed on the kneecap and included in the FOV. The imaging parameters were identical to the birdcage coil experiments except for the acquisition time, which was 22 min. Fewer sums (16 NEX) were needed compared with the birdcage coil experiments to yield images of adequate SNR. After acquiring the images, the calibration curve was generated by using regions of interest (ROIs) in the phantoms that were as far away from the coil as the plane of the patellar cartilage. This curve was then applied to the image, yielding [Na] maps.
FIG. 1.
Setup for a surface coil experiment in which the phantoms are placed on top of the kneecap. The calibration curve is generated from the plane within the phantoms that is equidistant from the coil as the patellar cartilage.
RESULTS AND DISCUSSION
Treatment of one side of the bovine patellae with trypsin, in addition to biological variability, yielded samples with a broad range of FCD. This was beneficial for many reasons, but most of all for generating many unique data points. Previous studies have concentrated on distinguishing between degraded halves and nondegraded halves of patellar cartilage sections and measuring changes in PG. However, in this study the focus was on quantitatively measuring the FCD by 23Na MRI, regardless of whether the cartilage was degraded or not. This is the type of measurement we would perform as part of an in vivo screening program to evaluate cartilage integrity.
The image in Fig. 2 is a [Na] map calculated from a representative slice from a 3D 23Na MRI data set, showing the degraded side (top) and the control side (bottom). It can be seen in the image that the sodium content, reflected by the barscale in the image, is lower in the degraded side than the control side. The average [Na] on the degraded side was 261 mM, while it was 316 mM on the control side, with minima of ~150 mM on the peripheral edges of the tissue. These [Na] measurements correspond to average FCDs of −192 mM and −260 mM, respectively, as calculated from Eq. [1]. [Na] was highest in the center of the cartilage, for both the degraded and the control sides. As was expected, this corresponded to the areas of highest PG content in cartilage.
FIG. 2.
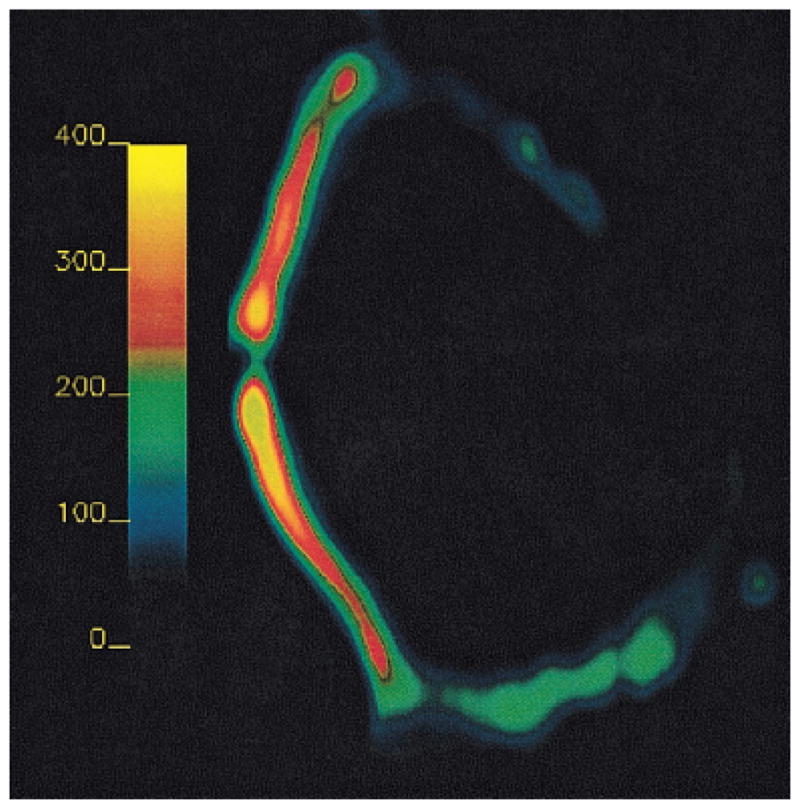
Sodium concentration map of a bovine patella, the top half of which has been degraded with trypsin. Degradation of the cartilage was accomplished with 2-hr treatments of one side of nine patellae. The [Na] in the control side (bottom half) for this slice was 316 mM; the degraded side was 261 mM. The decreased [Na] indicates FCD loss according to Eq. [1].
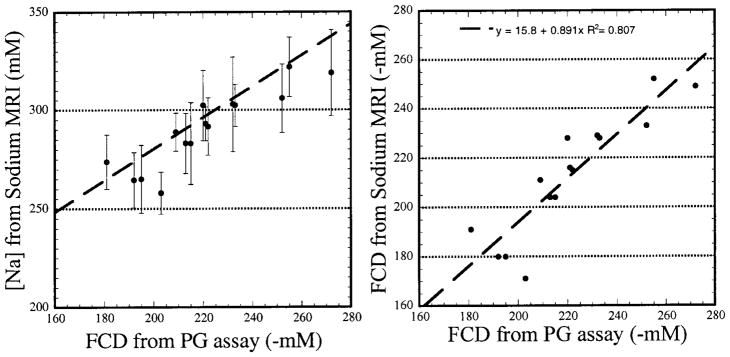
The bovine degradation experimental data are summed up in two similar figures. Figure 3 (left) shows the average [Na] calculated from eight complete 23Na MRI data sets, plotted against the FCD calculated by the PG assay. Sixteen data points were used, arising from both halves of eight patellae. One patella was not used because it was an outlier. This was established using Chauvenet’s criterion, with the source of the error being possible leaking of the degradation chamber (41). The dashed line is the calculated [Na] fitted using Eq. [1]. The bathing medium was PBS, so [Nabath] in Eq. [1] was 154 mM. It can be seen here that the measured [Na] are close to the predicted values, using ideal Donnan equilibrium, with the majority of the averages being slightly less than the predicted values. However, one should not assume error in the 23Na MRI from this, as the PG assay is never considered to be 100% quantitative. The PG assay suffers from several inherent errors, mainly involving precipitation of the DMMB-GAG complex and the nonlinearity present in the GAG calibration curves (42).
FIG. 3.
Two different graphical representations of the data from the half-degradation experiments. Left: [Na] calculated for both the control and degraded halves of each patella. [Na] decreases with PG loss. Right: FCD calculated from both the PG assay and the sodium MRI. The theoretical slope of this line is 1. The measured slope of the line is 0.89 with a correlation coefficient of 0.81.
Figure 3 (right) is a plot of the average FCD calculated from each complete 23Na MRI data set vs. the FCD calculated by the PG assay. The theoretical slope of the line is 1 if we assume both measurements should give the same answer. We obtained a slope of 0.89, with a high correlation (r2 = 0.81). We conclude from this that it is possible to measure FCD in cartilage with 23Na MRI with an accuracy of at least 90%, with respect to those calculations performed with a PG assay. This is the first time that FCD has been calculated from a 23Na MRI experiment.
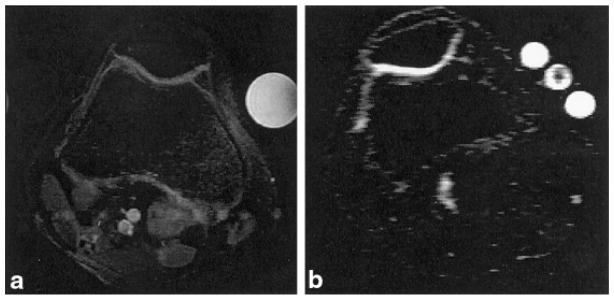
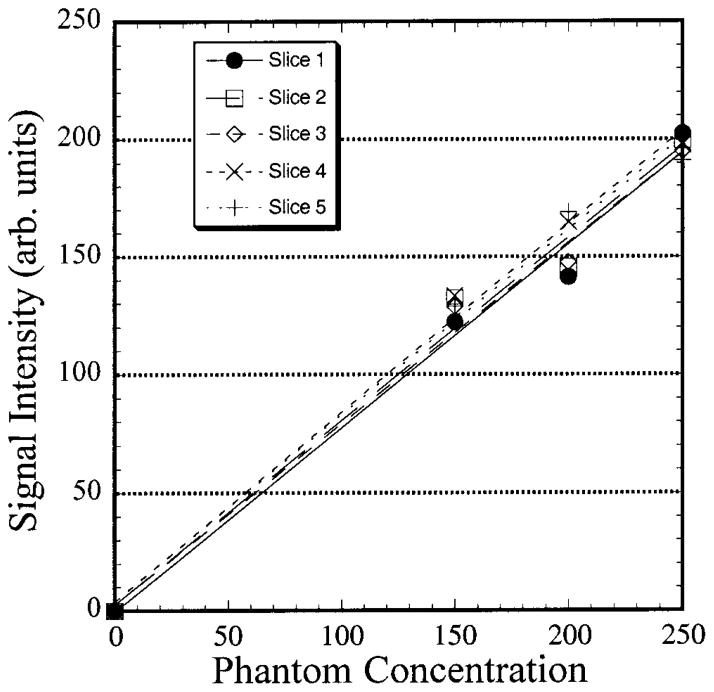
Figure 4 shows anatomical 1H and 23Na MR images of the human knee joint. The proton image is shown to acquaint the reader with a more recognizable anatomical view and to provide a reference for delineation of the cartilage boundaries. Strikingly present in the two images are the well defined cartilage layers, particularly in the 23Na image. The SNR of the cartilage in the 23Na image is ~12:1. Typically, given a patellar length of ~30–40 mm and a slice thickness of 6 mm, one would expect to get four to six slices of the patella in a given data set. As the 23Na MRI was acquired as a 3D data set, a single calibration curve was generated and used to process all of the data in the data set. For the above data set, six slices including the patella were obtained, with the phantoms appearing whole in five of them. Calibration curves for these five slices were calculated and averaged to yield the master calibration curve that was applied to the entire data set. The mean background intensity in the image was used as the y intercept. The calibration curves are shown in Fig. 5. This had the advantage of removing potential errors in the calculation of [Na] due to spatial imperfections in the phantoms. The robustness of the 23Na MRI can be seen in the slopes of the lines from the different slices. The standard deviation of the slope for all of the slices was 1.5% of the mean.
FIG. 4.
a: Axial proton fat-suppressed fast spin-echo image of a human knee joint. Two phantoms are included in the FOV: a water phantom (bright and right), and a fat phantom (dark and left). b: Axial 23Na MRI of the same knee joint. Three phantoms are included in the FOV. The center phantom is shaded because it is the end of the tube. The threshold was adjusted to yield maximum contrast between the cartilage and the surrounding tissue, thereby maximizing the signal intensities in the other two phantoms.
FIG. 5.
Five calibration curves from different slices in a 23Na MRI 3D data set.
Figure 6 shows three [Na] maps and histograms from the cartilage from three slices from a 3D 23Na MRI data set. [Na] in the cartilage ranges from 140 mM to nearly 350 mM, corresponding to a maximum FCD of ~ −270 mM. [Na] was higher in the interior layers of the cartilage, with the maximal values being in the center region of the patella. Lower [Na] can be seen in other structures and at the edges of the cartilage where there is an interface with other tissues. This phenomenon was observed on all five patellae imaged. [Na] was higher in the patella than in the femoral chondyle. However, this may be a somewhat artifactual measurement due to the extreme thinness and curvature of the chondyle, leading to partial volume effects and underestimation of [Na]. This would also be true for the far medial and lateral facets of the patella.
FIG. 6.
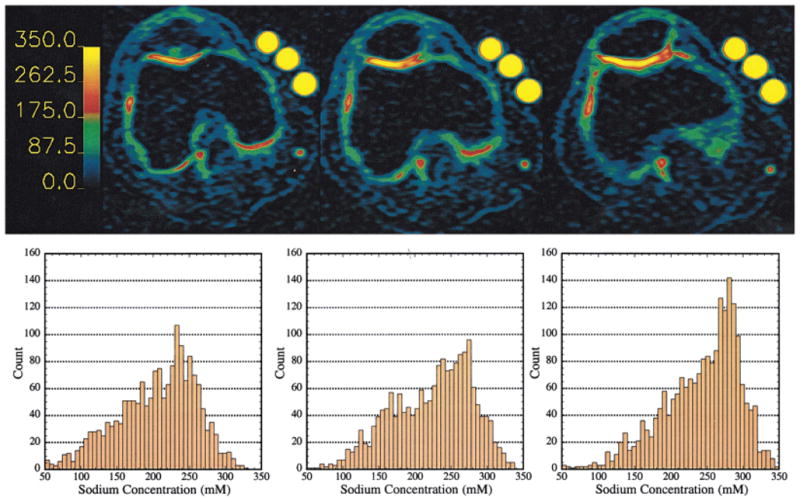
Sodium concentration maps from three slices from a 3D data set. The barscale is in millimolar sodium. Histograms correspond to the map above it, and contain only the pixels from the cartilage on or near the patella. Left: image displaying cartilage mainly from the femoral chondyle. The mean [Na] was 223 mM, FCD = −135 mM. Center: patellar cartilage, mean [Na] was 240 mM, FCD = −158 mM. Right: patellar cartilage, mean [Na] was 258 mM, FCD −182 mM. The signal intensity of the phantoms is maximized due to the thresholding of the maps.
In an attempt to reduce the imaging time and expedite the quantification of sodium in vivo, we decided to acquire 23Na images using an 8-cm-diameter transmit/receive surface coil placed on the patella (Fig. 1). Figure 7 shows the 23Na MR image from the knee of a volunteer. Two bright phantoms show the plane of the coil. The signal intensity of the phantoms decreases as the distance from the coil increases, as predicted by Biot-Savart’s law. However, there is very high homogeneity in the plane, parallel to the coil in both the cartilage and the phantoms. This was expected, since at low MRI frequencies the deterioration of the in-plane B1 homogeneity due to differences in conductivities of different tissues is not present (43). Figure 8 shows the [Na] map and corresponding histogram from the cartilage from this slice. The [Na] is, again, highest in the center layers of the cartilage and ranges from ~140 mM to nearly 350 mM. The mean [Na] was 245 mM, corresponding to an FCD of −165 mM. This trend of concentrations is reproducible when the data obtained from the birdcage and surface coils are compared.
FIG. 7.
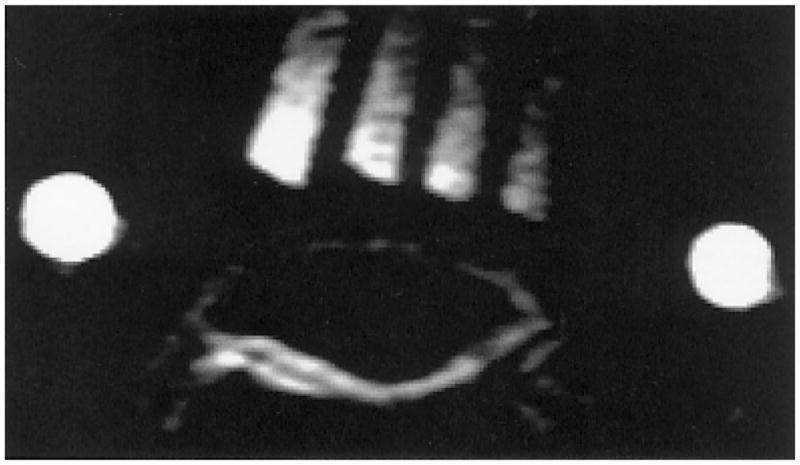
23Na MR image of a human patella with four calibration phantoms placed on top of the kneecap, as depicted in Fig. 1. The two bright circles are phantoms placed at the edge of the coil to identify its position.
FIG. 8.
Sodium concentration map from the surface coil experiments. The barscale is in millimolar Na. The histogram contains only the pixels from the cartilage on or near the patella. The mean [Na] was 245 mM, FCD = −165 mM.
As the [Na] maps reflect the spatial distribution of sodium in the cartilage, reporting the data as an average over the whole area or volume defeats the purpose of imaging, and should only be used when comparing imaging data with spectroscopy or destructive assays on samples (e.g., Fig. 3). The reason for this lies in the eventual role the data will play. Our FCD measurements will ultimately be used to make judgments on whether cartilage is responding to therapy (chemical or physical). Histogram analyses are well suited for analyzing these types of data. By comparing histogram profiles and parameters, one could discern the tissue’s response to a given therapy, i.e., whether it is improving, maintaining, or deteriorating.
CONCLUSIONS
Quantitative, noninvasive means of monitoring cartilage integrity are extremely important in the clinical realm as well as in the pharmaceutical arena. Clinically, these methods can be used to diagnose the disease at early stages, offering the possibility of early treatment. Additionally, these techniques can be used in the pharmaceutical industry for research and development, and in clinical trials. This last point will become increasingly critical as the newer drugs, aimed at targeting the disease in its early stages, will be administered prior to the onset of pain. This will preclude the use of pain measurements as clinical trial markers. We have advanced 23Na MRI to the point where it is now ready to participate in these facets of treatment.
23Na MRI was shown to accurately measure the FCD in articular cartilage. Protocols were presented by which these techniques can be implemented in humans with acquisition lengths of 30 min or less. While 23Na MRI does require special coils and hardware modifications, these are simple adjustments and are easily implemented on any scanner. In fact, these adjustments do not require extra transmit/receive channels (44). The use of multicoil arrays and pulse sequence refinement, especially in the reduction of TE, will aid in the contraction of the acquisition length. Additionally, 3.0T scanners have recently gained FDA approval for clinical use and are becoming more prevalent, making the possibility of clinical 23Na MRI a near-term possibility. Experiments at 3.0T, as well as at 1.5T, are needed to evaluate this. Further studies are needed to corroborate the FCD measurements made in vivo. Preliminary results with human cartilage samples harvested from partial or total knee replacement surgeries show that even with the relatively poorer image resolution of 23Na MRI, subtle changes in PG content can be detected. A full report of these examinations is in progress.
Acknowledgments
We thank Dr. Brian Sydow for sharing the preliminary data from human cartilage samples harvested from partial or total knee replacement surgeries. We also thank Rich Berghaus and Anthony Mazzocchi for assistance with the human imaging apparatuses.
Grant sponsor: NIH; Grant numbers: RR02305; R01-AR45242-01.
References
- 1.Fife RS. A short history of osteoarthritis. In: Moskowitz RW, Howell DS, Goldberg VM, Mankin HJ, editors. Osteoarthritis: diagnosis and medical/surgical management. Philadelphia: W.B. Saunders; 1992. p. 11. [Google Scholar]
- 2.Bacic G, Liu KJ, Goda F, Hoopes PJ, Rosen GM, Swartz HM. MRI contrast enhanced study of cartilage proteoglycan degradation in the rabbit knee. Magn Reson Med. 1997;37:764–768. doi: 10.1002/mrm.1910370520. [DOI] [PubMed] [Google Scholar]
- 3.van de Loo AA, Arntz OJ, Otterness IG, van den Berg WB. Proteoglycan loss and subsequent replenishment in articular cartilage after a mild arthritic insult by IL-1 in mice: impaired proteoglycan turnover in the recovery phase. Agents Actions. 1994;41:200–208. doi: 10.1007/BF02001917. [DOI] [PubMed] [Google Scholar]
- 4.Wilson D, Paul PK, Roberts ED, Blancuzzi V, Gronlundjacob J, Vosbeck K, Dipasquale G, Obyrne EM. Magnetic resonance imaging and morphometric quantitation of cartilage histology after chronic infusion of interleukin-1 in rabbit knees. Proc Soc Exp Biol Med. 1993;203:30–37. doi: 10.3181/00379727-203-43569. [DOI] [PubMed] [Google Scholar]
- 5.O’Byrne EM, Paul PK, Blancuzzi V, Wilson D, Gunson D, Wang JZ, Mezrich RS, Douglas FL. Magnetic resonance imaging of the rabbit knee: detection of cartilage proteoglycan degradation. Agents Actions. 1991;34:214–216. doi: 10.1007/BF01993283. [DOI] [PubMed] [Google Scholar]
- 6.Michelacci YM, Mourao PAS, Laredo J, Dietrich CP. Chondroitin sulfates and proteoglycans from normal and arthrosic human cartilage. Tissue Res. 1979;7:29–36. doi: 10.3109/03008207909152350. [DOI] [PubMed] [Google Scholar]
- 7.Venn M, Maroudas A. Chemical composition and swelling of normal and osteoarthritic femoral head cartilage. Ann Rheum Dis. 1977;36:121–129. doi: 10.1136/ard.36.2.121. [DOI] [PMC free article] [PubMed] [Google Scholar]
- 8.Mankin HJ, Dorfman H, Zarins L. Biochemical and metabolic abnormalities in articular cartilage from osteoarthritic human hips. II. Correlation of morphology with biochemical and metabolic data. J Bone Joint Surg. 1971;53A:523–537. [PubMed] [Google Scholar]
- 9.Bollet AJ, Nance JL. Biochemical findings in normal and osteoarthritic articular cartilage. II. Chondroitin sulfate concentration and chain length, water, and ash content. J Clin Invest. 1966;45:1170–1177. doi: 10.1172/JCI105423. [DOI] [PMC free article] [PubMed] [Google Scholar]
- 10.Borthakur A, Shapiro EM, Beers J, Kudchodkar S, Kneeland JB, Reddy R. Sensitivity of MRI to proteoglycan depletion in cartilage: comparison of sodium and proton MRI. Osteoarthritis Cartilage. 2000;8:288–293. doi: 10.1053/joca.1999.0303. [DOI] [PubMed] [Google Scholar]
- 11.Bashir A, Gray ML, Hartke J, Burstein D. Nondestructive imaging of human cartilage glycosaminoglycan concentration by MRI. Magn Reson Med. 1999;41:857–865. doi: 10.1002/(sici)1522-2594(199905)41:5<857::aid-mrm1>3.0.co;2-e. [DOI] [PubMed] [Google Scholar]
- 12.Insko EK, Kaufman JH, Leigh JS, Reddy R. Sodium NMR evaluation of articular cartilage degradation. Magn Reson Med. 1999;41:30–34. doi: 10.1002/(sici)1522-2594(199901)41:1<30::aid-mrm6>3.0.co;2-u. [DOI] [PubMed] [Google Scholar]
- 13.Wachsmuth L, Juretschke HP, Raiss RX. Can magnetization transfer magnetic resonance imaging follow proteoglycan depletion in articular cartilage? MAGMA. 1997;5:71–78. doi: 10.1007/BF02592269. [DOI] [PubMed] [Google Scholar]
- 14.Bonassar LJ, Frank EH, Murray JC, Paguio CG, Moore VL, Lark MW, Sandy JD, Wu J-J, Eyre DR, Grodzinsky AJ. Changes in cartilage composition and physical properties due to stromelysin degradation. Arthritis Rheum. 1995;38:173–183. doi: 10.1002/art.1780380205. [DOI] [PubMed] [Google Scholar]
- 15.McDevitt CA, Muir H. Biochemical changes in the cartilage of the knee in experimental and natural osteoarthritis in the dog. J Bone Joint Surg. 1976;58-B:94–101. doi: 10.1302/0301-620X.58B1.131804. [DOI] [PubMed] [Google Scholar]
- 16.Dahlberg L, Ryd L, Heinegard D, Lohmander LS. Proteoglycan fragments in joint fluid. Acta Orthop Scand. 1992;4:417–423. doi: 10.3109/17453679209154758. [DOI] [PubMed] [Google Scholar]
- 17.Grunder W, Biesold M, Wagner M, Werner A. Improved nuclear magnetic resonance microscopic visualization of joint cartilage using liposome entrapped contrast agents. Invest Radiol. 1998;33:193–202. doi: 10.1097/00004424-199804000-00001. [DOI] [PubMed] [Google Scholar]
- 18.Kusaka Y, Grunder W, Rumpel H, Dannhauer KH, Gersonde K. MR microimaging of articular cartilage and contrast enhancement by manganese ions. Magn Reson Med. 1992;24:137–148. doi: 10.1002/mrm.1910240114. [DOI] [PubMed] [Google Scholar]
- 19.Allen RG, Burstein D, Gray ML. Monitoring glycosaminoglycan replenishment in cartilage explants with gadolinium-enhanced magnetic resonance imaging. J Orthop Res. 1999;17:430–436. doi: 10.1002/jor.1100170320. [DOI] [PubMed] [Google Scholar]
- 20.Trattnig S, Mlynarik V, Breitenseher M, Huber M, Zembsch A, Rand T, Imhof H. MRI visualization of proteoglycan depletion in articular cartilage via intravenous administration of Gd-DTPA. Magn Reson Imaging. 1999;17:577–583. doi: 10.1016/s0730-725x(98)00215-x. [DOI] [PubMed] [Google Scholar]
- 21.Mlynarik V, Trattnig S, Huber M, Zembsch A, Imhof H. The role of relaxation times in monitoring proteoglycan depletion in articular cartilage. J Magn Reson Imaging. 1999;10:497–502. doi: 10.1002/(sici)1522-2586(199910)10:4<497::aid-jmri1>3.0.co;2-t. [DOI] [PubMed] [Google Scholar]
- 22.Borthakur A, Shapiro EM, Kudchodkar S, Kneeland JB, Reddy R. Sodium MRI and Gd(DTPA)2−-enhanced MRI in the quantitation of proteoglycans in cartilage. Proceedings of the 8th Annual Meeting of ISMRM; Denver. 2000. p. 2112. [Google Scholar]
- 23.Bashir A, Gray ML, Boutin RD, Burstein D. Glycosaminoglycan in articular cartilage: in vivo assessment with delayed Gd-DTPA2−-enhanced MR imaging. Radiology. 1997;205:551–558. doi: 10.1148/radiology.205.2.9356644. [DOI] [PubMed] [Google Scholar]
- 24.Bashir A, Gray ML, Burstein D. Gd-DTPA2− as a measure of cartilage degradation. Magn Reson Med. 1996;36:665–673. doi: 10.1002/mrm.1910360504. [DOI] [PubMed] [Google Scholar]
- 25.Burstein D, Velyvis J, Scott KT, Stock KW, Kim Y-J, Jaramillo D, Boutin RD, Gray ML. Protocol issues for delayed Gd(DTPA)2−-enhanced MRI (dGEMRIC) for clinical evaluation of articular cartilage. Magn Reson Med. 2001;45:36–41. doi: 10.1002/1522-2594(200101)45:1<36::aid-mrm1006>3.0.co;2-w. [DOI] [PubMed] [Google Scholar]
- 26.Stanisz GJ, Henkelman RM. Gd-DTPA relaxivity depends on macromolecular content. Magn Reson Med. 2000;44:665–667. doi: 10.1002/1522-2594(200011)44:5<665::aid-mrm1>3.0.co;2-m. [DOI] [PubMed] [Google Scholar]
- 27.Lesperance LM, Gray ML, Burstein D. Determination of fixed charge-density in cartilage using nuclear-magnetic-resonance. J Orthop Res. 1992;10:1–13. doi: 10.1002/jor.1100100102. [DOI] [PubMed] [Google Scholar]
- 28.Maroudas A. Physicochemical properties of articular cartilage. In: Freeman MAR, editor. Adult articular cartilage. Kent, England: Pitman Medical Publishing Co; 1979. [Google Scholar]
- 29.Reddy RR, Kaufman JH, Noyszewski EA, Reddy R. Sodium and proton MR properties of cartilage during compression. J Magn Reson Imaging. 1999;10:961–967. doi: 10.1002/(sici)1522-2586(199912)10:6<961::aid-jmri8>3.0.co;2-a. [DOI] [PubMed] [Google Scholar]
- 30.Reddy R, Insko EK, Noyszewski EA, Dandora R, Kneeland JB, Leigh JS. Sodium MRI of human articular cartilage in vivo. Magn Reson Med. 1998;39:697–701. doi: 10.1002/mrm.1910390505. [DOI] [PubMed] [Google Scholar]
- 31.Reddy R, Insko EK, Leigh JS. Triple quantum sodium imaging of articular cartilage. Magn Reson Med. 1997;38:279–284. doi: 10.1002/mrm.1910380218. [DOI] [PubMed] [Google Scholar]
- 32.Reddy R, Li SC, Noyszewski EA, Kneeland JB, Leigh JS. In vivo sodium multiple quantum spectroscopy of human articular cartilage. Magn Reson Med. 1997;38:207–214. doi: 10.1002/mrm.1910380208. [DOI] [PubMed] [Google Scholar]
- 33.Reddy R, Insko EK, Leigh JS. Triple quantum sodium imaging of articular cartilage. Magn Reson Med. 1997;38:279–284. doi: 10.1002/mrm.1910380218. [DOI] [PubMed] [Google Scholar]
- 34.Jelicks LA, Paul PK, O’Byrne E, Gupta RK. H-1, Na-23, and C-13 MR spectroscopy of cartilage degradation in vitro. J Magn Reson Imaging. 1993;3:565–568. doi: 10.1002/jmri.1880030403. [DOI] [PubMed] [Google Scholar]
- 35.Bashir A, Gray ML, Burstein D. Sodium T1 and T2 in control and degraded cartilage: implications for determination of tissue proteoglycan content. Proceedings of the 3rd Annual Meeting of SNR; Nice. 1995. p. 1896. [Google Scholar]
- 36.Borthakur A, Hancu I, Boada FE, Shen GX, Shapiro EM, Reddy R. In vivo triple quantum filtered twisted projection sodium MRI of human articular cartilage. J Magn Reson. 1999;141:286–290. doi: 10.1006/jmre.1999.1923. [DOI] [PubMed] [Google Scholar]
- 37.Granot J. Sodium imaging of human body organs and extremities in vivo. Radiology. 1988;167:547–550. doi: 10.1148/radiology.167.2.3357970. [DOI] [PubMed] [Google Scholar]
- 38.Shapiro EM, Borthakur A, Dandora R, Kriss A, Leigh JS, Reddy R. Sodium visibility and quantitation in intact bovine articular cartilage using high field 23Na MRI and MRS. J Magn Reson. 2000;142:24–31. doi: 10.1006/jmre.1999.1932. [DOI] [PubMed] [Google Scholar]
- 39.Shapiro EM, Borthakur A, Kaufman JH, Leigh JS, Reddy R. Water distribution patterns inside bovine articular cartilage as visualized by 1H magnetic resonance imaging. Osteoarthritis Cartilage. 2001;9:533–538. doi: 10.1053/joca.2001.0428. [DOI] [PubMed] [Google Scholar]
- 40.Farndale RW, Sayers CA, Barrett AJ. A direct spectrophotometric microassay for sulfated glycosaminoglycans in cartilage cultures. Connect Tissue Res. 1982;9:247–248. doi: 10.3109/03008208209160269. [DOI] [PubMed] [Google Scholar]
- 41.Bevington PR, Robinson DK. Data reduction and error analysis for the physical sciences. 2. New York: McGraw Hill; 1992. [Google Scholar]
- 42.Goldberg RL, Kolibas LM. An improved method for determining proteoglycans synthesized by chondrocytes in culture. Connect Tissue Res. 1990;24:256–275. doi: 10.3109/03008209009152154. [DOI] [PubMed] [Google Scholar]
- 43.Collins CM, Smith MB. Calculations of B1 distribution, SNR, and SAR for a surface coil adjacent to an anatomically-accurate human body model. Magn Reson Med. 2001;45:692–699. doi: 10.1002/mrm.1092. [DOI] [PubMed] [Google Scholar]
- 44.Bolinger L, Mizsei G, Cecil K, Englander S. Sodium imaging of the breast at 4.0T. Proceedings of the 6th Annual Meeting of ISMRM; Sydney, Australia. 1998. p. 1923. [Google Scholar]


