

Abstract
Hypericum perforatum extracts have been used to treat diseases including mild-to-moderate depression and inflammatory conditions. It is particularly important to identify which constituents present in the H. perforatum extracts are responsible for its' anti-inflammatory activity since consumers are taking H. perforatum preparations to treat inflammation. We used a combination of four putative bioactive constituents, called the 4-component-system, that interacted synergistically to explain the light-activated anti-inflammatory activity of an H. perforatum fraction in RAW 264.7 mouse macrophages and combined the constituents at concentrations detected in the fraction to identify key molecular targets. LPS was used to model an inflammatory response and the 4-component-system and H. perforatum fraction were used as treatments that inhibited LPS induced prostaglandin E2 (PGE2) production in RAW 264.7 mouse macrophages in studies of gene expression profiles. We used Affymetrix genechips, statistical analysis, and quantitative real-time PCR to identify key gene targets of the 4-component-system and the sub-fraction from an H. perforatum ethanol extract. The H. perforatum sub-fraction with or without LPS stimulation affected far more genes than the 4-component-system with and without LPS. Genes involved in Janus kinase and signal transducer and activator of transcription (JAK-STAT) and eicosanoid pathways were identified that could account for the reduction in PGE2 seen with both treatments in the LPS-stimulated macrophages. Ten genes may be particularly important targets for the activity of the 4-component-system and the fraction with LPS stimulation and these genes were involved in inflammatory signaling pathways, namely JAK-STAT and eicosanoid pathways.
Keywords: gene expression, Hypericum perforatum, interactions, RAW 264.7 mouse macrophages, pseudohypericin, amentoflavone, quercetin, chlorogenic acid
2. Introduction
Macrophages can release inflammatory mediators such as prostaglandins and cytokines in response to lipopolysaccharide (LPS) stimulation validating the use of LPS treated macrophages as a model of inflammation. Genes with prominent roles in LPS-induced inflammation include cyclooxygenase-2 (COX-2), nuclear factor-kappa B (NF-κB), and tumor necrosis factor-alpha (TNF-α), among others (Bjorkbacka et al., 2004). Chronic inflammatory states are associated with the pathogenesis of major chronic diseases (Coussens and Werb, 2002) and botanicals that modulate key gene targets may be useful for treating inflammatory-associated diseases.
Hypericum perforatum extracts contain constituents unique to certain species of the genus Hypericaceae such as pseudohypericin, hypericin, and hyperforin (Bilia et al., 2002). H. perforatum extracts are complex mixtures and may exert a variety of bioactivities including anti-proliferative, anti-inflammatory, anti-depressant, and antiviral activities (Upton, E., 1997) but mechanistic studies have been limited to date.
Research in our laboratory found that the concentrations of individual constituents in H. perforatum extracts could not account for the anti-inflammatory activity of these extracts, as characterized by a reduction in LPS-induced prostaglandin E2 (PGE2) production in RAW 264.7 mouse macrophages (Hammer et al., 2007). Furthermore, four compounds present in H. perforatum added as a 4-component-system replicated the light-dependent reduction of LPS-induced PGE2 production by a sub-fraction when combined at concentrations that were detected in the fraction (0.07 μM amentoflavone, 0.08 μM quercetin, 0.2 μM chlorogenic acid, and 0.03 μM pseudohypericin) (Hammer et al., 2008). Pseudohypericin was necessary but not sufficient for the light-activated reduction in LPS-induced PGE2 of the 4-component-system. This combination of constituents also exhibited similar inhibition of COX-2, lipoxygenase (LO), and phospholipase A2 (cPLA2) enzyme activity as the H. perforatum fraction, but displayed different effects on the production of the pro-inflammatory cytokine TNF-α and the anti-inflammatory cytokine interleukin-10 (IL-10). This suggested that the H. perforatum fraction and 4-component-system might similarly affect the eicosanoids, but have dissimilar impacts on other mediators of inflammation, such as cytokines. The purpose of the current research was to study RAW 264.7 macrophages treated with LPS as a model of inflammation, and the recently identified 4-component-system as an inhibitor of this inflammation to initially identify gene targets of the synergistic set of 4 compounds by microarray analysis. The fraction that was used to identify the 4-component-system was used to determine similarities and differences in the impact of the complex fraction and the isolated 4 compounds on molecular targets in pathways mediated by LPS.
Krusekopf and Roots (2005) studied an ethanol H. perforatum extract and one selected constituent at the concentration present in the extract, 1 μM hyperforin, on gene expression in HepG2 human hepatocellular carcinoma cells after 24 hours of treatment. Treatment with the H. perforatum extract or hyperforin led to differential expression (increase or decrease) of 182 genes and 201 genes, respectively. Treatment with the H. perforatum extract led to increased expression of drug metabolizing enzymes like cytochrome p450 subtypes and decreased expression of genes involved in cholesterol biosynthesis, but increased expression of genes involved in glycolysis.
The experiments reported here compared the gene expression profiles of the 4-component-system at concentrations present in the fraction to the gene expression profiles of the H. perforatum fraction to identify key genes in signaling pathways that may be important for both treatments for the reduction in PGE2 production in LPS treated RAW 264.7 macrophage cells. We postulated that the key genes in the eicosanoid pathway would be down modulated by both the fraction and 4-component-system when LPS was added and that genes upstream, like the mitogen-activated protein kinases (MAPK) or janus kinase and signal transducer and activator of transcription (JAK-STAT), would also be down modulated.
3. Experimental
3.1 Cell culture
RAW 264.7 mouse macrophage cells were cultured as previously described (Hammer et al., 2007). Cells were grown in T-75 flasks until approximately 70-80% confluent, and plated in 150 × 25 mm tissue culture dishes and allowed to attach overnight. The cells were treated with or without 1 μg/ml lipopolysaccharide (LPS) (Escherichia coli 02B:B6) (Sigma, St. Louis, MO) and solvent control [media + tissue culture grade dimethylsulfoxide (DMSO; Sigma, St. Louis, MO)], H. perforatum sub-fraction at 10 μg/ml, or 4-component-system composed of 0.07 μM amentoflavone, 0.08 μM quercetin, 0.2 μM chlorogenic acid, and 0.03 μM pseudohypericin for 8 hours. The H. perforatum fraction was a third round sub-fraction derived from a bioactivity-guided fractionation of a Soxhlet ethanol H. perforatum extract described previously (Hammer et al., 2008). Each treatment was performed in triplicate. Due to the light-activated properties of pseudohypericin, treatments were performed in the dark with subsequent exposure for 30 minutes to ambient light (5.2 J/cm2) as previously described (Hammer et al., 2007). Dark treatment conditions were not included in the assessment because the 4-component-system did not mimic the reduction of LPS-induced PGE2 of the H. perforatum fraction in dark conditions (Hammer et al., 2008). For the time course studies, treatments were performed as described above and samples were collected at 0.5, 1, 2, 4, 8, and 24 hours after treatment was added.
3.2 RNA isolation
After the treatment period, the cells were washed twice with 1x phosphate buffered saline on ice and collected in tubes. RNA was extracted using the Trizol method (Invitrogen; Carlsbad, CA) followed by an RNeasy purification kit (Qiagen; Valencia, CA). The RNA quality, integrity, and quantity were tested on an Agilent Bioanalyzer 2100 and RNA Nano 6000 Labchip kit (Agilent Technologies; Palo Alto, CA).
3.3 Gene chip array
Each replicated treatment was analyzed on an individual GeneChip Mouse Expression Set 430 (Affymetrix; Santa Clara, CA). The chips were all from the same lot to eliminate variations among different lots. The labeling of RNA was performed using the once-cycle target labeling and control reagent package according to manufacturer's instructions (Affymetrix; Santa Clara, CA). A GeneChip fluidics station 450 and a GeneChip Scanner 3000 7G were used to process the chips (Affymetrix; Santa Clara, CA). All techniques for the array were performed according to the manufacturer's instructions by the Gene Chip Facility at Iowa State University.
3.4 Quantitative real time-PCR
Residual DNA was removed with an RNAse-free DNAse kit from Qiagen (Valencia, CA). DNA-free RNA (200 ng) was reverse-transcribed using the iScript cDNA synthesis kit (BioRad, Hercules, CA). Genes that were selected for verification by quantitative real-time PCR analysis (qRT-PCR) were chosen based on their pattern of differential expression in treatments and their relationship to biological pathways of interest. Nine genes in total and a minimum of one differentially expressed gene for each treatment group (4-component-system, 4-component-system +LPS, fraction, fraction +LPS) were verified using qRT-PCR. The primers used to confirm differentially expressed genes were designed using Primer3 (Rosen and Skaletsky, 2000) and synthesized by Integrated DNA Technologies, Inc. (Coralville, IA). Sequences for each respective primer are shown in Table 1. Conditions for the polymerase chain reaction (PCR) were: 94° C for 5 minutes, and 40 cycles of 94° C for 15 seconds, 60° C for 30 seconds, and 72° C for 30 seconds.
Table 1.
Primer sequences for differentially expressed genes verified by quantitative real time PCR. S=sense, A=anti-sense. Primers were designed for mouse gene sequences using Primer3 (Rozen and Skaletzky, 2000).
| Gene | Primer | Oligonucleotide Sequence (5′-3′) |
|---|---|---|
| COX-1 | S | CCTCACCAGTCAATCCCTGT |
| AS | GTAGCCCGTGCGAGTACAAT | |
| COX-2 | S | TTGGGGAGACCATGGTAGAG |
| AS | GCTCGGCTTCCAGTATTGAG | |
| PLCβ1 | S | ACAACCAAGACATCCCAAGG |
| AS | CTCAAACAGGCCAGAGAAGG | |
| STAT1 | S | GTCAGGGCAAGACATCCACT |
| AS | GAAAATGCCATCCTCGTCAT | |
| STAT3 | S | TCCTTTCCCACTTGACCTTG |
| AS | CTGTAAGGCAATCCCTCTCG | |
| JAK1 | S | CATCCCAGTCTCTGTGCTGA |
| AS | AGCAGCCACACTCAGGTTCT | |
| JAK2 | S | GACCTGGCAACAAGGAACAT |
| AS | TCCCCTGGCTCCTTTACTTT | |
| SOCS3 | S | ATTCACCCAGGTGGCTACAG |
| AS | GCCAATGTCTTCCCAGTGTT | |
| PIK3 | S | ACCAAGAAGTCCTTCGAGCA |
| AS | GATGCCACCAGTGAGGAAAT | |
| ITK | S | AAACAAATGACAGCCCCAAG |
| AS | GAGTGACCAAACCTCCTCCA | |
| β-actin | S | GGCTATGCTCTCCCTCACG |
| AS | CACGCTCGGTCAGGATCTT | |
| GAPDH | S | CAATGTGTCCGTCGTGGAT |
| AS | AGCCCAAGATGCCCTTCAG |
PCR products were cloned into a pGEMT vector (Promega; Madison, WI). Standard curves were generated for each target gene by serial dilution and expression level of transcript abundance was calculated by regression against each respective standard curve performed in the same plate. The housekeeping gene glyceraldehyde 3-phosphate dehydrogenase (GAPDH) was used as a control gene because it was not differentially affected under any of the treatment conditions. Analysis of the gene expression data was performed according to the methods of Pfaffl (2001). Gene expression profiles are presented as expression changes in transcript abundance in comparison to respective control, either media +DMSO or media +LPS +DMSO. Gene expression profiles for the time-course are presented as expression changes in transcript abundance in comparison to media control at time 0. Conditions for qRT-PCR were: 95° C for 5 minutes, 40 cycles of 95° C for 30 seconds, 60° C for 30 seconds, 72° C for 30 seconds, followed by 95° C for 1 minute, and 55° C for 1 minute. An iCycler using the SYBR green supermix kit was used for the qRT-PCR according to manufacturer's instructions (Biorad; Hercules, CA).
3.5 Statistical analysis
The microarray experiment was designed as a randomized complete block design with 3 replications as fixed blocks and LPS (with, without) and treatment (media +DMSO, H. perforatum sub-fraction, 4-component-system) as the factors. The statistical analysis focused on identifying the genes that were differentially expressed by both the 4-component-system + LPS and the fraction + LPS to identify specific pathways that were important for the activity of the 4-component-system in inhibiting PGE2. Further analysis evaluated the genes differentially expressed by both fraction and fraction + LPS to assess pathways important for activity of the fraction that were not modified by the 4-compounds. The log signal was analyzed by each of the 45,101 probesets using the Mixed procedure in SAS (SAS Institute; Cary, NC) to identify differentially expressed genes. For each gene, t-tests were used for comparisons and corresponding p-values were converted into q-values using the method of Storey and Tibshirani (2003) to control for the false discovery rate (FDR). Fraction +LPS and 4-component-system +LPS were compared to media +LPS +DMSO and fraction and 4-component-system were compared to media + DMSO. In general, differentially expressed genes were identified at a significance level of 5%, with a 1% FDR for fraction, fraction +LPS and 40% FDR for 4-component-system and 4-component-system +LPS. Different FDR's were used for the fraction and 4-component-system to facilitate comparison of the intersection of differentially expressed genes, since the 4-component-system affected very few genes under a more stringent FDR.
To identify LPS-responsive genes, media +DMSO was compared to media +LPS +DMSO. Additionally, treatment by LPS interactions were determined for DMSO, fraction, and 4-component-system treatments. A 5% FDR was used for LPS-responsive genes and treatment by LPS interactions. For the time-course gene expression analysis, we first identified patterns of differential expression over time compared to the media control by comparing how the expression change at time point 0 varied at each of the 6 respective time points (p<0.05). Then, this change in expression level relative to media+LPS+DMSO at time point 0 for fraction+LPS or 4-component-system+LPS were compared against that of the media+LPS+DMSO control at each time point to identify treatment effects. A two-way ANOVA was used with time and treatment as factors and change in expression levels as the response variable.
DAVID 2007 was used to identify pathways with a significant over-representation of ontologically related differentially expressed genes (Dennis et al., 2003). Differentially expressed genes with increased expression levels and differentially expressed genes with decreased expression levels were analyzed separately for LPS-effect and effect of treatments on ontological classes. To prioritize possible pathways of interest for further study, differentially expressed genes that were increased and decreased by respective treatments were combined to identify pathways in which particular genes may function to induce or block a pathway of interest. The background used for the program was the mouse Affymetrix background. The TreeView program was used to develop the heat map shown in Figure 2 (Eisen et al., 1998). Hierarchical clustering was performed on genes that were shown to be differentially expressed based on a randomized complete block analysis of log expression levels of the 6 treatments. Differential expression was determined based on the methods of Benjamini and Hochberg (1995) with a FDR of 0.1%. Only 4, 536 genes that were declared to be differentially expressed were included in the cluster analysis. A Euclidean distance matrix was computed from the standardized averages for each treatment of each gene. The distance between clusters was measured by average linkage. R version 2.6.1 was used for the hierarchical cluster analysis computation and graphics.
Figure 2.

Heat map showing the magnitude of overlapping differential expression of the genes impacted by treatments. Cluster and TreeView programs were used to create the heat map. Black represents no change, red represents an increase as compared to respective control, and green represents a decrease as compared to respective control. 4 Comp Sys= 4-component-system. a Fraction and 4-component-system compared to media + DMSO as in Figure 2. b Fraction + LPS and 4-component-system + LPS compared to media + LPS + DMSO as in Figure 1. c 40% FDR for 4-component-system with and without LPS. d 5% FDR for fraction and fraction +LPS. *indicates 12 genes that were significantly affected by fraction +LPS and 4-component-system +LPS when compared to media +LPS +DMSO but not fraction when compared to media +DMSO
4. Results
To validate a molecular profile of LPS induced inflammation in RAW 264.7 mouse macrophages the effect of treatment with LPS for 8 hours on gene expression was compared in media +DMSO treatments and media +LPS +DMSO treatments. Analysis of these two treatments showed that 5,071 genes were differentially expressed by the addition of LPS to media +DMSO: 3,188 genes had increased expression levels (7.1% of total probe-sets) and 1,883 genes (4.2% of total probe-sets) had decreased expression levels (Table 2). Further analysis of changes in expression levels of transcript abundance showed that 708 genes were decreased at least 50% below the expression level of the control and 1,651 genes were increased at least 50% above the expression level of control by LPS treatment, representing 1.6% and 3.7% of the total probe-sets, respectively. Additionally, the expression levels of 104 genes showed a significant treatment by LPS interaction (increased or decreased) when media + DMSO and fraction were compared, but none of the 104 differentially expressed genes were significant for 4-component-system and media + DMSO. LPS treatment led to an over-representation of ontologically related genes involved in cell proliferation, cell cycle, cell signaling, and inflammatory response for the differentially expressed gene list that was increased by LPS. LPS treatment led to an over-representation of ontologically related genes involved in response to stress, immune response, cell motility, and cell death for the differentially expressed gene list that was decreased by LPS (Table 2).
Table 2.
Representation of functional classes of ontologically-related genes that were enriched by adding LPS to the media +DMSO control. Media +DMSO was compared against media + LPS +DMSO. Enrichment score is the negative log of the p-value (* score >1.3 indicates p-value <0.05). Number of genes per pathway in accordance with DAVID 2007. 3,188 genes were increased and 1,883 genes decreased with a 5% FDR. 1,651 genes were increased and 708 genes decreased with a 5% FDR and expression levels increased or decreased by 50% above or below the transcript abundance levels of the respective control.
| Differentially expressed gene list that was used for ontological analysis | Ontology Class | % genes differentially expressed in pathway | enrichment score |
|---|---|---|---|
| Genes that had significantly increased expression levels by LPS (1,651 genes) | Cell proliferation | 6.9 | 4.5* |
| Cell cycle | 4.3 | 3.4* | |
| Cell-cell signaling | 1.2 | 2.7* | |
| Inflammatory response | 1.6 | 2.2* | |
| Genes that had significantly decreased expression levels by LPS (708 genes) | Response to stress | 1.4 | 2.2* |
| Immune response | 6.6 | 2.2* | |
| Cell motility | 2.2 | 1.7* | |
| Cell death | 4.0 | 1.5* | |
To identify ontological classes of genes that were differentially expressed due to the H. perforatum fraction or 4 putative bioactive constituents combined to make a 4-component-system, treatments (4-component-system and fraction, 4-component-system +LPS and fraction +LPS) were compared against appropriate controls (media +DMSO or media +LPS +DMSO, respectively). Table 3 shows the gene ontology classifications of differentially expressed genes by treatment group when compared against respective controls. Biological classes that were over-represented for differentially expressed genes that were significantly increased by treatments were apoptosis, cell cycle, and immune response and the class that was over-represented for differentially expressed genes that were significantly decreased by treatments was cell proliferation (Table 3). The 4-component-system and 4-component-system +LPS compared against media +DMSO and media + LPS +DMSO, respectively, affected fewer genes in these classifications and similar patterns of differential expression were observed within biological classes for fraction and fraction +LPS when compared against media +DMSO and media +LPS +DMSO, respectively.
Table 3.
Representation of functional classes of ontologically-related genes that were enriched by treatments in LPS-stimulated RAW 264.7 macrophage cells. Enrichment score is the negative log of the p-value (* score > 1.3 indicates p-value <0.05). Number of genes per pathway in accordance with DAVID 2007. Categories were chosen based on significance and functional category of interest to inflammation, immune response, and other categories known to be affected by H. perforatum. aFraction and 4-component-system compared to media + DMSO. bFraction + LPS and 4-component-system + LPS compared to media + LPS + DMSO.
| Differentially expressed gene list that was used for ontological analysis | ontology class | enrichment score | # genes affected by 4-component-systema | # genes affected by fractiona | # genes affected by 4-component-system +LPSb | # genes affected by fraction +LPSb |
|---|---|---|---|---|---|---|
| Genes that had significantly increased expression levels by treatments | apoptosis | 3.4* | 0 | 22 | 6 | 33 |
| cell cycle | 4.5* | 0 | 30 | 10 | 30 | |
| immune response | 4.2* | 1 | 28 | 16 | 31 | |
| cell differentiation | 0.8 | 0 | 13 | 6 | 21 | |
| immune cell activation | 0.4 | 0 | 7 | 1 | 8 | |
| Genes that had significantly decreased expression levels by treatments | cell proliferation | 1.6* | 0 | 25 | 10 | 36 |
| inflammatory response | 0.3 | 0 | 2 | 0 | 3 | |
| innate immune response | 0.1 | 1 | 0 | 0 | 0 | |
Figure 1 shows the number of genes that were differentially expressed for each treatment (4-component-system, fraction compared to media +DMSO; 4-component-system +LPS, fraction +LPS compared to media +LPS +DMSO) and the overlap in differentially expressed genes for the treatments (4-component-system and fraction, 4-component-system +LPS and fraction +LPS). Fraction and fraction +LPS affected the expression levels of many genes in comparison to their respective controls, 1,837 and 1,193 genes, respectively. The 4-component-system without LPS affected the expression levels of only 6 genes significantly and the 4-component-system +LPS affected the expression levels of 69 genes when compared to respective controls. Forty-four genes were differentially expressed by fraction +LPS and 4-component-system +LPS when compared to media +LPS +DMSO. Additionally, 32 of the 44 genes that were differentially expressed by fraction +LPS and 4-component-system +LPS were also differentially expressed by the fraction when it was compared against the media +DMSO control.
Figure 1.

Diagram highlighting the number and intersection of differentially expressed genes for fraction and 4-component-system compared against media +DMSO and fraction +LPS and 4-component-system +LPS compared against media +LPS +DMSO. FDR < 5% for fraction and fraction +LPS or FDR < 40% for 4-component-system and 4-component-system +LPS, all treatments with p-value < 0.05. Numbers in common represent genes that were differentially expressed under each respective treatment group when compared to respective control. a2 of the 3 genes that were differentially expressed by both fraction and 4-component-system when compared against media +DMSO were also differentially expressed by 4-component-system +LPS when compared against media +LPS +DMSO. b32 of the 44 genes that were differentially expressed by fraction +LPS and 4-component-system +LPS when compared against media +LPS +DMSO were also differentially expressed by fraction when compared to media +DMSO (as shown in Figure 2).
Table 4 shows the ontological pathways that were over-represented by the treatments when treatments were compared against respective controls (4-component-system, fraction versus media +DMSO; 4-component-system +LPS, fraction +LPS versus media +LPS +DMSO). It is important to note that the differentially expressed genes list used for this analysis included genes that were significantly increased or decreased by respective treatments to identify pathways in which genes may function to induce or block a pathway of interest. Pathways significantly affected only by the fraction and fraction +LPS included terpenoid, and steroid biosynthesis (p-value <0.05). Additionally, pyrimidine biosynthesis was enriched (p-value <0.07). Pathways that may be important for the activity of both the 4-component-system and the fraction in LPS-stimulated conditions were eicosanoid biosynthesis and JAK-STAT pathway (p-value <0.05), with an enrichment of the p38 MAPK pathway (p-value <0.07).
Table 4.
Analysis of ontological pathways identified as having an over-representation of differentially expressed genes under 4-component-system or fraction when compared to media +DMSO and 4-component-system +LPS and fraction +LPS when compared to media +LPS +DMSO. Enrichment score is the negative log of the p-value (* score >1.3 indicates p-value <0.05). Enrichment scores represents genes with increased and decreased expression levels combined. aFraction and 4-component-system compared to media + DMSO. bFraction + LPS and 4-component-system + LPS compared to media + LPS + DMSO. Number of genes per pathway in accordance with DAVID 2007.
| Differentially expressed gene list that was used for ontological analysis | Pathway | enrichment score | % differentially expressed genes/pathway | # genes affected by 4-component-systema | # genes affected by fractiona | # genes affected by 4-component-system +LPSb | # genes affected by fraction +LPSb |
|---|---|---|---|---|---|---|---|
| Genes that had significantly increased and decreased expression levels by fraction, fraction +LPS, and 4-component-system +LPS | Eicosanoid biosynthesis | 1.68* | 37.5 | 0 | 4 | 6 | 6 |
| JAK-STAT | 1.59* | 16.7 | 0 | 8 | 8 | 13 | |
| p38 MAPK | 1.2 | 13.3 | 0 | 8 | 4 | 7 | |
| B cell receptor | 0.7 | 7.9 | 0 | 7 | 5 | 8 | |
| T cell receptor | 0.9 | 6.5 | 1 | 6 | 3 | 6 | |
| Genes that had significantly increased and decreased expression levels by fraction, fraction +LPS | Terpenoid biosynthesis | 5.42* | 60 | 0 | 3 | 0 | 3 |
| Steroid biosynthesis | 5.13* | 43.8 | 0 | 7 | 0 | 7 | |
| Pyrimidine biosynthesis | 1.2 | 19 | 0 | 7 | 0 | 3 | |
| Inositol phosphate metabolism | 0.9 | 13.3 | 0 | 5 | 1 | 6 | |
Figure 2 shows the expression levels of intersections of key genes that were differentially expressed by fraction and 4-component-system, fraction +LPS and 4-component-system +LPS, and fraction +LPS and 4-component-system +LPS and fraction. The effect of the fraction is included because the fraction affected 32 of the 44 genes that were affected by both fraction +LPS and 4-component-system +LPS. Twelve of the 44 differentially expressed genes by fraction +LPS and 4-component-system +LPS as compared to media +LPS +DMSO were not affected by the fraction as compared to media +DMSO, suggesting that these genes might be of particular interest in LPS-stimulated cells treated with the fraction and 4-component-system. Of the 12 genes affected by both fraction +LPS and 4-component-system +LPS, only 2 were not affected in the same direction by fraction and fraction +LPS when compared to media +DMSO and media +LPS +DMSO, respectively. These were the cysteinyl leukotriene receptor 1 and granulocyte-macrophage colony stimulating factor 2. Interestingly, no uncharacterized cDNAs or expressed sequence tags were identified in the intersection of the fraction +LPS or 4-component-system +LPS, suggesting that the pathways of particular importance for the activity are well-characterized. These differentially expressed genes can be divided into three main groups: eicosanoid biosynthesis, JAK-STAT pathway, and type 1 interferon response.
Table 5 represents quantitative real-time PCR (qRT-PCR) analysis of expression levels of genes differentially expressed under the different treatment conditions in the microarray experiment at 8 hours when compared against the appropriate control, either media +DMSO or media +LPS +DMSO. The expression levels of 9 genes were confirmed by qRT-PCR (COX-2, PLCβ1, SOCS3, JAK2, STAT3, STAT1, PIK3, ITK, COX-1) with 8 of the 9 confirming results from the microarray. JAK2 gene expression levels were significantly decreased by 4-component-system +LPS and fraction +LPS which confirmed the results from the microarray, but JAK2 expression levels were also significantly decreased by fraction in the qRT-PCR analysis, and this decrease was not observed in the microarray.
Table 5.
Quantitative real-time PCR analysis of the expression levels of 9 genes at the 8 hour time point. Data represented as change in expression level over respective control, media +DMSO or media +LPS +DMSO, for direct comparison with data from the microarray. * Data with an asterisk indicates that the gene expression was significantly different than control in the microarray analysis. aconfirmed microarray data with decreases in JAK2 gene expression by fraction +LPS and 4-component-system +LPS but qRT-PCR analysis also detected a decrease in JAK2 gene expression by the fraction that was not detected in the microarray. N=3 for each. * p-value <0.05 as compared to respective control, either media +DMSO or media +LPS +DMSO
| Gene | 4-component-system | Fraction | 4-component-system +LPS | Fraction +LPS |
|---|---|---|---|---|
| COX-2 | 0.2 ± 0.2 | 0.2 ± 0.1 | -0.8 ± 0.06* | -0.9 ± 0.1* |
| PLCβ1 | 0.2 ± 0.2 | 0.2 ± 0.2 | 2.7 ± 0.5* | 5.5 ± 0.2* |
| SOCS3 | 0.05 ± 0.3 | 0.01 ± 0.3 | 1.7 ± 0.3* | 2.6 ± 0.2* |
| JAK2 | 0.01 ± 0.06 | -1.6 ± 0.2*a | -1.8 ± 0.2* | -1.8 ± 0.1* |
| STAT3 | 0.09 ± 0.4 | -0.04 ± 0.4 | 1.5 ± 0.07* | 1.8 ± 0.08* |
| STAT1 | 0.03 ± 0.2 | -0.9 ± 0.2* | -0.09 ± 0.3 | -0.9 ± 0.06* |
| PIK3 | 0.1 ± 0.1 | 2.0 ± 0.1* | 0.08 ± 0.1 | 2.8 ± 0.05* |
| ITK | 0.4 ± 0.05* | 0.4 ± 0.1* | -0.07 ± 0.3 | 0.2 ± 0.2 |
| COX-1 | 0.06 ± 0.08 | -0.07 ± 0.09 | -0.04 ± 0.08 | 0.05 ± 0.09 |
Since a more stringent FDR was not able to detect differences among the sub-fraction +LPS and 4-component-system +LPS when compared to media +LPS +DMSO control, we used hierarchical cluster analysis as another tool to explore the relationship among genes visually and to confirm the findings of the initial analysis. Hierarchical clustering is shown in Figure 3. Three main clusters and 7 sub-clusters were identified from the list of differentially expressed genes, but the general expression pattern confirmed the analysis as seen in Figure 1. In general, the 4-component-system treatments clustered more similarly with DMSO treatments than with fraction treatments (Figure 3A). Individual sub-clusters are shown in both Figure 3A and 3B to emphasize patterns found within the hierarchical clustering analysis. The genes in sub-cluster A1 show that fraction had lower expression levels compared to the 4-component-system and media + DMSO control. The pattern was consistent for both LPS-stimulated and non-stimulated treatments. The genes in sub-cluster B1 show increased expression levels for the fraction, but no change in expression levels for the 4-component-system when compared to media + DMSO control. Sub-cluster B2 and cluster C show genes that have similar expression for the fraction and 4-component-system when compared to the media +DMSO control, both with and without LPS. In both sub-cluster B2 and cluster C, the expression levels of genes were in opposite directions for the treatments with LPS and those without LPS. Sub-cluster B2 and cluster C clearly highlight the intersection of activity between the fraction and 4-component-system. Clustering analysis confirmed that the 10 differentially expressed genes highlighted during the initial analysis appeared in sub-cluster B2 (JAK2, STAT3, PLXNB2, RAB2) and cluster C (COX-2, SOCS3, PLCβ1, TLR3, TXAS1, IκBα) and emphasized the importance of the JAK-STAT pathway as a target of H. perforatum.
Figure 3.
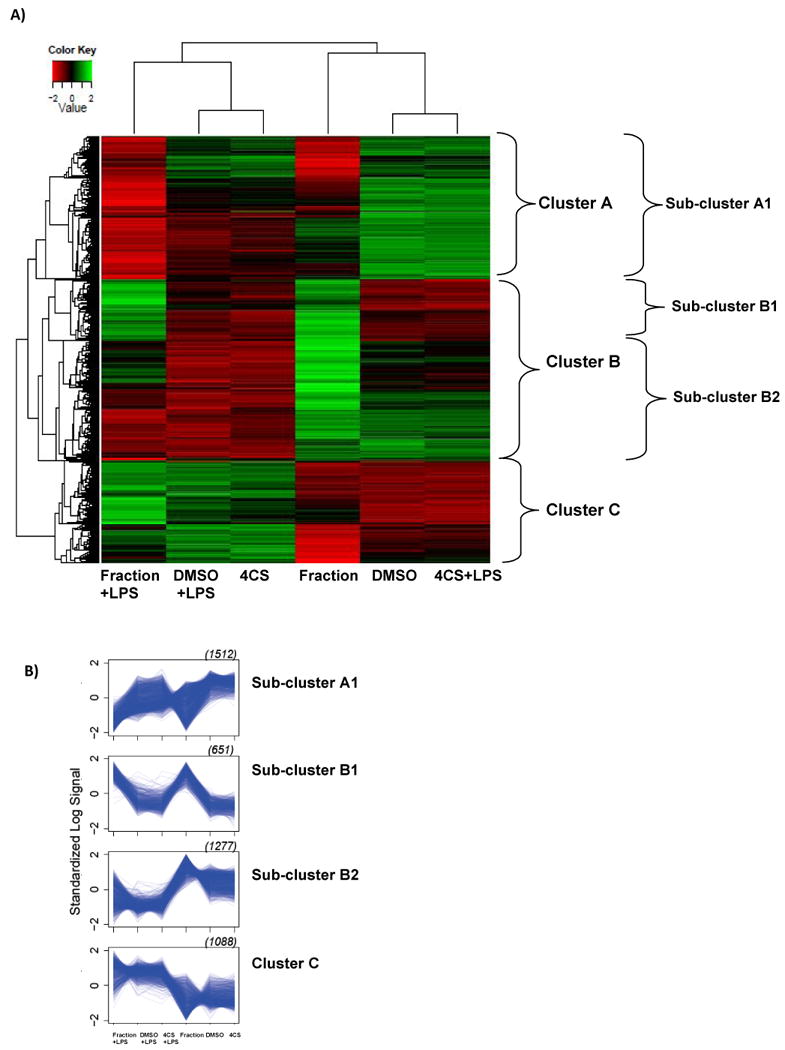
A) Hierarchical cluster analysis of differentially expressed genes in RAW 264.7 macrophages treated with or without LPS and with either an H. perforatum sub-fraction or 4-component-system. 4,536 differentially expressed genes were determined as described in the Methods section. The heatmap is arranged with genes as rows and treatments as columns. Green represents above average expression levels and red represents below average expression levels. Based on the largest average silhouette width, three main clusters were determined with 7 sub-clusters: cluster A with 1,517 genes (sub-clusters A1 with 1,523 genes, A2 with 2 genes, A3 with 3 genes), cluster B with 1,931 genes (sub-clusters B1 with 651 genes, B2 with 1,277 genes, B3 with 3 genes), and cluster C with 1,088 genes (could not be broken down into sub-clusters based on the analysis). All 3 clusters are shown on figure 3A and 4 of the 7 sub-clusters (A1, B1, B2, cluster C) are also shown. Sub-clusters A2, A3, and B3 are not shown due to small size (2, 3, and 3 genes, respectively) but were embedded in their respective clusters (A, A, and B) on the heat map. B) Standardized log signal for 4 of the 7 sub-clusters identified in the analysis represents changes in expression level with different treatment groups. The size of each cluster is given in parentheses on the right above the sub-cluster graph; three other sub-clusters A2, A3, and B3 with sizes of 2, 3, and 3 respectively are not presented. 4CS= 4-component-system, DMSO= media +DMSO control.
Since the microarray and qRT-PCR analysis was performed at only the 8 hour time point, and this time may not have been optimal for the genes identified, a time-course experiment was performed to determine if the fraction and 4-component-system had similar effects on the expression levels of key genes linked to the JAK-STAT pathway over the course of LPS-induced inflammation in RAW 264.7 mouse macrophages (Figure 4). Each of the 6 genes presented showed differential induction of gene expression by LPS at 0.5, 1, 2, 4, 8, or 24 hours when compared against the media control at time point 0. Expression levels for fraction +LPS and 4-component-system +LPS were compared against the expression levels of media +LPS +DMSO at each respective time point. STAT3 gene expression was increased by both treatments when compared to media +LPS +DMSO at 0.5 and 8 hours, but STAT1 gene expression was decreased by both treatments at 0.5 hours and decreased by the fraction +LPS at 8 hours when compared to media +LPS +DMSO at the respective time-points. JAK1 gene expression was increased by both treatments at 0.5 hours when compared to media +LPS +DMSO and conversely JAK2 gene expression was decreased by both treatments at 0.5 hours and 8 hours when compared to media +LPS +DMSO at the respective time-points. Additionally, two genes were tested that can be linked to the JAK-STAT and eicosanoid pathways. SOCS3 gene expression was increased by fraction +LPS at 1 hour and by fraction +LPS and 4-component-system +LPS at 8 hours when compared to media +LPS +DMSO at the respective time-points. COX-2 gene expression was decreased by both treatments at 1, 2, and 8 hours when compared to media +LPS +DMSO at the respective time-point.
Figure 4.

Time-course gene expression analysis (0.5, 1, 2, 4, 8, and 24 hours after treatment) using real-time quantitative PCR of genes involved in inflammation. Data represented as change in expression level of transcript abundance compared to media control at time point 0. Media +LPS +DMSO treatment time-points that do not share common italicized letters are significantly different with a <b <c (p-value <0.05) as compared to time point 0 media control expression level of the respective gene. * Data with an asterisk indicates that the gene expression level for the treatment (fraction +LPS or 4-component-system +LPS) was significantly different than media +LPS +DMSO control for the respective time-point with a p-value <0.05. N=3 for each.
5. Discussion
LPS stimulation in macrophages has been shown to affect numerous genes in inflammation. Wells et al. (2003) identified functional classes of LPS-inducible genes in LPS-treated primary bone marrow-derived macrophages including; endocytosis, phagocytosis, cell signaling (18% of the differentially expressed genes), antigen presentation (10%), and cytokine or chemokine (4%) classes. Ravasi et al. (2002) examined LPS-inducible sub-clones of RAW 264.7 mouse macrophages using cDNA microarrays and TNF-α was not induced in all sub-clones. Clustering revealed genes that were likely to be co-expressed in sub-clones and ontology analysis showed that these were generally regulatory or immune system genes. Shen et al. (2006) found up-regulated expression of COX-2, SOCS IκBα, JAK2, STAT1, and PLC in LPS-treated peritoneal macrophages. LPS treatment of THP-1 macrophages significantly affected the expression of 72 of 465 genes (15.4%) including COX-2, IκBα, and TNF-α (Sharif et al., 2007). Similarly, we found increases in the gene expression levels of COX-2, SOCS3, JAK2, STAT1, and PLCβ1 at early time points in RAW 264.7 cells treated with LPS. Bjorkbacka et al. (2004) found that 1,055 of 13,000 probe-sets (8.1%) in LPS-treated mouse macrophages were LPS responsive. Finally, Huang et al. (2008) studying LPS-treated RAW 264.7 mouse macrophages for 6 hours, observed 1,270 LPS responsive genes (3.9 %) with a 2-fold change. Similarly, we found 5,071 genes were LPS responsive (11.2 %) in the LPS-treated RAW 264.7 macrophages at 8 hours and 2,359 (5.2%) genes had expression levels of transcript abundance at least 50% above or 50% below the control expression levels. It is important to note the 8 hour time point was chosen based on our earlier studies (Hammer et al., 2007; Hammer et al., 2008) but it would probably not be optimal for cytokines and chemokines that may also be modulated by these treatments.
The cytotoxicity of H. perforatum extracts has been well-established in cell culture models (Hostanska et al., 2002; Schmitt et al., 2006). Although the H. perforatum fraction and 4-component-system did not significantly decrease cell viability in the RAW 264.7 macrophages at concentrations tested here (Hammer et al., 2008), these treatments may affect genes related to cytotoxicity. Fraction and fraction +LPS increased expression of genes that were grouped into gene ontology classes such as cell cycle and apoptosis when compared against respective controls, and the genes may be related to the previously documented toxicity of H. perforatum. Another bioactivity relevant for this study is anti-viral activity, since one of the pathways that was discovered in the intersection of differentially expressed genes from fraction +LPS and 4-component-system +LPS was a type I interferon response.
Differentially expressed genes essential for PGE2 production, used to screen H. perforatum extracts and fractions, included COX-2, PLCβ1, TXAS1, and CYSLTR1. COX-2 gene expression was decreased by the 4-component-system +LPS and fraction +LPS. Additionally, COX-2 gene expression was decreased by both fraction +LPS and 4-component-system +LPS at 1, 2, and 8 hours; confirming previous data from our laboratory showing inhibition of PGE2 production and COX-2 enzyme activity with fraction +LPS and 4-component-system +LPS (Hammer et al., 2008) and validating that the primary genes involved have been identified. However, since the PGE2 screen had been set up to identify H. perforatum extracts and fractions that inhibited this pathway when LPS was added, these results were predictable.
JAK-STAT is important in cytokine and growth factor signaling in inflammation and can be linked to eicosanoid pathways (Rawlings et al., 2004). Genes in this pathway that were differentially expressed include STAT1, STAT3, JAK2, GM-CSF2, and SOCS3. STAT1-responsive genes may promote inflammation and antagonize proliferation and STAT1 was necessary for the macrophage response to LPS (Kamekazi et al., 2004; Ohmori and Hamilton, 2001) whereas STAT3 targeted genes may promote proliferation and antagonize inflammation (Schindler et al., 2007). STAT1 gene expression was significantly decreased by fraction +LPS and fraction when compared against controls in the microarray. STAT3 gene expression was increased by the 4-component-system +LPS and fraction +LPS suggesting that the 4-component-system may act in the same way as the fraction to antagonize inflammation by increasing STAT3 expression. In the time-course analysis, STAT1 gene expression was decreased by fraction +LPS and 4-component-system +LPS at 0.5 hours and STAT3 gene expression was increased by both at 0.5 hours and 8 hours when compared to media +LPS +DMSO at the respective time-points. Both STAT1 and STAT3 expression levels were increased over 0-time at 0.5 and 1 hours, confirming Liu et al. (2005) in which expression of STAT1 and STAT3 were increased in peritoneal macrophages by LPS.
Janus kinases (JAKs) are regulators of the JAK-STAT pathway and JAK2 was phosphorylated immediately after LPS stimulation in RAW 264.7 macrophages via TLR4 (Okugawa et al., 2003). SOCS proteins can antagonize STAT activation by feedback inhibition and ERK, JNK, and p38 pathways, in addition to STAT3, are involved in SOCS3 gene expression (Qin et al., 2007). JAK2 gene expression was decreased by the 4-component-system +LPS and fraction +LPS in the microarray. SOCS3 gene expression was increased by the 4-component-system +LPS and fraction +LPS, suggesting that the JAK-STAT pathway may be modulated by decreasing JAK2 transcript abundance and increasing feedback inhibition through increased SOCS3 gene expression. In the time course, JAK1 expression levels were increased by fraction +LPS and 4-component-system +LPS at 0.5 hours and JAK2 expression levels were decreased by fraction +LPS and 4-component-system +LPS at 0.5 and 8 hours. Similarly, Liu et al. (2005) showed that JAK2 expression was increased within 2 hours of stimulation in peritoneal macrophages. Additionally, LPS-induced SOCS3 gene expression was detected at 0.5 hours in macrophages, with maximum stimulation between 8 and 16 hours and expression levels returning to un-stimulated levels by 36 hours (Qin et al., 2007). Time course results showed that SOCS3 gene expression was increased at 0.5, 1, 8, and 24 hours when compared to 0-time. SOCS3 expression levels were increased by fraction +LPS and 4-component-system +LPS at 8 hours and increased by fraction +LPS at 1 and 24 hours.
In the qRT-PCR time course analysis, fraction +LPS and 4-component-system +LPS affected the expression levels of STAT1, JAK1, JAK2, and COX-2 in a similar manner throughout the treatment. However, fraction +LPS appeared to increase the expression levels of some genes more than 4-component-system +LPS in the time course (STAT3 at 0.5, 1, and 8 hours, and SOCS3 at 0.5, 1, 8, and 24 hours) suggesting that additional constituents in the fraction may impact these genes.
Cross-talk between the JAK-STAT and eicosanoid biosynthesis pathways at multiple levels is likely mediated by MAPK (Rawlings et al., 2004). Kovarik et al. (1998) showed that LPS caused phosphorylation of STAT1 on serine 727 requiring p38 MAPK, but not MAPKAP-2. JAK2 was not necessary for the phosphorylation of STAT1 and activated JAK2 alone was not sufficient for phosphorylation. Additionally, SOCS3 can bind to RasGAP, negative regulator of Ras, and reduce its activity, which would reduce the activity of the MAPK. Thus, SOCS3 activation may also link JAK-STAT and MAPK.
Numerous mechanisms may be important for the synergism of the 4 compounds and for their impacts on gene expression. Based on literature about interactions of constituents in H. perforatum, it is possible that one constituent could aid in the absorption of another key constituent in the H. perforatum fraction. For example, quercetin or amentoflavone could increase the bioavailability of pseudohypericin since similar results have been observed with hypericin (Butterweck et al., 2003) Another potential mechanism would be that quercetin, amentoflavone, or chlorogenic acid may reduce the phototoxicity produced by light-activated pseudohypericin by decreasing reactive oxygen species or free radical quenching (Wilhelm et al., 2001; Schmitt et al., 2006b), thus enabling us to identify anti-inflammatory activity. As far as these constituents targeting selected genes that are important in inflammation, it is possible that these compounds impact phosphorylation and dephosphorylation events that regulate the complex interplay of gene expression. Further studies will be required to define the cellular mechanism of the four constituents.
6. Conclusions
The expression levels of genes affected by the 4-component-system explained some of the fraction's PGE2 production activity, specifically COX-2 appeared as a major target for both the fraction and 4-component-system in LPS-stimulated conditions. Additionally, upstream pathways leading to COX-2 expression are affected by both treatments. The JAK-STAT pathway was identified as important for the activity of H. perforatum. Specifically, the defined 4-component-system and fraction had similar effects on key JAK-STAT pathway genes. However, it should be noted that the fraction was far more active than the 4-component-system in both LPS-treated and untreated groups.
The limitations of the microarray study include one cell line being studied at one time point. Thus, a time-course was performed to determine the role of the 4-component-system in the activity of the fraction through the inflammatory response to LPS. Another limitation is that an increased FDR was used for the 4-component-system treatments because it did not affect the expression levels of many genes at a more stringent FDR. However, hierarchical clustering confirmed that the initial analysis identified relevant differentially expressed genes and pathways. Future experiments will explore the impact of H. perforatum fractions and extracts on phosphorylation status and DNA-binding activities of JAK-STAT proteins.
Acknowledgments
This publication was made possible by grant number 9P50AT004155-06 from the National Center for Complementary and Alternative Medicine (NCCAM) and Office of Dietary Supplements (ODS), National Institutes of Health (NIH) and P01 ES012020 from the National Institute of Environmental Health Sciences (NIEHS) and the ODS and NIH. Its contents are solely the responsibility of the authors and do not necessarily represent the official views of the NIEHS, NCCAM, or NIH.
Footnotes
Publisher's Disclaimer: This is a PDF file of an unedited manuscript that has been accepted for publication. As a service to our customers we are providing this early version of the manuscript. The manuscript will undergo copyediting, typesetting, and review of the resulting proof before it is published in its final citable form. Please note that during the production process errors may be discovered which could affect the content, and all legal disclaimers that apply to the journal pertain.
References
- Benjamini Y, Hochberg Y. Controlling the false discovery rate: a practical and powerful approach to multiple testing. Journal of the Royal Statistical Society: Series B. 1995;57:289–300. [Google Scholar]
- Bilia AR, Gallori S, Vincieri FF. St. John's wort and depression: Efficacy, safety and tolerability-an update. Life Sciences. 2002;70:3077–3096. doi: 10.1016/s0024-3205(02)01566-7. [DOI] [PubMed] [Google Scholar]
- Bjorkbacka H, Fitzgerald KA, Huet F, Li X, Gregory JA, Lee MA, Ordija CM, Dowley NE, Golenbock DT, Freeman MW. The induction of macrophage gene expression by LPS predominantly utilizes MyD88-independent signaling cascades. Physiological Genomics. 2004;19:319–330. doi: 10.1152/physiolgenomics.00128.2004. [DOI] [PubMed] [Google Scholar]
- Butterweck V, Lieflander-Wulf U, Winterhoff H, Nahrstedt A. Plasma levels of hypericin in presence of procyanidin B2 hyperoside: a pharmacokinetic study in rats. Planta Med. 2003;69:189–192. doi: 10.1055/s-2003-38495. [DOI] [PubMed] [Google Scholar]
- Coussens LM, Werb Z. Inflammation and cancer. Nature. 2002;420:860–867. doi: 10.1038/nature01322. [DOI] [PMC free article] [PubMed] [Google Scholar]
- Dennis G, Jr, Sherman BT, Hosack DA, Yang J, Gao W, Lane HC, Lempicki RA. DAVID: Database for Annotation, Visualization, and Integrated Discovery. Genome Biology. 2003;5:P3. [PubMed] [Google Scholar]
- Eisen MB, Spellman PT, Brown PO, Botstein D. Cluster analysis and display of genome-wide expression patterns. Proceedings of the National Academy of Sciences. 1998;95:14863–14868. doi: 10.1073/pnas.95.25.14863. [DOI] [PMC free article] [PubMed] [Google Scholar]
- Hammer KDP, Hillwig ML, Solco AKS, Dixon PM, Delate K, Murphy PA, Wurtele ES, Birt DF. Inhibition of PGE2 production by anti-inflammatory Hypericum perforatum extracts and constituents in RAW 264.7 mouse macrophage cells. Journal of Agricultural and Food Chemistry. 2007;55:7323–7331. doi: 10.1021/jf0710074. [DOI] [PMC free article] [PubMed] [Google Scholar]
- Hammer KDP, Hillwig ML, Neighbors JD, Sim YJ, Kohut ML, Wiemer DF, Wurtele ES, Birt DF. Pseudohypericin is necessary for the light-activated inhibition of prostaglandin E2 pathways by a 4-component-system mimicking an Hypericum perforatum fraction. Phytochemistry. 2008;69:2354–2362. doi: 10.1016/j.phytochem.2008.06.010. [DOI] [PMC free article] [PubMed] [Google Scholar]
- Hostanska K, Reichling J, Bommer S, Weber M, Saller R. Aqueous ethanolic extract of St. John's wort (Hypericum perforatum L.) induces growth inhibition and apoptosis in human malignant cell in vitro. Pharmazie. 2002;57(5):323–331. [PubMed] [Google Scholar]
- Huang H, Chang EJ, Lee Y, Kim JS, Kang SS, Kim HH. A genome-wide microarray analysis reveals anti-inflammatory target genes of paeonol in macrophages. Inflammation Research. 2008;57:1–10. doi: 10.1007/s00011-007-7190-3. [DOI] [PubMed] [Google Scholar]
- Kamekazi K, Shimoda K, Numata A, Matsuda T, Nakayama K, Harada M. The role of Tyk2, Stat1 and Stat4 in LPS-induced endotoxin signals. International Immunology. 2004;16:1173–1179. doi: 10.1093/intimm/dxh118. [DOI] [PubMed] [Google Scholar]
- Kovarik P, Stoiber D, Novy M, Decker T. Stat1 combines signals derived from IFN-gamma and LPS receptors during macrophage activation. The European Molecular Biology Organization Journal. 1998;17:3660–3668. doi: 10.1093/emboj/17.13.3660. [DOI] [PMC free article] [PubMed] [Google Scholar]
- Krusekopf S, Roots I. St. John's wort and its constituent hyperforin concordantly regulate expression of genes encoding enzymes involved in basic cellular pathways. Pharmacogenetics and Genomics. 2005;15:817–829. doi: 10.1097/01.fpc.0000175597.60066.3d. [DOI] [PubMed] [Google Scholar]
- Liu H, Yao YM, Dong YQ, Yu Y, Sheng ZY. The role of Janus kinase-signal transducer and transcription activator pathway in the regulation of synthesis and release of lipopolysaccharide-induced high mobility box-1 protein. Zhonghua Shao Shang Za Zhi. 2005;21:414–417. [PubMed] [Google Scholar]
- Ohmori Y, Hamilton TA. Requirement for STAT1 in LPS-induced gene expression in macrophages. Journal of Leukocyte Biology. 2001;69:598–604. [PubMed] [Google Scholar]
- Okugawa S, Ota Y, Kitazawa T, Nakayama K, Yanadimoto S, Tsukada K, Kawada M, Kimura S. Janus kinase 2 is involved in lipopolysaccharide-induced activation of macrophages. American Journal of Physiology-Cell Physiology. 2003;285:C399–408. doi: 10.1152/ajpcell.00026.2003. [DOI] [PubMed] [Google Scholar]
- Pfaffl MW. A new mathematical model for relative quantification in real-time RT-PCR. Nucleic Acids Research. 2001;29:2002–2007. doi: 10.1093/nar/29.9.e45. [DOI] [PMC free article] [PubMed] [Google Scholar]
- Ravasi T, Wells C, Forrest A, Underhill DM, Wainwright BJ, Aderem A, Grimmond S, Hume DA. Generation of diversity in the innate immune system: macrophage heterogeneity arises from gene-autonomous transcriptional probability of individual inducible genes. The Journal of Immunology. 2002;168:44–50. doi: 10.4049/jimmunol.168.1.44. [DOI] [PubMed] [Google Scholar]
- Rawlings JS, Rosler KM, Harrison DA. The JAK/STAT signaling pathway. Journal of Cell Science. 2004;117:1281–1283. doi: 10.1242/jcs.00963. [DOI] [PubMed] [Google Scholar]
- Rosen S, Skaletsky HJ. Primer3 on the WWW for general users and biologist programmers. In: Krawetz S, Misener S, editors. Bioinformatics Methods and Protocols: Methods in Molecular Biology. Humana Press; Totowa, NJ: 2000. pp. 365–386. Source code available at http://primer3.sourceforge.net/ [DOI] [PubMed] [Google Scholar]
- Sharif O, Bolshakov VN, Raines S, Newham P, Perkins D. Transcriptional profiling of the LPS induced NK-κB response in macrophages. BioMed Central Immunology. 2007;8(1):1–17. doi: 10.1186/1471-2172-8-1. [DOI] [PMC free article] [PubMed] [Google Scholar]
- Schindler S, Levy DE, Decker T. JAK-STAT signaling: From interferons to cytokines. Journal of Biological Chemistry. 2007;282(28):20059–20063. doi: 10.1074/jbc.R700016200. [DOI] [PubMed] [Google Scholar]
- Shen J, Reis J, Morrison DC, Papasian C, Raghavakaimal S, Kolbert C, Qureshi AA, Vogel SN, Qureshi N. Key inflammatory signaling pathways are regulated by the proteasome. Shock. 2006;25(5):472–484. doi: 10.1097/01.shk.0000209554.46704.64. [DOI] [PubMed] [Google Scholar]
- Storey JD, Tibshirani R. Statistical significance for genomewide studies. Proceedings of the National Academy of Sciences. 2003;100:9440–45. doi: 10.1073/pnas.1530509100. [DOI] [PMC free article] [PubMed] [Google Scholar]
- Schmitt LA, Liu Y, Murphy PA, Birt DF. Evaluation of the light-sensitive cytotoxicity of Hypericum perforatum extracts, fractions, and pure compounds. Journal of Agricultural and Food Chemistry. 2006a;54:2881–2890. doi: 10.1021/jf052344k. [DOI] [PMC free article] [PubMed] [Google Scholar]
- Schmitt LA, Liu Y, Murphy PA, Petrich JW, Dixon PM, Birt DF. Reduction in hypericin-induced phototoxicity by Hypericum perforatum extracts pure compounds. J Photochem Photobiol B. 2006b;85(2):118–130. doi: 10.1016/j.jphotobiol.2006.06.001. [DOI] [PMC free article] [PubMed] [Google Scholar]
- Upton E. St. John's wort: Hypericum perforatum. American Herbal Pharmacopoeia and Therapeutic Compendum. American Herbal Pharmacopoeia. 1997;95:14863–14868. [Google Scholar]
- Wells CA, Ravasi T, Sultana R, Yagi K, Carninci P, Bono H, Faulkner G, Okazaki Y, Quackenbush J, Hume DA, Lyons PA. Continued discovery of transcriptional units expressed in cells of the mouse mononuclear phagocyte lineage. Genome Research. 2003;13:1360–1365. doi: 10.1101/gr.1056103. [DOI] [PMC free article] [PubMed] [Google Scholar]
- Wilhelm KP, Biel S, Siegers CP. Role of flavonoids in controlling the phototoxicity of Hypericum perforatum extracts. Phytomedicine. 2001;8(4):306–9. doi: 10.1078/0944-7113-00042. [DOI] [PubMed] [Google Scholar]
- Qin H, Roberts KL, Niyongere SA, Cong Y, Elson CO, Benveniste EN. Molecular mechanism of lipopolysaccharide-induced SOCS-3 gene expression in macrophages and microglia. Journal of Immunology. 2007;179(9):5966–76. doi: 10.4049/jimmunol.179.9.5966. [DOI] [PubMed] [Google Scholar]