Abstract
We have previously developed a dual-energy digital mammography (DEDM) technique for calcification imaging under full-field imaging conditions using a commercially available flat-panel based digital mammography system. Although dual-energy (DE) imaging could suppress the obscuration of calcifications by tissue-structure background, it also increases the intrinsic noise in the DE images. Here we report on the effects of three different noise reduction techniques on DE calcification images: a simple smoothing (boxcar) filter applied to the DE image, a median filter applied to the HE image prior to the computation of the DE image and an adaptation of the Kalender’s correlated-noise reduction (KNR) technique for DEDM. We compared the different noise reduction techniques by evaluating their effects on DE calcification images of a 5 cm thick breast-tissue-equivalent slab with continuously varying glandular-tissue ratio superimposed with calcium carbonate crystals of various sizes that simulate calcifications. Evaluations of different noise reducing techniques were performed by comparison of the root-mean-square signal in background regions (no calcifications present) of the DE calcification images and the contrast-to-noise ratios (CNR) of the calcifications in the DE calcification images. Amongst the different noise reduction techniques evaluated in this study, the KNR method was found to be most effective in reducing the image noise and increasing the calcification visibility (or CNR), closely followed by the HE median filter technique. Although the simple smoothing (boxcar) filter reduced the noise, it did not improve calcification visibility. The visible calcification threshold size with DEDM over smoothly varying background at screening mammography doses, assuming a CNR threshold of 4, was estimated to be around 250 μm with both the HE median filter and the KNR techniques. The quality of DE images with noise reduction techniques based on phantom studies were verified with DE images of an animal-tissue phantom that consisted of calcifications superimposed over more realistic tissue structures.
1. Introduction
Breast cancer screening and diagnosis rely on the detection and visualization of calcifications and/or soft-tissue masses on mammography. However, depending upon their size and location, the visualization of calcifications in mammograms may be limited by the superimposed anatomical structures even when the calcifications have adequate contrast-to-noise ratio (CNR). This is similar to the anatomical limitations for the detection of subtle lung nodules in chest radiographs (Revesz et al 1974, Samei et al 1999, Lai et al 2005). The tissue-structure background in mammographic images arises from the differences in x-ray attenuation between adipose (fat) tissue, glandular tissue, ducts, vessels and soft-tissue masses in the breast. One potential method to address the problem of overlapping anatomical structures is by using dual-energy digital mammography (DEDM) (Alvarez and Macovski 1976, Brody et al 1981, Lehmann et al 1981, Johns and Yaffe 1985, Brettle and Cowen 1994, Kappadath and Shaw 2005). DEDM involves acquiring two mammograms of the breast using x-rays at two different kVp values to exploit the difference in x-ray attenuation between different materials at different x-ray energies. By combining the low-energy (LE) and high-energy (HE) images, the contrast between the adipose and the glandular tissues (tissue-structure background) may be reduced in the DE images with enhanced visualization of calcifications.
We have developed a DEDM technique under full-field imaging conditions using a commercially available flat-panel based digital mammography system (Lemacks et al 2002, Kappadath and Shaw 2003, 2004, 2005, Kappadath et al 2004, 2005). The total entrance-skin exposure and mean-glandular dose from the LE and HE images, a limiting factor for the dual-energy (DE) image noise, were constrained to screening-examination levels. A calibrated nonlinear mapping function was used to generate the DE calcification images from the separately acquired LE and HE images (Kappadath and Shaw 2003). Because scatter contamination in the LE and HE images can lead to erroneous calculations of the DE signals (Kappadath and Shaw 2004), the single-energy images were corrected for both scatter and non-uniformity in the x-ray field and detector response prior to the computation of the DE images (Kappadath and Shaw 2005).
Although DE imaging suppressed the tissue-structure background, it also increased the DE image noise (Lemacks et al 2002, Kappadath and Shaw 2004, Kappadath et al 2005, Brandan and Ramirez 2006). Noise reduction strategies have been investigated to counteract the increase in DE image noise (Johns et al 1985, Kalender et al 1988, Warp and Dobbins 2003). The most fundamental noise reduction strategy, both computationally and theoretically, is the application of a simple smoothing (boxcar) filter, suggested by Rutherford et al (1976) for DE computed tomography images. Johns et al (1985) extended the idea to DE mammography by smoothing only the HE image. Kalender et al (1988) developed a correlated-noise reduction algorithm for DE computed tomography that exploited the correlation between the noise components in the two complementary DE material density images. Ergun et al (1990) adapted the KNR technique for noise reduction in single-exposure DE computed radiography images, while McCollough et al (1989) adapted the KNR technique for noise reduction in DE digital subtraction angiography. Other methods proposed for noise reduction in DE images, in the context of DE chest radiography, include iterative noise reduction (Ito et al 1993, Kido et al 1995), noise forcing (Hinshaw and Dobbins 1995) and noise clipping (Hinshaw and Dobbins 1995). However, only the simple smoothing of the HE image (Johns et al 1985) has been evaluated as a noise reducing algorithm specifically for DE mammography.
In this paper, we report on the effects of three different noise reduction techniques for DE calcification images: (1) a simple smoothing (boxcar) filter applied to the DE image, (2) a median filter applied to the HE image prior to the computation of the DE image and (3) an adaptation of the KNR technique for DEDM. We compared the different noise reduction techniques by evaluating their effects on DE calcification images of a breast-tissue-equivalent slab with continuously varying glandular ratio (defined as the ratio of glandular-tissue thickness to total tissue thickness) superimposed with calcium carbonate (CaCO3) crystals of various sizes that simulate calcifications. Since the calcification signal have high spatial frequency content, techniques to reduce image noise might also inadvertently decrease the calcification contrast. The evaluation of different noise reducing techniques were performed using the following two image quality metrics: (1) the root-mean-square (rms) signal in regions of the DE calcification images with no calcifications present (image noise) and (2) the CNR of the calcifications in the DE calcification images. The effects of different noise reduction techniques were demonstrated on the DE calcification image of an animal-tissue phantom that consisted of calcifications superimposed over the tissue-structure background.
2. Materials and methods
2.1. DEDM formalism
The DEDM formalism used in this work draws upon that already defined in a previous work (Kappadath and Shaw 2005). A breast of thickness T can be considered to be composed of three materials: adipose tissue (thickness ta), glandular tissue (thickness tg) and calcifications (thickness tc). Ideally, one would like to know the thickness of each of the three materials on a pixel-by-pixel basis over the entire image. During mammography, the breast is usually compressed to a largely uniform thickness that can be easily measured. With the total thickness (T) known, the two unknown parameters are the glandular ratio [gr = tg/(ta + tg)], and the calcification thickness (tc). The log-signal function, D(gr, tc ), defined as the logarithm of the ratio of the reference (unattenuated) signal to the transmitted signal and a measure of the average attenuation of the x-ray spectrum weighted by the detector response, can be written as
| (1) |
where S0 is the unattenuated reference signal, S is the transmitted signal and Q(E) is the detector response. The variance of the log-signal, , is given by
| (2) |
where σs and σs0 are the measured rms fluctuations in the image and reference signals, respectively.
In DE imaging, we measure a HE log-signal image, Dh(gr, tc ), independent of the LE log-signal image, Dl (gr, tc ), by using x-ray beams of different spectra (or different kVp). The goal of DE imaging is to invert the measured log-signal images, Dl (gr, tc ) and Dh(gr, tc ), into maps of calcification thickness, tc (Dl, Dh) and/or glandular ratio, gr (Dl, Dh). It has been shown that a cubic inverse-mapping function, described by
| (3) |
where the coefficients of the cubic function, ci, were determined from separately acquired calibration data, could adequately model the calcification thickness and the glandular ratio as a function of the LE and the HE log-signal images (Kappadath and Shaw 2003). Scatter radiation and spatial variations of the x-ray field and the detector response intrinsic to full-field image acquisition, ignored in the above formalism may introduce nonuniformity in the measured images. Therefore, the full-field images were corrected for scatter and nonuniformity prior to the calculation of the log-signal and DE calcification images (Kappadath and Shaw 2005). The nonuniformity was corrected by normalizing the LE and HE images with full-field reference images during the calculation of the log-signal images. The pinhole-array interpolation method (Wagner et al 1988, Maher 2001) was used to estimate the scatter signal in the LE and HE images.
2.2. Phantom images
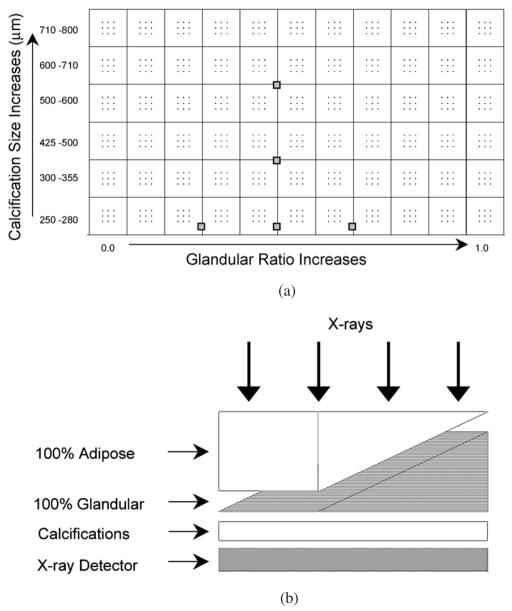
The calcification phantom (figure 1(a)) was constructed by placing 66 calcification clusters in an 11 × 6 grid on clear film. Each cluster consisted of nine CaCO3 crystals (Computerized Imaging Reference Systems (CIRS), Inc., Norfolk, VA) used to simulate calcifications in a 3 × 3 pattern. The CaCO3 crystals were organized by size into six rows with nominal size ranges (provided by CIRS) of 250–280, 300–355, 425–500, 500–600, 610–710 and 710–800 μm. The cluster size varied along the shorter side (cathode–anode axis) but not along the longer (chest wall) side. The wedge phantom (figure 1(b)) was constructed by stacking two wedges (22 × 14 cm2 and a triangular taper from 5 to 0 cm) of breast-tissue-equivalent materials (CIRS), one of 100% adipose and the other of 100% glandular tissue. The resulting rectangular slab had a fixed thickness of 5 cm with fixed glandular ratio along the shorter side (cathode–anode axis) and continuously varying glandular ratio along the longer side from 0% to 100% glandular ratio. The wedge calcification phantom was constructed by placing the calcification phantom under the wedge phantom. The combination (figure 1(b)) resulted in a 5 cm thick rectangular slab with continuously varying glandular ratio and fixed calcification size along the longer (chest wall) side and with fixed glandular ratio and varying calcification size along the shorter side.
Figure 1.
(a) The calcification phantom with 66 calcification clusters arranged in an 11 × 6 grid on clear film. Each cluster consisted of nine CaCO3 crystals in a 3 × 3 pattern. The gray boxes indicate the schematic location of the 5 ROIs for the relative noise analysis of table 1. (b) The arrangement of the two wedge shaped breast-tissue-equivalent blocks (100% adipose and 100% glandular tissue) with the calcification phantom to make the wedge calcification phantom for imaging. The combination resulted in a 5 cm thick rectangular slab with continuously varying glandular ratio and fixed calcification size along the longer side and with fixed glandular ratio and varying calcification size along the shorter side.
2.3. Construction of the DE calcification images
A commercially available full-field digital mammography system (Senographe 2000D, General Electric Medical Systems, Milwaukee, WI) which uses an aSi:H flat-panel detector coupled with a CsI:Tl converter layer, was used in our experiments (Vedantham et al 2000). The image size is 1918 × 2294 pixels with 100 μm pixels. The long axis of the image lies along the chest-wall side, orthogonal to the cathode–anode axis. The LE and HE techniques used for the image acquisitions were 28 kVp at 50 mAs and 49 kVp at 11 mAs, respectively, both with the Rh anode and Rh filter. The mean-glandular dose (MGD) to a 5 cm thick breast-tissue-equivalent material of glandular ratio 50% for the LE and the HE x-ray techniques were ~ 1.1 and ~1.4 mGy, respectively, with a total MGD at typical screening-examination levels. The rationale for the above-mentioned choices of LE and HE spectra have been described previously (Kappadath and Shaw 2005).
The methodology used to compute DE calcification images under full-field imaging conditions have also been described previously in detail (Kappadath and Shaw 2005). Briefly, the full-field and pinhole-array images of the wedge calcification phantom were acquired with the DE x-ray techniques. Next, the full-field and pinhole-array images of a 5 cm thick 22 × 14 cm2 slab of breast-tissue-equivalent material phantom with a glandular ratio of 50% were acquired and the reference images were constructed. The scatter signals were estimated and subtracted from the LE and HE phantom and reference images. The scatter-corrected reference and phantom images were used to compute the nonuniformity corrected LE and HE log-signal images on a pixel-by-pixel basis. Finally, the scatter and nonuniformity corrected LE and HE log-signal images together with the calibrated cubic inverse-mapping function were used to compute the DE calcification image on a pixel-by-pixel basis (Kappadath and Shaw 2005). The location of the pinholes used to estimate scatter did not completely cover the two peripheral columns of calcification clusters rendering only 9 × 6 useable calcification clusters.
2.4. Noise reduction techniques
We investigated the effects of three different noise reduction techniques for DE calcification images: (1) a simple smoothing (boxcar) filter applied to the DE calcification image, (2) a median filter applied to the HE image prior to the computation of the DE image and (3) an adaptation of the KNR technique for DE calcification imaging. The unprocessed DE calcification image is referred to as the standard DE calcification image (DE-STD).
2.4.1. Boxcar filter
The most fundamental noise reduction technique, both computationally and theoretically, is the application of a simple boxcar filter. The boxcar filter returns the input DE calcification image smoothed with a two-dimensional boxcar average with a specified kernel as follows:
| (4) |
where w is the kernel size of the boxcar filter and is the processed DE calcification image. Three different kernel sizes of 3, 5 and 7 pixels were studied. The boxcar filtered DE calcification images are identified using the nomenclature: DE-BF-x, where x represents the kernel size of the boxcar filter.
2.4.2. HE median filter
Johns et al (1985) extended the boxcar filtering to DE mammography by smoothing only the HE image. We have modified their method by smoothing the HE image via a median filter to construct the DE calcification images as follows:
| (5) |
where w is the kernel size of the median filter and is the median filtered HE log-signal image. Three different kernel sizes of 3, 5 and 7 pixels were studied. The HE median filtered DE calcification images are identified using the nomenclature: DE-HEMF-x, where x represents the kernel size of the median filter.
2.4.3. Kalender’s noise reduction (KNR) technique
Kalender et al (1988) developed a noise reduction algorithm for DE computed tomography that exploited the known (anti-) correlation between the noise components in complementary DE material density images (Alvarez and Macovski 1976, Cardinal and Fenster 1988, Lemacks et al 2002). The complementary DE material images for DEDM are the calcification and glandular ratio (or tissue composition) images. The highpass filtered DE glandular-ratio image was used as an estimate of the correlated noise (Ergun et al 1990). The KNR processed DE calcification image was generated by adding the correlated noise from the DE glandular-ratio image to the original DE calcification image as follows:
| (6) |
where s is the weighting coefficient and grHP is the highpass filtered DE glandular-ratio image. As seen from equation (6), the highpass filtered DE glandular-ratio images were constructed by subtracting smoothed images from the original images (unsharp mask technique). The DE glandular-ratio images were smoothed using boxcar filters. Four different boxcar filter kernel sizes (5, 11, 25 and 51 pixels) were used to construct four different estimates of the correlated noise. The optimal magnitude of the scaling factor, s = S, that minimizes the noise in the KNR processed DE calcification images, was estimated from both theory and measured image data (see appendices A and B); both methods yielded a similar value of S = 0.001 45. Because only a small variation (<1%) of the optimized scale factor on the glandular ratio was observed, we used a single value for the entire image. Five different scale factors 0.5S, 0.75S, S, 1.25S and 1.5S, where S = 0.001 45, were studied. Five different scale factors together with four different kernel sizes resulted in 20 separate KNR processed DE calcification images. The KNR processed DE calcification images are identified using the nomenclature: DE-KNR-y-x, where y represents the scale factor and x represents the unsharp mask kernel size.
2.5. Processed image evaluation techniques
The evaluation of different noise reducing techniques was performed by computing the following two image metrics: (1) the rms signal (image noise) of the DE calcification images in regions with no calcifications present and (2) the CNR of the calcifications in the DE calcification images. Additional images of the phantom, acquired with a typical screening-examination technique (28 kVp and 100 mAs with Rh anode and Rh filter, entrance skin air kerma (exposure) ~8.76 mGy and MGD ~2.2 mGy) and referred to as the standard LE image (LE-1R), were also used to compute the calcification CNR to provide a context for calcification visibility with DEDM compared to conventional single-energy imaging.
2.5.1. Relative noise analysis
Digital indirect flat-panel x-ray detectors are prone to several sources of stationary (i.e., spatially correlated) noise (e.g., variable pixel gain, pixel dropouts) in addition to the random noise (both temporally and spatially uncorrelated, e.g., Poisson) within each pixel. While a single image contains both random and stationary noise, the ensemble average of a large number of separate images can be assumed to be free of random noise to provide an estimate of the stationary noise component. The difference between the single image and the ensemble-averaged image could be used to estimate of the random noise component. The ensemble average of 25 (=N) images leaves about 1/√N = 20% residual noise that would be included in the stationary noise component but belongs to the random noise component. Therefore, the variances calculated for the difference images were scaled by the factor (1 + 1/N) to provide the random noise component and the variances calculated for a single image provided the total noise component. The stationary noise component was calculated knowing that the total variance in an image is equal to the sum of the random and stationary noise variances.
Ideally, the signal level in regions of the DE calcification image with no calcifications present, i.e., the background DE calcification signal, would be independent of the underlying glandular ratio and fluctuate around zero. We have defined 70 regions-of-interest (ROIs) of size 51 × 51 pixels, distributed in a 10 × 7 grid across the DE calcification images, to estimate the random noise component in the image. Care was taken to ensure that none of the 70 ROIs overlapped with regions containing calcifications. The DE image noise was expected to vary across the wedge calcification phantom image due to the underlying variations in the glandular ratio (Kappadath and Shaw 2005). To better separate the effect of noise reduction techniques from the inherent noise variation across all glandular ratios, we evaluated the DE image noise over a narrower range of glandular ratios. The relative changes in the random noise component of 5 ROIs chosen to sample glandular ratios of 40–60% were used to evaluate the effectiveness of the different noise reduction techniques.
2.5.2. Calcification CNRs
The calculation of the calcification CNR in the DE calcification images of the wedge calcification phantom falls under the signal-known-exactly over background-known-exactly (SKE/BKE) imaging task (Tapioraara and Wagner 1993). The ensemble average of 25 LE images (free of random noise) was used to determine the pixel locations of the calcifications in the image based on the adaptive thresholding of the image signal at four times the local rms noise. The mean signal for each calcification was determined by averaging the calcification signal over the pixels corresponding to that calcification size. Two 101 × 101 pixel regions in the image adjacent to each of the calcification clusters were used to compute the mean and variance of the background (zero calcification) signal. The difference between the mean calcification signal and the mean background signal was used to estimate the calcification contrast. The calcification contrast is independent of the exposures used to acquire the images, therefore, the DE image constructed using ensemble averaged 25 LE and 25 HE images were used to reduce the uncertainty from random noise in the calculation of the DE calcification contrast. The locations of the calcifications do not change between the LE and DE images because there are no mis-registrations between them. The noise level corresponding to each calcification was estimated by scaling the pixel noise to the number of calcification pixels or the sampling area (matched filtering). Since calcification visibility is ultimately affected by the total noise component, the calcification CNR values were calculated using the total (random and stationary) noise in this study.
We evaluated the effectiveness of the noise reduction techniques by directly comparing the average CNR (or visibility) of the two smallest calcification (250–280 and 300–355 μm) sizes in the processed DE calcification images. We also evaluated the effectiveness of the noise reduction techniques by calculating the relative gain in the calcification CNR (the ratio of the slope of the average CNR of the processed DE image relative to the slope of the average CNR of the standard DE image) for the processed DE calcification images.
2.6. Tissue calcification phantom
Breast tissue with a glandular ratio of ~50% containing structured background was simulated by compressing bovine muscular tissue (~2.5 cm) with vegetable lard (~2.5 cm) to form a 5 cm uniformly thick animal-tissue phantom. To simulate calcification, CaCO3 crystals in 3 × 3 patterns and groups of 250–280, 280–300, 300–355 and 355–425 μm sizes were superimposed with the tissue-lard combination to produce the tissue calcification phantom (similar to the setup shown in figure 1(b)). The DE calcification image was generated following the methodology described in section 2.3. The noise reduction techniques as described in section 2.4 were applied to the DE image. The DE calcification images with noise reduction processing were compared to the standard LE image acquired with a typical screening-examination technique (section 2.5) for a visual assessment of the noise reduction techniques over more realistic tissue structures. In addition, ROIs encompassing complex tissue structures in the DE images of the tissue calcification phantom image were used to quantitatively assess noise reduction by evaluating the variations in their measured standard deviations. The ROIs over the complex tissue structures were chosen to be relatively large so that the measured standard deviation would be more influenced by tissue structures rather than the inherent image noise.
3. Results
3.1. Relative noise analysis
The random noise components for the 5 ROIs of the DE calcification images sampling glandular ration 40–60% and processed with the different noise reduction techniques are tabulated in table 1. The locations of the 5 ROIs with respect to the wedge calcification phantom are indicated in figure 1(a). One of the ROIs was located directly underneath the focal spot (A) flanked by two ROIs along the chest wall direction (B and C) with the two other ROIs located orthogonally along the cathode–anode direction (D and E). The values listed in table 1 are the random noise components of the processed DE calcification images expressed as a percentage fraction of the random noise in the standard (unprocessed) DE calcification image; therefore, lower values indicate greater noise reduction. The magnitude of random noise reduction varied amongst the different noise reduction techniques. The relative random noise decreased to 20–45% with boxcar filters and to 65–80% with HE median filters. The noise reduction was most dramatic for the KNR technique with a relatively strong dependence on the scale factor—noise decreases of 5–60% for a 50% change in scale factor. The noise reduction with the KNR technique was also sensitive, albeit to a lesser degree (5–30%), on the unsharp mask kernel size used to estimate the correlated noise; however, the magnitude of noise reduction did not change significantly for kernel sizes greater than 25 pixels. It is important to note that the changes in the random noise component after application of the noise reduction techniques, as shown in table 1, are also representative of other regions with different glandular ratios.
Table 1.
The random noise components of the DE calcification images processed with the different noise reduction technique for 5 centrally located ROIs chosen to sample glandular ratios of 40–60%. The schematic locations of the ROIs are shown in figure 1(a). The relative random noise components of the processed DE calcification images are expressed as a percentage fraction of the random noise in the standard (unprocessed) DE calcification image. The scale factor used with the KNR technique has a numerical value of S = 0.001 45.
| Relative noise in ROI after image processing (%) |
||||||
|---|---|---|---|---|---|---|
| Noise reduction technique | A | B | C | D | E | |
| Boxcar | ||||||
| Kernel = 3 | 42 | 41 | 43 | 42 | 44 | |
| 5 | 25 | 24 | 28 | 27 | 28 | |
| 7 | 17 | 18 | 20 | 20 | 21 | |
| HE median | ||||||
| Kernel = 3 | 75 | 72 | 79 | 74 | 76 | |
| 5 | 69 | 66 | 73 | 69 | 68 | |
| 7 | 67 | 65 | 72 | 67 | 67 | |
| KNR | ||||||
| Scale = S | Kernel = 5 | 25 | 26 | 28 | 27 | 28 |
| S | 11 | 10 | 14 | 13 | 13 | 13 |
| S | 25 | 5 | 9 | 6 | 6 | 5 |
| S | 51 | 4 | 9 | 4 | 4 | 4 |
| 0.50 S | Kernel = 51 | 50 | 47 | 51 | 50 | 50 |
| 0.75 S | 51 | 25 | 21 | 26 | 25 | 25 |
| S | 51 | 4 | 9 | 4 | 4 | 4 |
| 1.25 S | 51 | 27 | 34 | 23 | 26 | 25 |
| 1.5 S | 51 | 52 | 60 | 48 | 52 | 50 |
3.2. Calcification CNRs
Due to physical variations in the phantom CaCO3 crystals only ~72% of calcifications passed the conservative signal threshold criteria for calcifications. The average sizes of the calcifications inferred from the calcification signal threshold criteria (the square root of the number of calcification pixels) were 280, 380, 600, 650, 840 and 990 μm. The CNR of the calcifications were averaged over each size range to estimate the average calcification CNR. The average calcification CNR values were computed for the standard LE, the standard DE and the processed DE calcification images.
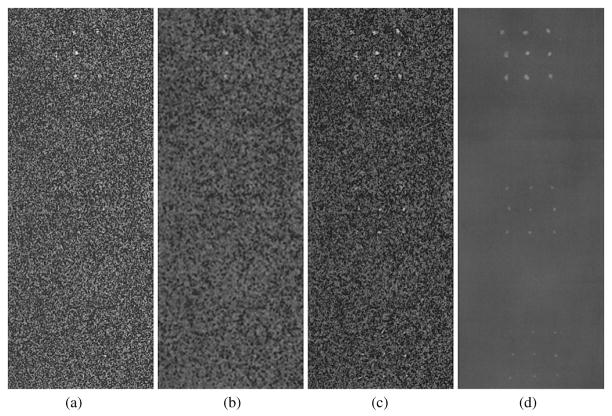
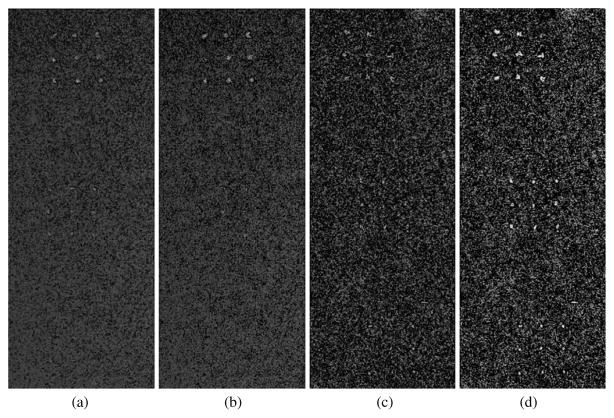
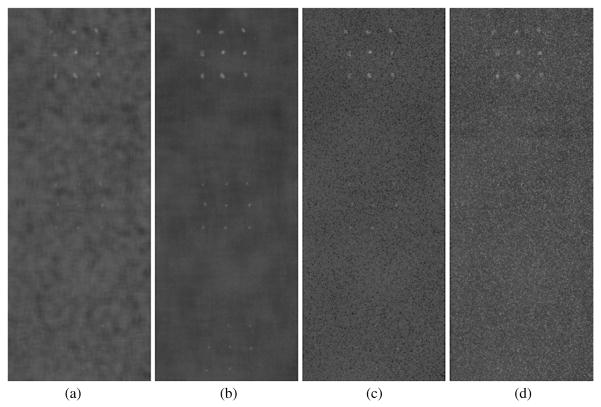
An approximate CNR threshold for calcification visibility, determined by a simple visual inspection of the standard DE calcification images, was estimated to be approximately 4. As seen in figure 2(a), calcifications greater than 425 μm, that yielded an average CNR values of ~4.2, were clearly visible in the standard DE calcification image; while only some of the 250–280 and 300–355 μm calcification sizes with average CNR values of ~1.5 and ~2.0, respectively, were visible in the standard DE calcification images (figure 2(a)). Table 2 shows the direct comparison of the average calcification CNR of the two smallest calcification (250–280 and 300–355 μm) sizes in the standard and processed DE calcification images used to evaluate the effectiveness of the different noise reduction techniques.
Figure 2.
A central 201 × 521 pixel section of the DE calcification images (1075–1275, 730–1250) showing calcification size ranges of 425–500 μm (top cluster), 300–355 μm (middle cluster) and 250–280 μm (bottom cluster) over glandular ratio of ~50% for DE calcification images (a) standard (DE-STD), (b) boxcar filtered (DE-BF-3), (c) HE median filtered (DE-HEMF-3) and (d) KNR processed (DE-KNR-S-51).
Table 2.
The direct comparison of the average calcification CNR of the two smallest calcification (250–280 and 300–355 μm) sizes in the standard and processed DE calcification images and the gain in the calcification CNR (the ratio of the slope of the average CNR of the processed DE image relative to the slope of the average CNR of the standard DE image) for the processed DE calcification images. The CNR and gain values associated with the standard LE image are also shown for comparison.
| Noise reduction technique | CNR gain | CNR 300–355 μm | CNR 280–300 μm | |
|---|---|---|---|---|
| DE standard | 1 | 2 | 1.5 | |
| LE standard | 11.3 | 22.9 | 14.6 | |
| Boxcar | ||||
| Kernel = 3 | 2.3 | 3.2 | 1.9 | |
| 5 | 3.4 | 3.2 | 1.3 | |
| 7 | 4.0 | 2.3 | 0.9 | |
| HE median | ||||
| Kernel = 3 | 1.4 | 5.2 | 4.1 | |
| 5 | 1.9 | 7.0 | 4.3 | |
| 7 | 2.0 | 3.9 | 3.1 | |
| KNR | ||||
| Scale = S | Kernel = 5 | 3.4 | 5.3 | 3.0 |
| S | 11 | 5.6 | 8.2 | 5.5 |
| S | 25 | 7.8 | 14.6 | 9.0 |
| S | 51 | 10.1 | 19.9 | 11.2 |
| 0.50 S | Kernel = 51 | 1.6 | 3.5 | 2.7 |
| 0.75 S | 51 | 2.7 | 6.0 | 4.6 |
| S | 51 | 10.1 | 19.9 | 11.2 |
| 1.25 S | 51 | 2.0 | 4.1 | 2.8 |
| 1.5 S | 51 | 0.8 | 1.8 | 1.2 |
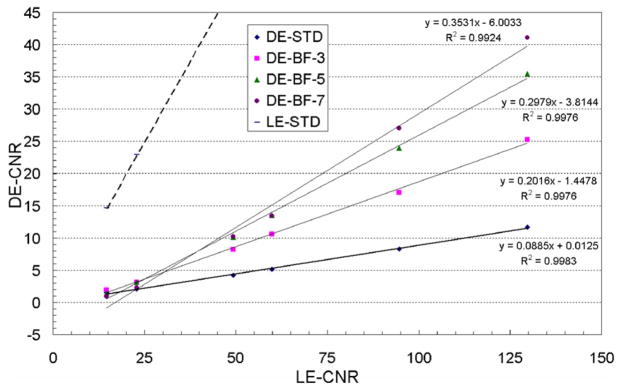
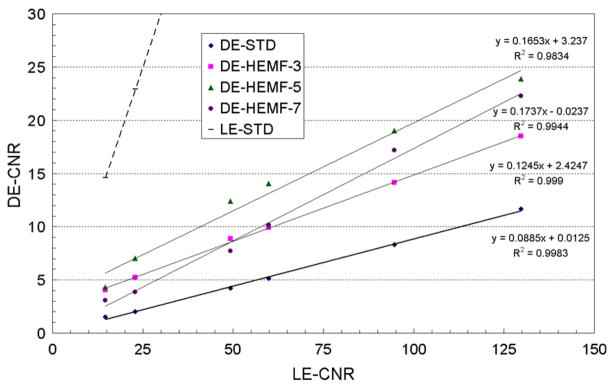
The average calcification CNR for the processed and standard DE calcification images were linearly fit to the average calcification CNR of the standard LE image to investigate the relative change in the calcification CNR due to each of the different noise reduction techniques. The R2 numbers associated with each of the linear fits in the figures below are the square of the Pearson product moment correlation coefficient, a dimensionless index that ranges from 0 to 1 that reflects the extent of a linear relationship between fit and the data (Excel® software, Microsoft Corporation, Redmond, WA)—R2 values greater than about 0.99 indicate that the linear model well represents the fitted data. A steeper slope for the average CNR of the processed DE image relative to the standard DE image indicates a gain in CNR due to image processing. Table 2 also shows the gain in the calcification CNR (the ratio of the slope of the average CNR of the processed DE image relative to the slope of the average CNR of the standard DE image) for the processed DE calcification images used to evaluate the effectiveness of the different noise reduction techniques. The relative gain values are qualitative because the fitted lines do not always extrapolate to the origin (see figures 3 and 4).
Figure 3.
The average calcification CNR and their linear fit for the standard LE, standard DE and boxcar filtered DE calcification images as a function of the average calcification CNR for the standard LE image for the different kernel sizes of the boxcar filter.
Figure 4.
The average calcification CNR and their linear fit for the standard LE, standard DE, and HE median filtered DE calcification images as a function of the average calcification CNR for the standard LE image for different kernel sizes of the HE median filter.
3.2.1. Boxcar filter
The average calcification CNR and their linear fits for the standard and boxcar filtered DE calcification images are plotted in figure 3 as a function of the average calcification CNR for the standard LE image. The R2 values indicate that the linear model well represents the data for all kernel sizes. The slope of the calcification CNR increased with the boxcar filter kernel size with gains of 2–4 in the calcification CNR (table 2). However, the two smallest calcification sizes were not visible in any of the processed DE calcification images (figure 2(b)), their average CNR increased to only about ~3 and ~2 (table 2), still below the approximate visibility threshold of 4. The visible calcification threshold size, estimated using a CNR threshold of 4 and a boxcar filter kernel size of 3 pixels, was determined to be around 355–425 μm (figure 3).
3.2.2. HE median filter
The average calcification CNR and their linear fits for the standard and HE median filtered DE calcification images are plotted in figure 4 as a function of the average calcification CNR for the standard LE image. The R2 values (>0.99) indicate that the linear model well represents the data for kernel sizes of 3 and 5 pixels. The slope of the calcification CNR increased with the median filter kernel size with gains of 1.4–2 in the calcification CNR (table 2). The two smallest calcification sizes were visible (figure 2(c)) with average CNR values greater than 4 for median filter kernel sizes of 3 and 5 pixels (table 2). A visual inspection of the HE median filtered DE calcification images, as shown in figure 5, indicated that a kernel size of 5 pixels performs better than a kernel size of 3 pixels in regions with higher glandular ratio (higher image noise).
Figure 5.
Four 201 × 521 pixel sections of HE median filtered DE calcification images showing calcification clusters of size 425–500 (top), 300–355 (middle) and 250–280 (bottom) μm over a glandular ratio of ~20% with kernel sizes of (a) 3 pixel (DE-HEMF-3) and (b) 5 pixels (DE-HEMF-5), and over a glandular ratio of ~80% with kernel sizes of (c) 3 pixels and (d) 5 pixels (DE-HEMF-5).
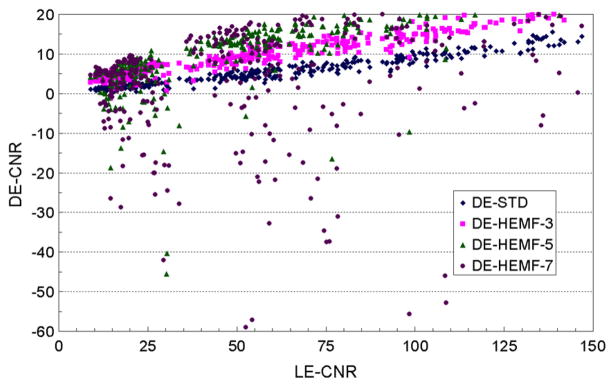
As shown in figure 6, a large number of small calcifications displayed unrealistic negative CNR values with a median filter kernel size of 7 pixels, while only a few small calcifications displayed unrealistic negative CNR values with a kernel size of 5 pixels, and no negative CNR values were observed for a kernel size of 3 pixels. The negative values observed for individual calcification CNR are image-processing artifacts arising from the application of relatively large median filter kernel size to relatively small point-like features in the images. The negative CNR values lead to the visible curvature in figure 4 for the average CNR values for kernel size of 7 pixels. The visible calcification threshold size, estimated using a CNR threshold of 4 and a HE median filter kernel size of 3 pixels, was determined to be around 250–280 μm (figures 4 and 5).
Figure 6.
The individual calcification CNR in the standard and HE median filtered DE calcification images of small calcifications as a function of the individual calcification CNR for the standard LE image.
3.2.3. KNR technique
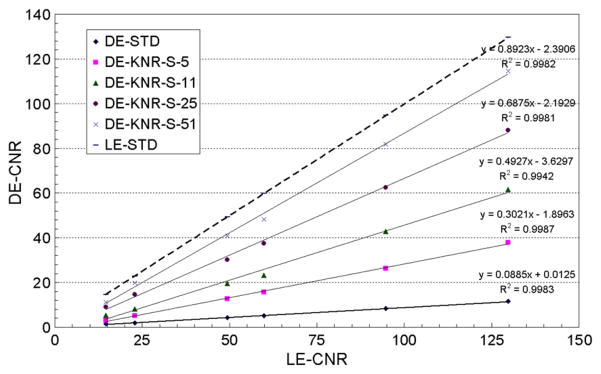
The average calcification CNR and their linear fit for the standard LE, standard DE and KNR processed DE calcification images are plotted in figures 7 and 8 as a function of the calcification CNR for the standard LE image. Figure 7 shows the average calcification CNR for the KNR processed DE calcification images with the nominal scale factor of S and the four different unsharp mask kernel sizes used for different estimates of the correlated noise from the glandular ratio images. The R2 values (>0.99) indicate that the linear model well represents the data for all kernel sizes. The slope of the average calcification CNR for the KNR processed DE calcification images increased with the kernel size of the unsharp mask filter. The highest gain in the calcification CNR was observed for a kernel size of 51 pixels. The average CNR of the two smallest calcification sizes also increased with the kernel size, they were greater than the threshold CNR of 4 for unsharp mask kernel sizes of 11, 25 and 51 pixels (table 2). The relative variations of the calcification CNR for the KNR processed DE calcification images as a function of the kernel sizes (as shown in figure 7) were observed to be similar for other values of the scale factors. A section of the KNR processed DE calcification image with two different kernel sizes (11 and 25 pixels) but identical scale factors (S = 0.00145) are shown in figures 9(a) and (b).
Figure 7.
The average calcification CNR and their linear fit for the standard LE, standard DE and KNR processed DE calcification images as a function of the average calcification CNR for the standard LE image for a scale factor of S = 0.001 45 and the four different kernel sizes of the unsharp mask filter (5, 11, 25 and 51 pixels).
Figure 8.
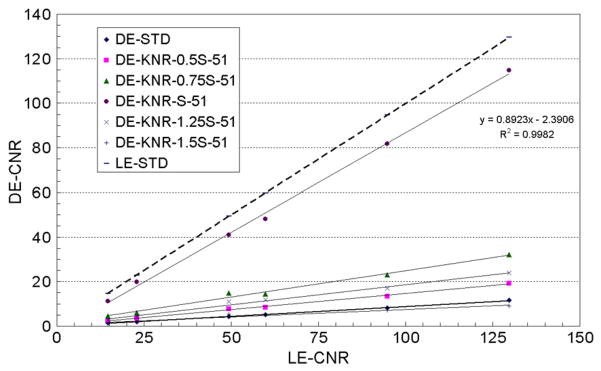
The average calcification CNR for the standard LE, standard DE and KNR processed DE calcification images as a function of the average calcification CNR for the standard LE image for an unsharp mask filter kernel size of 51 pixels and the five different scale factors (0.5S, 0.75S, S, 1.25S and 1.5S, where S = 0.001 45).
Figure 9.
Identical sections of the KNR processed DE calcification image using different processing parameters (a) scale factor S and unsharp mask kernel size of 11 pixels (DE-KNR-S-11), (b) scale factor S and unsharp mask kernel size of 25 pixels (DE-KNR-S-25), (c) scale factor 0.5S and unsharp mask kernel size of 51 pixels (DE-KNR-0.5S-51) and (d) scale factor S and unsharp mask kernel size of 11 pixels (DE-KNR-1.25S-51).
Figure 8 shows the average calcification CNR for the KNR processed DE calcification images with an unsharp mask kernel size of 51 pixels and the different scale factors used for different estimates of the correlated noise from the glandular ratio images. Although not shown the R2 values indicated that the linear model well represents the data for all scale factors. Consistent with our expectation from theory the gain in the calcification CNR was observed greatest for the nominal scale factor S = 0.001 45 and decreased when the scale factor was greater or lower than the nominal value (table 2). The average calcification CNR of the two smallest calcification sizes was greater than the threshold CNR of 4 for the nominal scale factor S = 0.001 45. The relative variations of the calcification CNR for the KNR processed DE calcification images as a function of the scale factor (as shown in figure 8) were observed to be similar for other unsharp mask kernel sizes. A section of the KNR processed DE calcification image with two different scale factors (0.75S and 1.25S) but identical unsharp mask kernel size (51 pixels) are shown in figures 9(c) and (d). The visible calcification threshold size, estimated using a CNR threshold of 4, the nominal scale factor S = 0.001 45, and an unsharp mask kernel size of 51 pixels, was determined to be lower than ~ 250 μm (figures 7–9).
3.3. Tissue calcification phantom images
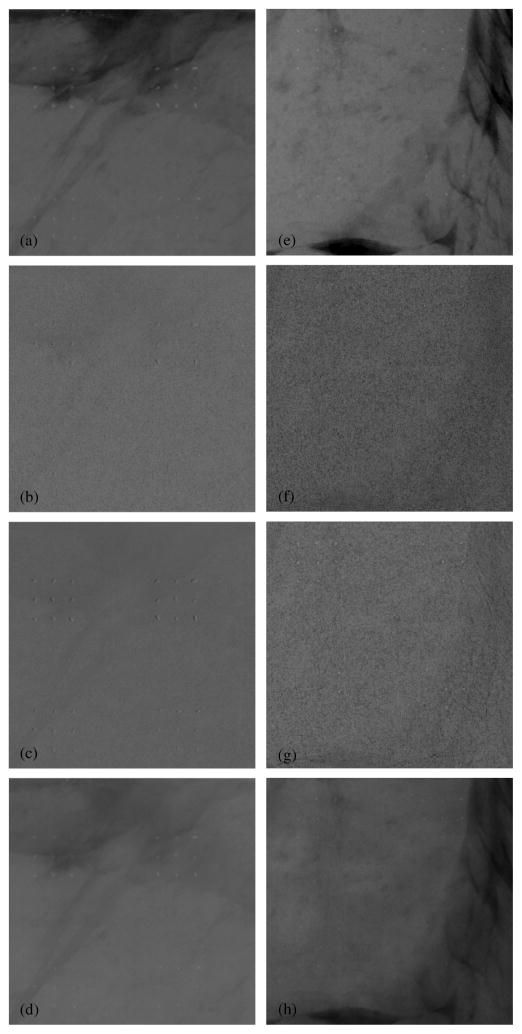
Two 5 × 5 cm sections of the standard LE image of the tissue calcification phantom are shown in figures 10(a) and (e). The tissue calcification phantom resulted in images with calcifications superimposed over more realistic tissue structures. The DE calcification images of these two sections were used to more objectively demonstrate noise reduction techniques for the techniques under investigation. For each of the two 5 × 5 cm sections, three different DE calcification images were generated: the standard DE calcification image without any noise reduction, the DE calcification image with a HE median filter with kernel size 3 pixels, and the DE calcification image with the KNR technique with a scale factor of S and kernel size of 51 pixels. The optimal parameters for the HE median filter and KNR techniques were used for this demonstration, while the boxcar filter was not considered due to its poor overall performance (sections 3.2 and 4.1).
Figure 10.
Images from two 5 × 5 cm sections of the tissue calcification phantom. The images on the left (a–d) are from one section of the phantom with calcification sizes of 355–425 (top) and 300–355 (bottom) μm, while images from the right (e–h) are from another section of the phantom with calcification sizes of 280–300 (top) and 250–280 (bottom) μm. The top row (a and e) shows the conventional single-energy images (LE-1R). For each phantom section, three DE images are shown: the second row (b and f) shows the standard DE calcification images without any noise reduction (DE-STD), the third row (c and g) shows the DE calcification images with the HE median filter technique (DE-HEMF-3), and the last row (d and h) shows the DE calcification images with the KNR technique (DE-KNR-S-51).
Table 3 shows the mean calcification thickness (in mm) and standard deviation for two ROIs in the tissue calcification phantom images. The size of ROI-1 was 175 × 800 pixels and that of ROI-2 was 600 × 250 pixels. The mean DE signal in both ROIs did not vary substantially between the different noise-reduced images (the coefficient of variability was ~7%). However, the standard deviation of the ROIs which is indicative of the image noise varied amongst the noise-reduced DE images. As shown in table 3, the noise decreased by 12–15% with the HE median filters and by 59–65% with the KNR technique compared to the standard DE calcification image.
Table 3.
The mean calcification thickness (in mm) and standard deviation of the two ROIs in the DE images of the tissue calcification phantom used to quantitatively assess the various noise reduction techniques. The ROIs were chosen to be relatively large and cover regions of the tissue calcification phantom image with complex tissue structures. The size of ROI-1 was 175 × 800 pixels and that of ROI-2 was 600 × 250 pixels.
| ROI-1 |
ROI-2 |
|||
|---|---|---|---|---|
| Image Identifier | Mean | Standard-deviation | Mean | Standard-deviation |
| DE-STD | −0.135 | 0.46 | −0.17 | 0.57 |
| DE-HEMF-3 | −0.12 | 0.40 | −0.15 | 0.50 |
| DE-HEMF-5 | −0.12 | 0.41 | −0.15 | 0.51 |
| DE-KCNR-25 | −0.14 | 0.19 | −0.17 | 0.31 |
| DE-KCNR-51 | −0.135 | 0.19 | −0.17 | 0.30 |
4. Discussion
4.1. Boxcar filter
The boxcar filtered DE calcification image noise was reduced to 20–45% (table 1); however, the two smallest calcification sizes were still not visible in the processed DE calcification images (figure 2(b)), their average CNR values were still below the approximate visibility threshold of 4 (table 2). The loss of calcification CNR in the boxcar filtered DE calcification image (figure 3) may be attributed to the smoothing of the calcification signal (and hence a loss of calcification contrast) with the boxcar filter. While the boxcar filter with kernel size 3 pixels seems to perform better than the other kernel sizes, the calcification visibility with the boxcar filter was not improved (perhaps even worsened) compared to the standard DE calcification image.
4.2. HE median filter
Although the HE median filter technique resulted in lower levels of noise (compared to the boxcar filter) of 65–80% and a modest increase (1.5–2) in the calcification CNR gain (tables 1 and 2), the two smallest calcification sizes were visible for median filter kernel sizes of 3 and 5 pixels (see figures 2(b) and 5) with average CNR values greater than 4 in the HE median filtered DE calcification images (table 2). The performance of the HE median filter seemed to depend upon the underlying glandular ratio; a kernel size of 5 pixels was more effective than a kernel size of 3 pixels in regions with higher noise (higher glandular ratio). This observation seems reasonable as a median filter with kernel size of 5 is better at filtering noise than a median filter with kernel size of 3 pixels; however, a few small calcifications displayed unrealistic negative CNR values with a kernel size of 5 pixels due to image-processing artifacts. The results indicate that an optimal trade-off between noise reduction and image artifacts could be achieved by using median filters with kernel sizes of 3 at lower glandular rations (<50%) and kernel sizes of 5 at higher glandular ratios (>50%). If a single kernel is to be used for the entire image then a kernel size 3 pixels seems optimal due to the absence of image artifacts and a modest increase in CNR at all calcification sizes.
4.3. KNR technique
The noise reduction was most dramatic for the KNR technique with a strong dependence on the scale factor and a weaker dependence on the kernel size used to estimate the correlated noise. The highest noise reduction by 90–95% with the KNR technique, corresponding to an increase of 8–10 in the calcification CNR gain, was achieved with a scale factor of S = 0.001 45 and kernel size of 51 pixels. The slope of the average calcification CNR was found to have increased from ~0.09 to ~0.9—a slope of 1 implies the same CNR as that from the LE-1R image. The scale factor (S) had the most significant effect on the DE image noise and therefore the calcification CNR compared to the smoothing kernel size. The DE images processed with the nominal scale factor (S = 0.001 45) showed the lowest noise levels irrespective of the smoothing kernel size used. Although the optimal scale factor might vary across the image with the glandular ratio, we have applied a global scale factor. A possible improvement of the current KNR implementation might be adaptive determination of scale factor depending upon the local glandular ratio. A reasonable trade-off between tissue structures and noise suppression was achieved with a scale factor of S (= 0.001 45) and kernel sizes of 25 or 51 pixels (DE-KNR-S-25 and DE-KNR-S-51 images).
4.4. Tissue calcification phantom images
All evidence of tissue structures have been successfully eliminated from the standard DE calcification image, it showed all calcifications larger than 300 μm and many of size 280–300 μm. Noise reduction with the HE median filter and KNR techniques showed all calcifications that were larger than 250 μm. The HE median filter images showed a largely uniform image with very subtle shadows of tissue structures. The KNR technique reintroduced some of the tissue structures, however, the tissue structures in the KNR images were smoother and had lower contrast compared to the single-energy images. As expected, the mean DE signal did not vary substantially between the different noise-reduced images. Similar to the findings for the wedge calcification phantom (section 3.1), the image noise decreased with the HE median filter and the KNR techniques.
5. Conclusion
Noise reduction techniques significantly influenced and improved the appearance of the DE calcification images. Amongst the different noise reduction techniques evaluated in this study, the KNR method was found to be most effective in reducing the image noise and increasing the calcification visibility (or CNR), closely followed by the HE median filter technique. Although the simple smoothing (boxcar) filter reduced the noise, it did not improve calcification visibility. While the HE median filter did not perform as well as KNR in terms of noise reduction or calcification visibility, its implementation was much easier compared to the KNR technique which required the generation of an additional DE glandular-ratio image. The visible calcification threshold size with DEDM over smoothly varying background at screening mammography doses, assuming a CNR threshold of 4, was estimated to be around 250 μm with both the HE median filter and the KNR techniques. The quality of DE images with noise reduction techniques based on wedge calcification phantom studies were verified with DE images of the tissue calcification phantom where the calcifications were superimposed over more realistic tissue structures.
Although DE imaging could suppress obscuration of calcifications by the tissue-structure background, it also increased the intrinsic noise in the DE images (Lemacks et al 2002; Kappadath and Shaw 2004, Kappadath et al 2005). The advantages offered by DE calcification imaging will depend on weighing the benefit of removing the tissue-structure background against the drawback of a reduced calcification CNR. The assessment of any possible improvements in calcification visibility with the DE technique (standard or noise-reduced) versus the standard LE technique is not within the scope of this work. An objective comparison between DE and standard LE images cannot be adequately performed using phantoms, but rather requires a receiver-operating characteristic analysis using real patients where mammograms are acquired with both the standard LE and DE techniques. An observer performance study reported a threshold calcification size of ~250 μm when imaged over structured background (Lai et al 2005) while a separate controlled in vitro study of calcification detectability with conventional screen film gave a minimum detectable size of ~290 μm (Sickles 1982). Under the current implementation of DEDM, the visible calcification threshold size was around 300–355 μm for standard DE calcification images that decreased to ~250 μm when noise-reducing algorithms were used. While the threshold calcification sizes between conventional single-energy techniques and noise-reduced DEDM are somewhat similar, a noteworthy difference between them is that unlike DE images that are limited by quantum noise (Kappadath and Shaw 2005), the single-energy images are limited by structure noise (Revesz et al 1974, Samei et al 1999, Lai et al 2005). Although the threshold calcification size with conventional single-energy techniques could be lower locally within an image, the threshold size varies across the image and may increase substantially for regions with complex tissue structures. The main advantage of DE imaging lies in its ability to depict calcifications over a uniform background where tissue structures (anatomical noise) have been suppressed, with a threshold calcification size that is somewhat similar to single-energy images yet largely independent of the underlying tissue structures.
Acknowledgments
This work was supported in part by a research grant DAMD 17-00-1-0316 from the US Army Breast Cancer Research Program and a research grant CA 104759 from the National Cancer Institute.
Appendix A. Estimate of the optimal scale factor from theory
The KNR processed DE calcification image, , can be written as
| (A.1) |
where we have explicitly expressed the cubic inverse-mapping functions that describe both the DE calcification (tc ) and the DE glandular-ratio (gr) images. The coefficients of the cubic functions that describe the DE calcification (tc) and glandular-ratio (gr) images were determined from separately acquired calibration data (Kappadath and Shaw 2003).
The variance of the KNR processed DE calcification image, , can be written as follows:
| (A.2) |
The scale factor can be chosen to reduce the noise in the KNR processed DE calcification image. The optimal value for s is found by minimizing the variance, , with respect to s. This condition is satisfied for
| (A.3) |
The optimal value for S was computed for each of the 7 × 10 ROIs using the respective log-signal (Dl and Dh) and random-noise variance ( and ) values. The optimal values for S computed over all ROIs ranged from 0.001 484 to 0.001 494 with a median value of 0.001 488. A small dependence (<1%) of the optimal scale factor on the glandular ratio was observed.
Appendix B. Estimate of the optimal scale factor from data
The determination of the optimal scale factor S for the KNR technique was also determined using the wedge-phantom image data by computing the KNR processed DE calcification images for various values of scale factor and high-pass filter kernel size. The optimal scale factor was empirically determined as that which yielded the lowest noise in the KNR processed DE calcification image. The methodology can be briefly described as follows: first choose a filter kernel and construct the high-pass filtered DE glandular-ratio image. Then construct KNR processed DE calcification images using scale factors that ranged from 0.0 to 0.005 in steps of 0.000 025 (total of 200 different KNR processed DE calcification images). Compute the random noise component in each of the 70 ROIs for each of the 200 KNR processed DE calcification images and determine the scale factor that yielded the lowest random noise level. Repeat this process for different high-pass filter kernel sizes.
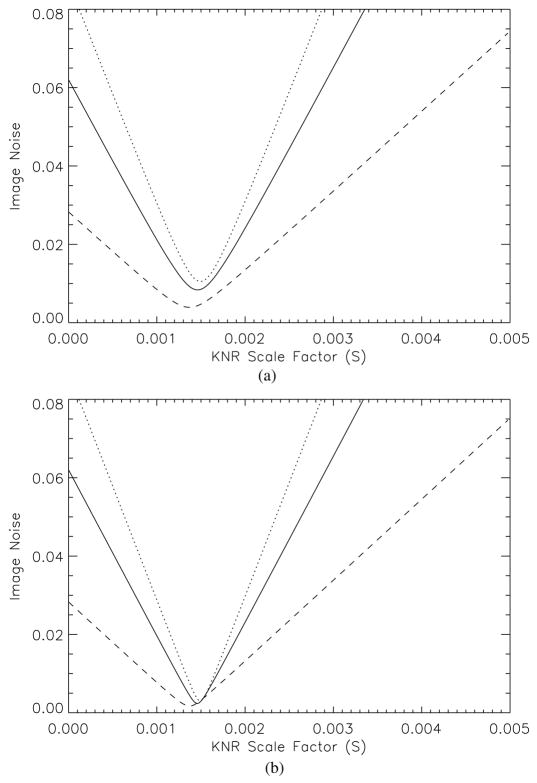
As an illustration, the estimated noise in the KNR processed DE calcification image as a function of the scale factor, S, is shown in figure 11 for three different glandular ratios and unsharp masks of two different kernels. For a given scale factor, the magnitude of noise reduction achieved with KNR increased for tissue with higher glandular ratio yet did not vary substantially with the median filter size. The optimal scale factor was found to be insensitive to the high-pass filter kernel sizes or glandular-tissue composition. The optimal scale factors computed over all ROIs ranged from 0.001 318 to 0.001 581 with a median value of 0.001 450, which is in excellent agreement with the value derived from theory (appendix A).
Figure 11.
The estimated noise in the KNR processed DE calcification image as a function of the scale factor, S, and an unsharp mask with a median filter of (a) 11 pixels and (b) 51 pixels. The three curves shown represent different glandular ratio regions of ~20% (dotted line), ~50% (solid line) and ~80% (dashed line).
References
- Alvarez RE, Macovski A. Energy-selective reconstructions in x-ray computerized tomography. Phys Med Biol. 1976;21:733–44. doi: 10.1088/0031-9155/21/5/002. [DOI] [PubMed] [Google Scholar]
- Brandan ME, Ramirez VR. Evaluation of dual-energy subtraction of digital mammography images under conditions found in a commercial unit. Phys Med Biol. 2006;51:2307–20. doi: 10.1088/0031-9155/51/9/014. [DOI] [PubMed] [Google Scholar]
- Brettle DS, Cowen AR. Dual-energy digital mammography using stimulated phosphor computed radiography. Phys Med Biol. 1994;39:1989–2004. doi: 10.1088/0031-9155/39/11/012. [DOI] [PubMed] [Google Scholar]
- Brody WR, Butt G, Hall A, Macovski A. A method for selective tissue and bone visualization using dual energy scanned projection radiography. Med Phys. 1981;8:353–7. doi: 10.1118/1.594957. [DOI] [PubMed] [Google Scholar]
- Cardinal HN, Fenster A. Theoretical optimization of a split septaless xenon ionization detector for dual-energy chest radiography. Med Phys. 1988;15:167–80. doi: 10.1118/1.596248. [DOI] [PubMed] [Google Scholar]
- Ergun DL, Mistretta CA, Brown DE, Bystrianyk RT, Sze WK, Kelcz F, Naidich DP. Single-exposure dual-energy computed radiography: improved detection and processing. Radiology. 1990;174:243–9. doi: 10.1148/radiology.174.1.2294555. [DOI] [PubMed] [Google Scholar]
- Hinshaw DA, Dobbins JT. Recent progress in noise reduction and scatter correction in dual-energy imaging. SPIE Med Imaging. 1995;2432:134–42. [Google Scholar]
- Ito W, Shimura K, Nakajima N, Ishida M, Kato H. Improvement of detection in computed radiography by new single-exposure dual-energy subtraction. J Digit Imaging. 1993;6:42–7. doi: 10.1007/BF03168417. [DOI] [PubMed] [Google Scholar]
- Johns PC, Drost DJ, Yaffe MJ, Fenster A. Dual-energy mammography: initial experimental results. Med Phys. 1985;12:297–304. doi: 10.1118/1.595767. [DOI] [PubMed] [Google Scholar]
- Johns PC, Yaffe MJ. Theoretical optimization of dual-energy x-ray imaging with application to mammography. Med Phys. 1985;12:289–96. doi: 10.1118/1.595766. [DOI] [PubMed] [Google Scholar]
- Kalender WA, Klotz E, Kostaridou L. An algorithm for noise suppression in dual energy CT material density images. IEEE Trans Med Phys. 1988;7:218–24. doi: 10.1109/42.7785. [DOI] [PubMed] [Google Scholar]
- Kappadath SC, Shaw CC. Dual-energy digital mammography: calibration and inverse-mapping techniques to estimate calcification thickness and glandular-tissue ratio. Med Phys. 2003;30:1110–7. doi: 10.1118/1.1576394. [DOI] [PubMed] [Google Scholar]
- Kappadath SC, Shaw CC. Quantitative evaluation of dual-energy digital mammography for calcification imaging. Phys Med Biol. 2004;49:2563–76. doi: 10.1088/0031-9155/49/12/007. [DOI] [PubMed] [Google Scholar]
- Kappadath SC, Shaw CC. Dual-energy digital mammography for calcification imaging: scatter and nonuniformity corrections. Med Phys. 2005;32:3395–408. doi: 10.1118/1.2064767. [DOI] [PubMed] [Google Scholar]
- Kappadath SC, Shaw CC, Lai C-J, Liu X, Whitman G. Dual-energy digital mammography for calcification imaging: theory and implementation. SPIE Med Imaging. 2004;5368:751–60. [Google Scholar]
- Kappadath SC, Shaw CC, Lai C-J, Liu X, Whitman G, Yang WT. Dual-energy digital mammography for calcification imaging: improvement by post-image processing. SPIE Med Imaging. 2005;5745:1342–50. [Google Scholar]
- Kido S, Ikezoe J, Naito H, Arisawa J, Tamura S, Kozuka T, Ito W, Shimura K, Kato H. Clinical evaluation of pulmonary nodules with single-exposure dual-energy subtraction chest radiography with an iterative noise-reduction algorithm. Radiology. 1995;194:407–12. doi: 10.1148/radiology.194.2.7824718. [DOI] [PubMed] [Google Scholar]
- Lai C-J, Shaw CC, Whitman GJ, Johnston DA, Wang WT, Selinko V, Arribas E, Dogan B, Kappadath SC. Visibility of simulated microcalcifications—a hardcopy-based comparison of three mammographic systems. Med Phys. 2005;32:183–94. doi: 10.1118/1.1833011. [DOI] [PubMed] [Google Scholar]
- Lehmann LA, Alvarez RE, Macovski A, Brody WR. Generalized image combinations in dual KVP digital radiography. Med Phys. 1981;8:659–67. doi: 10.1118/1.595025. [DOI] [PubMed] [Google Scholar]
- Lemacks MR, Kappadath SC, Shaw CC, Liu X, Whitman G. A dual-energy subtraction technique for microcalcification imaging in digital mammography—a signal-to-noise analysis. Med Phys. 2002;29:1739–51. doi: 10.1118/1.1494832. [DOI] [PubMed] [Google Scholar]
- Maher KP. Scatter correction in digital radiography using interpolated local sampling of aperture signal. Aust Phys Eng Sci Med. 2001;24:79–83. doi: 10.1007/BF03178350. [DOI] [PubMed] [Google Scholar]
- McCollough CH, van Lysel MS, Peppler WW, Mistretta CA. A correlated noise reduction algorithm for dual-energy digital subtraction angiography. Med Phys. 1989;16:873–80. doi: 10.1118/1.596436. [DOI] [PubMed] [Google Scholar]
- Revesz G, Kundel HL, Graber MA. The influence of structured noise on the detection of radiologic abnormalities. Invest Radiol. 1974;9:479–86. doi: 10.1097/00004424-197411000-00009. [DOI] [PubMed] [Google Scholar]
- Rutherford RA, Pullan BR, Isherwood I. Measurement of effective atomic number and electron density using an EMI scanner. Neuroradiology. 1976;11:15–21. doi: 10.1007/BF00327253. [DOI] [PubMed] [Google Scholar]
- Samei E, Flynn MJ, Eyler WR. Detection of subtle lung nodules: Relative influence of quantum and anatomic noise on chest radiographs. Radiology. 1999;213:727–34. doi: 10.1148/radiology.213.3.r99dc19727. [DOI] [PubMed] [Google Scholar]
- Sickles EA. Mammographic detectability of breast microcalcifications. Am J Roentgenol. 1982;139:913–8. doi: 10.2214/ajr.139.5.913. [DOI] [PubMed] [Google Scholar]
- Tapioraara MJ, Wagner RF. SNR and noise measurements for medical imaging: a practical approach based on statistical decision theory. Phys Med Biol. 1993;38:71–92. doi: 10.1088/0031-9155/38/1/006. [DOI] [PubMed] [Google Scholar]
- Vedantham S, et al. Full breast digital mammography with an amorphous silicon-based flat panel detector: physical characteristics of a clinical prototype. Med Phys. 2000;27:558–67. doi: 10.1118/1.598895. [DOI] [PMC free article] [PubMed] [Google Scholar]
- Wagner FC, Macovski A, Nishimura DG. Dual-energy x-ray projection imaging: two sampling schemes for the correction of scattered radiation. Med Phys. 1988;15:732–48. doi: 10.1118/1.596188. [DOI] [PubMed] [Google Scholar]
- Warp RJ, Dobbins JT. Quantitative evaluation of noise reduction strategies in dual-energy imaging. Med Phys. 2003;30:190–8. doi: 10.1118/1.1538232. [DOI] [PubMed] [Google Scholar]


