

In this pilot study, we have derived an imaging metric (hyperperfusion volume) that reflects local perfusion changes in glioblastomas and have found that this metric has significantly improved correlation to time to progression as compared with more commonly used metrics.
Abstract
Purpose:
To derive a magnetic resonance (MR)-based imaging metric that reflects local perfusion changes resulting from the administration of angiogenic-inhibiting chemotherapy in patients with recurrent glioblastoma multiforme (GBM).
Materials and Methods:
In this retrospective Institutional Review Board–approved HIPAA-compliant study, 16 patients (12 men, four women; mean age, 51.8 years ± 15.1 [standard deviation]) with recurrent GBM received bevacizumab every 3 weeks (15 mg per kilogram of body weight) as part of a clinical trial. Baseline MR images were acquired, and follow-up images were acquired every 6 weeks thereafter until tumor progression or death. Imaging included perfusion and T1-weighted contrast material–enhanced MR imaging. Perfusion images were analyzed both with and without correction for contrast material leakage. The volumes of interest were selected as enhancing voxels on T1-weighted contrast-enhanced MR images. Relative cerebral blood volume (rCBV) maps were created from analysis of MR perfusion images. The volumes of interest were used to calculate the following parameters: size, mean rCBV, mean leakage coefficient K 2, and hyperperfusion volume (HPV), which is the fraction of the tumor with an rCBV higher than a predetermined threshold. Percent change in each parameter from baseline to first follow-up was compared with time to progression (TTP) by using a Cox proportional hazards model with calculation of hazard ratios.
Results:
The most significant hazard ratio was seen with a ΔHPV cutoff of rCBV greater than 1.00 (hazard ratio, 1.077; 95% confidence interval: 1.026, 1.130; P = .002). The only significant ratios greater than one were those that resulted from perfusion calculated as mean rCBV and ΔHPV. The ratios were also higher after correction for leakage.
Conclusion:
This pilot study derived an imaging metric (HPV) that reflects local perfusion changes in GBMs. This metric was found to show a significantly improved correlation to TTP as compared with more commonly used metrics.
© RSNA, 2010
Introduction
Patients with recurrent glioblastoma multiforme (GBM) have varied responses to antiangiogenic therapy (1). On the basis of current clinical and imaging criteria, it remains impossible to prospectively predict which patients will respond to such therapy. Currently, changes in enhancement volume, as seen on contrast material–enhanced T1-weighted magnetic resonance (MR) images, are used to determine progression, but these changes are only seen after administration of the antiangiogenic drug. The ability to identify changes in a tumor’s perfusion offers the potential to predict growth or regression. With this information, clinicians could offer more tailored treatment, which might ultimately improve outcomes. The goal of our study was to derive an MR-based imaging metric that reflects local perfusion changes resulting from the administration of angiogenic-inhibiting chemotherapy.
Dynamic susceptibility-weighted contrast-enhanced (DSC) MR imaging can be used to measure relative cerebral blood volume (CBV) (rCBV) as a surrogate marker of perfusion (2–4). It has been shown (5–8) that MR perfusion imaging is a valuable adjunct to conventional imaging and that it correlates with tumor progression. In addition, leakage of contrast material in neovascular lesions leads to underestimation of the relevance of rCBV (9,10). Any model attempting to accurately track perfusion changes must account for the leakage of the T1-shortening contrast material through the blood-brain barrier (11). CBV and permeability measures, such as K trans, derived from dynamic contrast-enhanced MR images have been proved to predict tumor grade, and such imaging methods may be useful in a similar approach for predicting tumor response to therapy (12,13). We have derived an imaging metric that includes the contrast material leakage correction proposed by Donahue et al (14) and a quantitative measure of intratumoral perfusion changes. Our metric considers both T1 and perfusion changes after contrast material administration in the enhancing portion of the tumor. We hypothesized that quantified changes in tumor perfusion due to angiogenic inhibition could serve as a measure of response to antiangiogenic chemotherapy in patients with recurrent GBMs.
Materials and Methods
The clinical trial from which we acquired our data received financial support from Genentech (San Francisco, Calif). All data were under control of the authors.
Patient Selection
Sixteen patients (mean age, 51.8 years ± 15.1 [standard deviation]), including 12 men (mean age, 51.0 years ± 16.7) and four women (mean age, 54.0 years ± 10.9), with recurrent GBMs who were part of an Institutional Review Board–approved Health Insurance Portability and Accountability Act–compliant clinical trial (March 21, 2006, to November 25, 2008) were retrospectively studied. A neuro-oncologist (J.R., with 15 years experience) was responsible for the clinical trial and the clinical treatment of patients. Patients were eligible for the clinical trial if they had a recurrent or progressive tumor; had undergone surgery more than four weeks previous to enrollment; failed prior external beam radiation and temozolomide therapy; were on a stable dose of steroids for longer than 5 days; were at least 18 years old, with a life expectancy longer than 8 weeks and a Karnofsky performance status of greater than 60; had adequate bone marrow, liver, and renal function; and had at least one relapse prior to the current regimen of chemotherapy. Patients were not eligible for the trial if they had some bevacizumab-specific criteria (ie, uncontrolled hypertension, active vascular disease, bleeding, intestinal perforation) that could not adequately be controlled with appropriate therapy or that would compromise the patient’s ability to tolerate therapy, including inability to comply with study and/or follow-up procedures; were positive for the human immunodeficiency virus and were receiving antiretroviral therapy; had any history of active cancer (on therapy or with proved malignancy in the previous 3 years); were pregnant; or were breast-feeding. Of the 61 patients in the clinical trial, 45 were excluded from this study the following reasons: tumor pathologic findings other than GBM (ie, anaplastic astrocytoma [n = 5], anaplastic oligodendroglioma [n = 4], and anaplastic oligoastrocytoma [n = 2]) and inadequate imaging available (n = 34).
Once enrolled in the clinical trial, patients continued chemotherapy and imaging surveillance until there was evidence of clinical deterioration as defined by radiologic tumor progression, neurologic deterioration, or death. Contrast-enhanced T1-weighted and fluid-attenuated inversion-recovery (FLAIR) MR images were examined. FLAIR MR images were used to identify areas of unenhanced infiltrative tumor. Radiologic progression was defined as an increase in the enhancing area of at least 25% on contrast-enhanced T1-weighted MR images on the basis of the largest cross-sectional area (largest cross-sectional diameter multiplied by largest diameter perpendicular to it) (15). While FLAIR MR imaging was not used for the clinical trial, it was used for the clinical care of the participating patients. All images were read by a board-certified radiologist with 25 years of experience in central nervous system tumor imaging (S.W.H.). We defined time to progression (TTP) as the number of days between the first treatment dose and removal from the study. A Kaplan-Meier curve was generated for the TTP of all 16 patients. Survival was not used as an outcome owing to variations in treatment after patients were taken out of the study, which would confound the direct evaluation of the stated hypothesis.
MR Imaging and Drug Dosing Protocol
For patients enrolled in the clinical trial, baseline MR imaging was performed, followed by administration of bevacizumab (Avastin; Genentech) (15 mg per kilogram of bodyweight) every 3 weeks and follow-up MR imaging every 6 weeks until there was evidence of tumor progression (Fig 1). One treatment cycle was defined as 6 weeks. Bevacizumab is a monoclonal antibody that binds vascular endothelial growth factor and prevents it from interacting with its receptors (ie, vascular endothelial growth factor receptor 1 and kinase insert domain receptor) on the surface of endothelial cells. Vascular endothelial growth factor is needed for the development and growth of new blood vessels in response to growing tumors.
Figure 1:

Timeline shows drug administration and MR imaging intervals.
All MR imaging was performed with a 1.5-T imager (Avanto; Siemens Medical Solutions, Malvern, Pa) according to our departmental protocol for brain tumors (Table 1), which includes standard anatomic imaging (localizers, T1-weighted, T2-weighted, and FLAIR imaging), DSC perfusion imaging (axial two-dimensional GRE echo-planar single-shot T2*-weighted multiphase imaging with a receive-only head coil), and T1-weighted contrast-enhanced imaging (three-dimensional magnetization-prepared rapid acquisition GRE). FLAIR MR imaging was not used at the outset of the clinical trial and, thus, was not available for all patients. The multiphase GRE images were acquired in conjunction with an injection of a gadolinium-based contrast material (0.2 mmol per kilogram of body weight) (Magnevist; Berlex, Princeton, NJ) at a rate of 4.0 mL per second through an antecubital vein by using a power injector (Solaris; Medrad, Indianola, Pa). The magnetization-prepared rapid acquisition GRE images, which were used to determine tumor size, also served to guide the perfusion image analysis.
Table 1.
MR Imaging Pulse Parameters
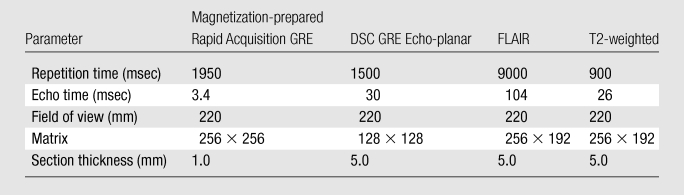
Note.—GRE = gradient echo.
Image Postprocessing
All image postprocessing and data analysis were performed by using software (Matlab, V2006a; Mathworks, Nantick, Mass). A fully automated deconvolution analysis was performed to create parametric images of CBV, cerebral blood flow, and mean transit time (16,17). Coregistration of CBV maps and axial T1-weighted contrast-enhanced images was performed by using statistical parametric mapping software (SPM5; University College London, London, England). This method has been validated by Kiebel et al (18), who tested the accuracy of coregistration between MR imaging and simulated positron emission tomographic (PET) images. The value of perfusion of each voxel was determined by using a previously described technique (5,8) (dividing the voxel’s CBV by that of normal-appearing white matter), which results in rCBV.
Contrast material leakage correction was performed on the DSC images by using a technique outlined by Boxerman et al (11). The model assumes that the blood-brain barrier is intact and that, after passage and recirculation of the gadolinium-based contrast material, the T2* signal intensity should return to close to its baseline value. In regions of compromised blood-brain barrier, the leakage of the contrast material results in local T1 shortening, and consequently, the signal intensity in regions of contrast leakage overshoot this value. By using the proposed method, enhancing voxels were selected, leakage coefficient K 2 was calculated, and the coefficient was subsequently used to correct the CBV for contrast material leakage. This corrected CBV was calculated for all enhancing voxels on the perfusion images.
Quantification of Volume and Perfusion Changes
Tumor volume was determined from the contrast-enhanced T1-weighted MR images by using a user-defined volume of interest. Volumes of interest were selected as areas that were enhanced on the contrast-enhanced T1-weighted images by using a partially automatic segmentation algorithm unique to our study. Enhancement on contrast-enhanced T1-weighted images was chosen based on a sliding threshold that allowed the user to interactively select voxels above the threshold. This process was performed on all sections to include the entire three-dimensional extent of the tumor. Volumes of interest were drawn by a board-certified radiologist who was blinded to tumor response (S.W.H.). Image order was randomized prior to review, and all dates were removed from the images. The tumor volumes of interest were then used to determine mean rCBV, mean leakage coefficient K 2, and the image metric described below.
An image metric was derived on the basis of the statistical distribution of rCBV values within the enhancing portion of the tumor (19). The hyperperfusion volume (HPV) was defined as the percentage of voxels within the tumor volume of interest in which rCBV values were greater than a predetermined threshold. Our goal was to identify regions of the volume of interest in which perfusion values remain elevated despite the administration of an angiogenic inhibitor. The value of the threshold was varied to determine the value that best predicts TTP of the tumor. This is similar to the approach proposed by Law et al (7,8), who determined the mean of the enhancing portion of the tumor as an indicator of tumor progression. We have extended this concept with a metric that accounts for growth or shrinkage of the tumor, as well as the total volume of the tumor in which hyperperfusion is observed.
All image metrics were calculated over the whole tumor volume on all images for each patient at baseline and after the first follow-up imaging (ie, 6 weeks after start of treatment). The goal of angiogenic inhibition is to reduce the perfusion in a tumor. Therefore, we examined the percent change in the HPV (ΔHPV), as well as the percent change in all other metrics, from baseline to the first follow-up imaging as indicators of therapy response.
Statistical Analysis
We varied the threshold that determined the fraction of the tumor that was defined to be enhancing in our calculation of ΔHPV. The ΔHPV for each of these cutoffs was compared with TTP by using the Cox proportional hazards model with calculation of the hazard ratio or odds ratio and 95% confidence intervals.
We compared the predictive ability of ΔHPV to that of more traditional measures of tumor progression (ie, tumor volume, mean leakage coefficient K 2, and mean rCBV). Just as with ΔHPV, we used the percent change in each of these measures between baseline and the first follow-up imaging and performed Cox proportional hazards analysis. The predictive ability of each parameter was determined by comparing the hazard ratios. All statistical analyses were performed by using software (PASW Statistics, version 18.0.0; SPSS, Chicago, Ill).
Results
Demographic and follow-up data are included in Table 2. All patients were taken off of the study owing to progression of disease (clinical progression, n = 1; radiologic progression, n = 15) and subsequently died at varying intervals. Mean TTP was 94.9 days ± 93.8 (range, 34–423 days). A Kaplan-Meier curve for TTP is shown in Figure 2. Mean survival from enrollment in the study until death was 226.7 days ± 171.7 (range, 69–615 days). Patients underwent a mean of 4.6 treatment cycles ± 4.4 (range, 1–20). Mean baseline tumor area was 1736 mm2 ± 1398, with a mean increase at 6-week follow-up of 41.5% ± 110.0% and a mean final tumor volume before removal from the study of 2375 mm2 ± 1742.
Table 2.
Patient Characteristics
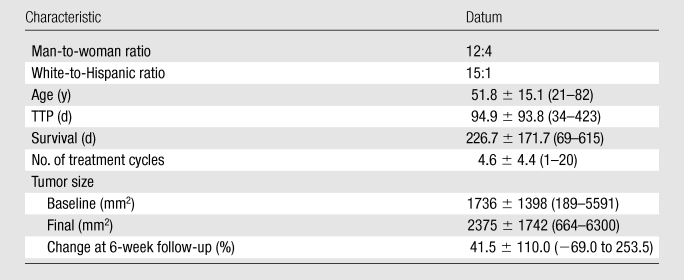
Note.—Unless otherwise specified, data are means ± standard deviations, with ranges in parentheses.
Figure 2:

Kaplan-Meier curve of TTP shows a wide therapy response, with many patients removed from the study around 90 days.
Figure 3 shows T1-weighted and perfusion images and a graph of the distribution of rCBV values in the volume of interest in a 35-year-old man both before and after treatment with bevacizumab. While the T1-weighted images show growth of the tumor, the perfusion images and graph indicate a drop in the perfusion. This demonstrates that tumor size and perfusion may exhibit conflicting trends over time, indicating that they represent different responses to chemotherapy.
Figure 3a:

Representative example of change in perfusion in a 35-year-old man with pathologically confirmed GBM. Top row: baseline. Bottom row: 6-week follow-up. (a) Contrast-enhanced T1-weighted MR images (magnetization-prepared rapid acquisition GRE; repetition time msec/echo time msec, 1950/3.4) were used to measure tumor volume (green). (b) Contrast material leakage corrected rCBV maps (derived from DSC GRE echo-planar MR images; 1500/30) show tumor perfusion (arrows). (c) Graphs show distribution of normalized rCBV values in the enhancing portion of the tumor. Note dramatic reduction in tumor perfusion (arrows in b) despite lack of change in tumor size (green area in a). Number of voxels in which hyperperfusion (rCBV >1.25) was observed correspondingly decreased in c.
Figure 3b:

Representative example of change in perfusion in a 35-year-old man with pathologically confirmed GBM. Top row: baseline. Bottom row: 6-week follow-up. (a) Contrast-enhanced T1-weighted MR images (magnetization-prepared rapid acquisition GRE; repetition time msec/echo time msec, 1950/3.4) were used to measure tumor volume (green). (b) Contrast material leakage corrected rCBV maps (derived from DSC GRE echo-planar MR images; 1500/30) show tumor perfusion (arrows). (c) Graphs show distribution of normalized rCBV values in the enhancing portion of the tumor. Note dramatic reduction in tumor perfusion (arrows in b) despite lack of change in tumor size (green area in a). Number of voxels in which hyperperfusion (rCBV >1.25) was observed correspondingly decreased in c.
Figure 3c:

Representative example of change in perfusion in a 35-year-old man with pathologically confirmed GBM. Top row: baseline. Bottom row: 6-week follow-up. (a) Contrast-enhanced T1-weighted MR images (magnetization-prepared rapid acquisition GRE; repetition time msec/echo time msec, 1950/3.4) were used to measure tumor volume (green). (b) Contrast material leakage corrected rCBV maps (derived from DSC GRE echo-planar MR images; 1500/30) show tumor perfusion (arrows). (c) Graphs show distribution of normalized rCBV values in the enhancing portion of the tumor. Note dramatic reduction in tumor perfusion (arrows in b) despite lack of change in tumor size (green area in a). Number of voxels in which hyperperfusion (rCBV >1.25) was observed correspondingly decreased in c.
The resulting hazard ratios and 95% confidence intervals are reported in Table 3. This table demonstrates the highest hazard ratio was seen with a ΔHPV cutoff of rCBV >1.00 (hazard ratio, 1.077; 95% confidence interval: 1.026, 1.130; P = .002). In general, the only significant ratios greater than one used mean rCBV and ΔHPV, and the ratios were higher after correction for leakage. Both tumor volume (hazard ratio, 1.004; 95% confidence interval: 0.997, 1.011; P = .275) and the leakage coefficient (hazard ratio, 1.001; 95% confidence interval: 0.998, 1.004; P = .608) had confidence intervals that straddled one and P values greater than .05.
Table 3.
Cox Proportional Hazards Analysis

Data in parentheses are 95% confidence intervals.
Discussion
In this pilot study, we have derived an image metric that reflects local perfusion changes in GBMs and have found that this metric (ΔHPV) has a significantly better correlation to TTP than do more commonly used metrics. Specifically, those with a higher TTP are more likely to have a lower ΔHPV. This finding is consistent with results of previous studies by Law et al (7,8) and Cha et al (5,6) that indicate cerebral perfusion measurement with DSC MR imaging is strongly correlated with tumor grade. While in the future finding a specific cutoff that can separate responders from nonresponders will be clinically useful, this technical note provides a method that will help move in that direction.
Our results indicate that measurement of contrast material leakage yields a significant improvement in the data correlation. This was the result despite the fact that, being a retrospective study, we did not have the amount of images at baseline and after contrast enhancement that were used in the method outlined by Boxerman et al (11).
Galban et al (20) demonstrated that parametric response mapping of rCBV can help predict outcome in early cancer treatment. They found that changes in mean rCBV did not correlate to patient survival as well as parametric response mapping did. While the exact patient selection and treatment methods differed between that study and ours, results of both suggest that using cerebral perfusion can help to characterize patient response to treatment.
There were some important limitations to our study that must be considered. Our analysis was based on a retrospective review of patient images; as such, we were unable to ensure that all subjects who were enrolled in the drug trial underwent perfusion MR imaging at the times needed to evaluate the ΔHPV metric, thus limiting the number of patients. Also, the true validity of the predictive power of the HPV parameter must be evaluated in a prospective study. The software is user friendly but requires some training for proper use. This may limit the dissemination of this technology to the broader community, but it could eventually be implemented as a postprocessing tool on any MR imager. Furthermore, the coregistration performed has been validated for MR and PET, but there has been no validation of coregistration of T1-weighted MR images and CBV maps. In addition, the HPV parameter depends on the enhancing volume on magnetization-prepared rapid-acquisition GRE MR images. A study by Batchelor et al (1) showed that enhancing volume tends to drop in response to vascular endothelial growth factor inhibitors. Since HPV is calculated as the percentage of total tumor volume that is enhanced, this effect may artificially increase the HPV after treatment. Finally, the results of our study are based on the treatment of GBMs with bevacizumab. The generalizability of this regression analysis could potentially be limited to this particular agent and this type of tumor. Furthermore, while we varied the HPV cutoff, the limited number of patients in our study precludes a generalizable conclusion about the cutoff. For the purposes of optimization of cutoff values, the regression model we propose should be included for larger patient studies, a wider array of tumor pathologies, and other angiogenic inhibitors.
As mentioned in the introduction, recent work has used dynamic contrast-enhanced–based CBV and the leakage coefficient K trans as an alternative to DSC-based imaging. We used DSC-based perfusion measurement with leakage correction. Dynamic contrast-enhanced imaging has been shown to have an equally strong correlation to tumor grade, both with measurement of CBV and K trans (12,13). In addition, there have been conflicting reports on the comparison of DSC versus dynamic contrast-enhanced imaging and which one shows a stronger correlation to tumor grade (13,21). It would be worthwhile to explore the application of the method in our study to dynamic contrast-enhanced–based measurement.
In future investigations, we plan to study the utility of the HPV parameter for characterizing other malignant gliomas in addition to GBMs. Furthermore, it will be instructive to see whether HPV can predict response to other antiangiogenic therapies, including combination therapies (eg, bevacizumab plus irinotecan, a mitosis inhibitor) that are currently being evaluated.
In conclusion, we have derived an imaging metric that combines T1-weighted MR images and CBV maps to determine the response to antiangiogenic chemotherapy. In those patients that respond to angiogenic inhibition, a drop in intratumoral perfusion is seen on MR images. Preliminary data indicate that the HPV parameter correlates well with a tumor’s response to therapy. Patient response to bevacizumab is unknown until there is clinical decline or radiologic progression. In clinical practice, knowing which patients will respond better to treatment is important to the individualization of care. Thus, MR perfusion imaging and, specifically, the HPV parameter can be useful methods for tailoring treatment and improving patient outcomes.
Advance in Knowledge.
Hyperperfusion volume (HPV) is an imaging metric that reflects local perfusion changes in glioblastomas and shows significant correlation to time to progression compared with more commonly used metrics.
Implication for Patient Care.
HPV can predict patient response to antiangiogenic chemotherapy, thus helping the physician to tailor treatment and improve patient outcome.
Acknowledgments
We thank Ann Ragin, PhD, for her contributions to this manuscript.
Received July 28, 2009; revision requested September 4; revision received October 2; accepted October 14; final version accepted November 16.
Funding: This research was supported by National Institutes of Health (grants R01 NS0493395 and AHA 0655758Z).
See Materials and Methods for pertinent disclosures.
Abbreviations:
- CBV
- cerebral blood volume
- ΔHPV
- percent change in HPV
- DSC
- dynamic susceptibility-weighted contrast material–enhanced
- FLAIR
- fluid-attenuated inversion recovery
- GBM
- glioblastoma multiforme
- GRE
- gradient echo
- HPV
- hyperperfusion volume
- rCBV
- relative CBV
- TTP
- time to progression
References
- 1.Batchelor TT, Sorensen AG, di Tomaso E, et al. AZD2171, a pan-VEGF receptor tyrosine kinase inhibitor, normalizes tumor vasculature and alleviates edema in glioblastoma patients. Cancer Cell 2007;11(1):83–95 [DOI] [PMC free article] [PubMed] [Google Scholar]
- 2.Rosen BR, Belliveau JW, Vevea JM, Brady TJ. Perfusion imaging with NMR contrast agents. Magn Reson Med 1990;14(2):249–265 [DOI] [PubMed] [Google Scholar]
- 3.Rosen BR, Belliveau JW, Buchbinder BR, et al. Contrast agents and cerebral hemodynamics. Magn Reson Med 1991;19(2):285–292 [DOI] [PubMed] [Google Scholar]
- 4.Rosen BR, Belliveau JW, Aronen HJ, et al. Susceptibility contrast imaging of cerebral blood volume: human experience. Magn Reson Med 1991;22(2):293–299, discussion 300–303 [DOI] [PubMed] [Google Scholar]
- 5.Cha S. Perfusion MR imaging of brain tumors. Top Magn Reson Imaging 2004;15(5):279–289 [DOI] [PubMed] [Google Scholar]
- 6.Cha S, Tihan T, Crawford F, et al. Differentiation of low-grade oligodendrogliomas from low-grade astrocytomas by using quantitative blood-volume measurements derived from dynamic susceptibility contrast-enhanced MR imaging. AJNR Am J Neuroradiol 2005;26(2):266–273 [PMC free article] [PubMed] [Google Scholar]
- 7.Law M, Yang S, Wang H, et al. Glioma grading: sensitivity, specificity, and predictive values of perfusion MR imaging and proton MR spectroscopic imaging compared with conventional MR imaging. AJNR Am J Neuroradiol 2003;24(10):1989–1998 [PMC free article] [PubMed] [Google Scholar]
- 8.Law M, Oh S, Babb JS, et al. Low-grade gliomas: dynamic susceptibility-weighted contrast-enhanced perfusion MR imaging—prediction of patient clinical response. Radiology 2006;238(2):658–667 [DOI] [PubMed] [Google Scholar]
- 9.Quarles CC, Ward BD, Schmainda KM. Improving the reliability of obtaining tumor hemodynamic parameters in the presence of contrast agent extravasation. Magn Reson Med 2005;53(6):1307–1316 [DOI] [PubMed] [Google Scholar]
- 10.Schmainda KM, Rand SD, Joseph AM, et al. Characterization of a first-pass gradient-echo spin-echo method to predict brain tumor grade and angiogenesis. AJNR Am J Neuroradiol 2004;25(9):1524–1532 [PMC free article] [PubMed] [Google Scholar]
- 11.Boxerman JL, Schmainda KM, Weisskoff RM. Relative cerebral blood volume maps corrected for contrast agent extravasation significantly correlate with glioma tumor grade, whereas uncorrected maps do not. AJNR Am J Neuroradiol 2006;27(4):859–867 [PMC free article] [PubMed] [Google Scholar]
- 12.Sorensen AG, Batchelor TT, Zhang WT, et al. A “vascular normalization index” as potential mechanistic biomarker to predict survival after a single dose of cediranib in recurrent glioblastoma patients. Cancer Res 2009;69(13):5296–5300 [DOI] [PMC free article] [PubMed] [Google Scholar]
- 13.Mills SJ, Patankar TA, Haroon HA, Balériaux D, Swindell R, Jackson A. Do cerebral blood volume and contrast transfer coefficient predict prognosis in human glioma? AJNR Am J Neuroradiol 2006;27(4):853–858 [PMC free article] [PubMed] [Google Scholar]
- 14.Donahue KM, Weisskoff RM, Chesler DA, et al. Improving MR quantification of regional blood volume with intravascular T1 contrast agents: accuracy, precision, and water exchange. Magn Reson Med 1996;36(6):858–867 [DOI] [PubMed] [Google Scholar]
- 15.Macdonald DR, Cascino TL, Schold SC, Jr, Cairncross JG. Response criteria for phase II studies of supratentorial malignant glioma. J Clin Oncol 1990;8(7):1277–1280 [DOI] [PubMed] [Google Scholar]
- 16.Shin W, Horowitz S, Ragin A, Chen Y, Walker M, Carroll TJ. Quantitative cerebral perfusion using dynamic susceptibility contrast MRI: evaluation of reproducibility and age- and gender-dependence with fully automatic image postprocessing algorithm. Magn Reson Med 2007;58(6):1232–1241 [DOI] [PubMed] [Google Scholar]
- 17.Carroll TJ, Rowley HA, Haughton VM. Automatic calculation of the arterial input function for cerebral perfusion imaging with MR imaging. Radiology 2003;227(2):593–600 [DOI] [PubMed] [Google Scholar]
- 18.Kiebel SJ, Ashburner J, Poline JB, Friston KJ. MRI and PET coregistration: a cross validation of statistical parametric mapping and automated image registration. Neuroimage 1997;5(4 pt 1):271–279 [DOI] [PubMed] [Google Scholar]
- 19.Law M, Young R, Babb J, Pollack E, Johnson G. Histogram analysis versus region of interest analysis of dynamic susceptibility contrast perfusion MR imaging data in the grading of cerebral gliomas. AJNR Am J Neuroradiol 2007;28(4):761–766 [PMC free article] [PubMed] [Google Scholar]
- 20.Galbán CJ, Chenevert TL, Meyer CR, et al. The parametric response map is an imaging biomarker for early cancer treatment outcome. Nat Med 2009;15(5):572–576 [DOI] [PMC free article] [PubMed] [Google Scholar]
- 21.Law M, Yang S, Babb JS, et al. Comparison of cerebral blood volume and vascular permeability from dynamic susceptibility contrast-enhanced perfusion MR imaging with glioma grade. AJNR Am J Neuroradiol 2004;25(5):746–755 [PMC free article] [PubMed] [Google Scholar]