Acetabular cartilage thickness can be estimated to approximately ±0.5 mm of the true value with 95% tolerance when cartilage geometry is semiautomatically reconstructed from multidetector CT arthrographic image data by using commercial segmentation software.
Abstract
Purpose:
To prospectively quantify the accuracy of hip cartilage thickness estimated from three-dimensional (3D) surfaces, generated by segmenting multidetector computed tomographic (CT) arthrograms by using direct physical measurements of cartilage thickness as the reference standard.
Materials and Methods:
Four fresh-frozen cadaver hip joints from two male donors, ages 43 and 46 years, were obtained; institutional review board approval for cadaver research was also obtained. Sixteen holes were drilled perpendicular to the cartilage of four cadaveric acetabula (two specimens). Hip capsules were surgically closed, injected with contrast material, and scanned by using multidetector CT. After scanning, 5.3-mmcores were harvested concentrically at each drill hole and cartilage thickness was measured with a microscope. Cartilage was reconstructed in 3D by using commercial software. Segmentations were repeated by two authors. Reconstructed cartilage thickness was determined by using a published algorithm. Bland-Altman plots and linear regression were used to assess accuracy. Repeatability was quantified by using the coefficient of variation, intraclass correlation coefficient (ICC), repeatability coefficient, and percentage variability.
Results:
Cartilage was reconstructed to a bias of −0.13 mm and a repeatability coefficient of ±0.46 mm. Regression of the scatterplots indicated a tendency for multidetector CT to overestimate thickness. Intra- and interobserver repeatability were very good. For intraobserver correlation, the coefficient of variation was 14.80%, the ICC was 0.88, the repeatability coefficient was 0.55 mm, and the percentage variability was 11.77%. For interobserver correlation, the coefficient of variation was 13.47%, the ICC was 0.90, the repeatability coefficient was 0.52 mm, and the percentage variability was 11.63%.
Conclusion:
Assuming that an accuracy of approximately ±0.5 mm is sufficient, reconstructions of cartilage geometry from multidetector CT arthrographic data could be used as a preoperative surgical planning tool.
Introduction
Accurate quantification of cartilage thickness is a critical factor to address prior to choosing the optimum treatment for patients with hip pain (1–3). Because the hip joint is geometrically complex, visualization of cartilage thickness relative to the underlying three-dimensional (3D) morphologic characteristics could prove essential to the diagnosis and treatment of hip joint cartilage pathologic anomalies (4). Three-dimensional representations of hip cartilage could provide a spatial map of cartilage thickness to augment our understanding of morphologically abnormal hips or those with osteoarthritis. For example, evidence from one study (5) suggests that cartilage may actually swell in the early stages of osteoarthritis. It would be useful, therefore, to quantify cartilage thickness by using computed tomographic (CT) arthrography in patients who complain of pain that may be related to osteoarthritis but do not have direct evidence of radiographic thinning or localized defects. Further, quantification of cartilage loss for longitudinal studies and the development of guidelines for interpretation of biomechanical models are made possible with 3D representations of hyaline cartilage (1,2,6–9).
As a supplement to radiography, advanced imaging techniques, such as magnetic resonance (MR) imaging and multidetector CT arthrography, can help clarify the extent of cartilage damage in the hip joint (1,2,8,10–13). However, evidence suggests that multidetector CT arthrography may be more sensitive than MR imaging for helping detect hyaline cartilage lesions (2,14). CT arthrography has also been shown to be more accurate than MR arthrography for estimating cartilage thickness in the hip (15), ankle (16), and knee (17). However, the accuracy of hip cartilage thickness measured from 3D reconstructions of multidetector CT arthrographic image data has not been assessed. Three-dimensional reconstruction of hip joint hyaline cartilage from multidetector CT arthrograms poses unique difficulties that preclude extrapolation of two-dimensional thickness measurement errors from prior imaging studies. For example, the high degree of concavity of the hip joint may predispose multidetector CT images to more extensive oblique sampling and out-of-plane curvature errors, which may be exacerbated when reconstructed in 3D.
Methods to generate 3D images of cartilage surfaces by using CT or MR have been described for the hip (1,2,8,18) and other diarthroidal joints (17,19–25). However, prior reconstructions relied on custom algorithms (1,2,8,17,19,21–25), or proprietary software (20) that are not readily available for direct clinical application. Thus, the purpose of our study was to prospectivelyquantify the accuracy of hip cartilage thickness estimated from 3D surfaces, generated by segmenting multidetector CT arthrograms, by using direct physical measurements of cartilage thickness as the reference standard.
Materials and Methods
Specimen Preparation
Four fresh-frozen cadaver hip joints from two male donors, ages 43 and 46 years, were obtained and used with institutional review board approval for cadaver research. The hips were dissected free of musculoskeletal tissues, leaving the cartilage, labrum, and hip joint capsule intact. A transverse arthrotomy was performed on one-half of the circumference of the joint capsule. The hip was disarticulated after division of the ligamentum teres and the joint was visually inspected by an orthopedic surgeon (B.C.A., with 5 years experience) for cartilage damage.
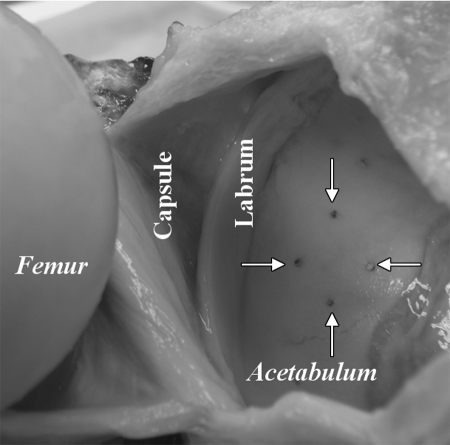
The joint was prepared for imaging by using a previously described technique (16). The acetabulur lunate surface was divided in four quadrants (anteroinferior, anterosuperior, posterosuperior, and posteroinferior). A 1.5-mm-diameter drill bit (Synthes North America, West Chester, Pa) was aligned perpendicular to the articular surface and, using a trauma drill (model 2102, Stryker Instruments, Kalamazoo, Mich) and light steady pressure, was advanced through the articular cartilage approximately 1 cm into the subchondral bone of the acetabulum. Four drill holes, oriented in a diamond-shaped pattern (Fig 1), were made in each of the four quadrants: one each medial and lateral, and two midline, for a total of 16 holes per specimen. The joint was rearticulated and a water-tight capsular closure was performed by using a running stitch.
Figure 1:
Photograph of disarticulated hip joint shows femoral head, capsule, labrum, and acetabulum. Four drill holes were created perpendicular to cartilage surface in a diamond pattern in four quadrants of acetabulum. Arrows = drill holes in posterosuperior quadrant (prior to harvest of cores).
Multidetector CT Arthrography
By using a 21-g needle, specimens were injected with 20 mL of contrast material (Omnipaque 300; Amersham Health, Princeton, NJ). This volume represents the upper boundary of what has been reported for clinical injections (2,26–32), but was necessary to obtain full capsular distension owing to the lack of musculature surrounding the capsule, and is consistent with a prior cadaver hip multidetector CT imaging study (33). Specimens were scanned in neutral anatomic position (anterior superior iliac spines in plane with the pubis symphysis joint) by using a 16-section CT scanner (SOMATOM Emotion 16; Siemens Medical Solutions, Malvern, Pa) by using the following parameters: 16 detector rows of 0.6 mm each; collimation, 120 kVp; tube charge, 150 mAs; and pitch, 1.5 (helical scan). Images were reconstructed with an acquisition matrix of 512 × 512, a field of view of 160 mm, and an axial section thickness of 0.75 mm (0.32 × 0.32 × 0.75 mm resolution). This protocol yielded a radiation dose of 6.47 mGy, as estimated by the CT scanner.
Physical Measurements of Acetabular Cartilage Thickness
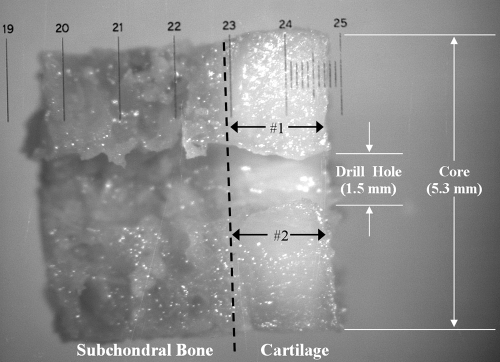
Each hip was disarticulated. A 5.3-mm modified trephine (Stryker Instruments) and a custom 1.5-mm centering post were used to harvest cores as described previously (16), with each core bisected longitudinally, centered over the drill hole. Cores were placed on a microscopic stage (Eclipse E-600; Nikon, Melville, NY) with an optical measuring grid overlying the bisected edge of the cartilage sample. A microscopic image was obtained by using a digital camera (60800; Optronics, Goleta, Calif) at a magnification of ×40 (Fig 2). Images were transferred to a PC (nx5000; Hewlett-Packard, Palo Alto, Calif) and analyzed by using software (Document Imaging, version 11.0.1897.0; Microsoft, Redmond, Wash). After calibration with the optical grid, two measurements were obtained (B.C.A.), one from each side of the drill hole, and were averaged for a single value for cartilage thickness.
Figure 2:
Digital microscopic image (magnification, 40×) of bisected acetabular osteochondral core shows interface of subchondral bone and cartilage (dashed line); 1.5-mm diameter hole drilled prior to multidetector CT arthrography served as a fiducial in image data. After imaging, 5.3-mm osteochondral cores were harvested around drill hole center. Physical measurements of core cartilage thickness were acquired at locations (black arrows) adjacent to drill hole. Optical measuring grid, with 0.10-mm markings, is visible. White arrows = dimensions of hole and core.
3D Reconstructions of Acetabular Cartilage Geometry
Segmentation of image data was performed by using software (Mimics, version 10.1; Materialise, Leuven, Belgium). Each dataset was automatically given a threshold level by using a masking technique, which allows the user to highlight pixels over a specific range of signal intensities. A baseline threshold level mask was defined separately for cartilage and bone/cartilage interface by using a protocol previously shown to result in accurate reconstructions of cartilage and bone (34,35). Pixels exclusively representing air for several image sections were queried to determine the maximum pixel signal intensity, which served as the minimum threshold level value for cartilage. The maximum signal intensity for cartilage was defined as the minimum pixel value that represented bone, which was determined in a similar fashion by querying pixels thought to exclusively define cortical bone. A similar approach was used to define the threshold level range for cortical bone. Specifically, the upper threshold level of cartilage was defined as the minimum signal intensity for bone. The maximum intensity for bone was set to the minimum pixel value of contrast agent, defined by querying pixels thought to exclusively represent the contrast agent. The aforementioned approach to determine the threshold level was performed independently for each hip joint scan to ensure that any fluctuation between CT scans was not a confounding factor. Finally, areas where cartilage cores were harvested were identified by using a separate mask to provide fiducials for referencing the locations of experimentally measured cartilage thickness.
Manual segmentation was required in areas of thinned cartilage or less dense bone. Regions where pixels blended together were separated by using a paintbrush tool available in the Mimics program so that the resulting outline of pixels followed the cartilage/contrast agent or bone/cartilage boundary. Manual segmentation required approximately 2 hours for each hip. Because manual segmentation could introduce a degree of intra- and interobserver repeatability, each CT dataset was resegmented (B.C.A.) following a time lapse of 6 months. In addition, each dataset was segmented to quantify interobserver repeatability (A.E.A.).
Polygonal surfaces of the outer layers of the acetabular cartilage and subchondral bone were created by using Mimics (Fig 3) and analyzed for cartilage thickness by using a published algorithm (35). Cartilage thickness was visualized at each node as a fringe plot by using free software (LS-PREPOST 2 Beta PC; Livermore Software Technology, Livermore, Calif) designed for visualizing finite element results. Locations of the drill holes were identified by visualizing the fiducials adjacent to the reconstructed cartilage surface and approximately 18 nodes (mean, 17.8 ± 4.6 [standard deviation]) were queried circumferentially around the hole to obtain estimates of cartilage thickness. These data were averaged to determine a single value.
Figure 3a:
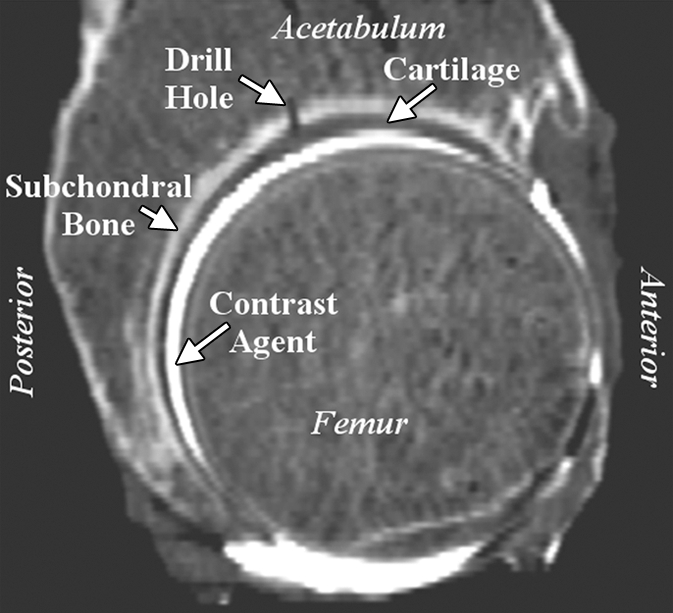
Representative right acetabulum. (a) Sagittal multidetector CT arthrogram shows 1.5-mm drill hole, cartilage, contrast agent, and subchondral bone (arrows). Note that drill hole was not filled with contrast agent, presumably owing to surface tension and high viscosity of the solution. (b) Lateral oblique 3D reconstruction of bone (dark gray) and cartilage (light gray) after semiautomatic segmentation.
Figure 3b:
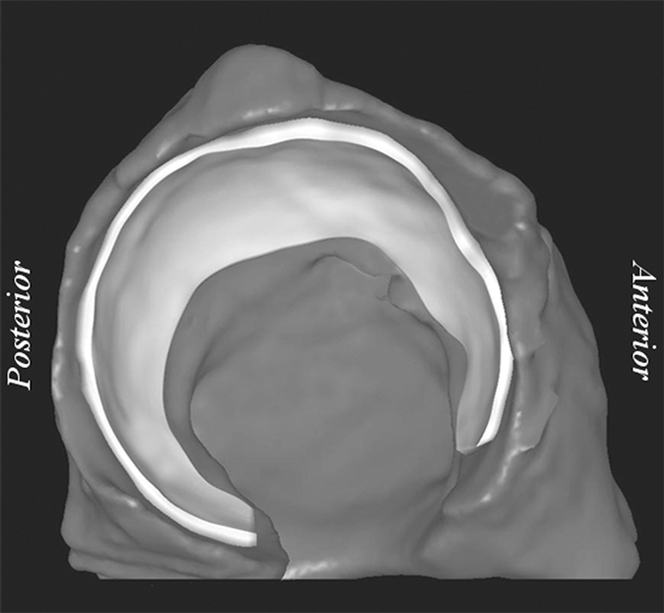
Representative right acetabulum. (a) Sagittal multidetector CT arthrogram shows 1.5-mm drill hole, cartilage, contrast agent, and subchondral bone (arrows). Note that drill hole was not filled with contrast agent, presumably owing to surface tension and high viscosity of the solution. (b) Lateral oblique 3D reconstruction of bone (dark gray) and cartilage (light gray) after semiautomatic segmentation.
Statistical Analysis
A Bland-Altman plot (36), including 95% tolerance intervals (estimated as 1.96 times the standard deviation of the differences) (37), was generated to quantify agreement between multidetector CT–based estimates of cartilage thickness and physical measurements, and included both segmentation trials (B.C.A.). This specific form of a 95% tolerance interval, which Bland and Altman called the limits of agreement, assumes that the individual paired differences of the two methods are normally distributed. Therefore, the mean value ± 1.96 (standard deviation) is the boundary of the middle 95% of these difference pairs. Inter- and intraobserver repeatability was quantified by using the coefficient of variation, intraclass correlation coefficient (ICC), repeatability coefficient, and percentage variability by using statistical software (SPSS, version 11.5 for Windows, 2002; SPSS, Chicago, Ill). Linear regression was also performed to assess the relationship between physical and multidetector CT measurements of cartilage thickness. Bland-Altman and linear regression plots were generated by using graphic software (Sigmaplot, version 8.0 for Windows, 2002; Systat Software, San Jose, Calif).
In this dataset, multiple measurements were obtained from the same hip (n = 4) and the same cadaver (n = 2). To account for data clustering, the variance was multiplied by the design effect, DE (38): DE = 1 + (n − 1)(ICC), where n is the average cluster size (38). This equation provides a correct estimate of variance (ie, design effect) that is larger than the variance computed without accounting for clustering effects for a nonzero ICC. The ICC was computed at the hip level and cadaver level of clustering. Both ICCs were zero (truncated to six decimal places). Therefore, the variance was not increased and applying conventional statistical methods that assume independence of observations was deemed appropriate.
Results
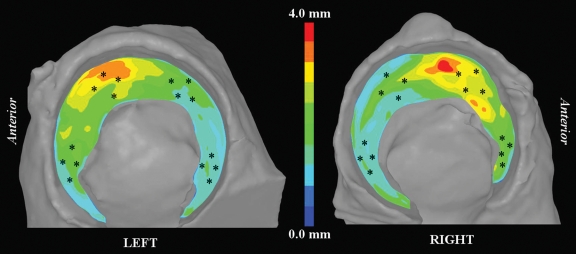
Cartilage thickness for the four acetabula ranged from 1.13 to 3.49 mm (mean, 1.82 mm ± 0.48), as measured experimentally and from 1.06 to 4.03 (mean, 1.88 mm ± 0.58), as estimated from the 3D reconstructions of multidetector CT image data (both observers, both trials). Color fringe plots of reconstructed cartilage depicted thicker cartilage along the proximal roof with thinner cartilage at the posterior lunate surface (Fig 4).
Figure 4:
Fringe plots of acetabular cartilage thickness for left and right hips of one specimen. Thicker cartilage dominated anterosuperior region; thinner cartilage was predominately confined to posterior lunate surface. * = approximate locations of physical measurements.
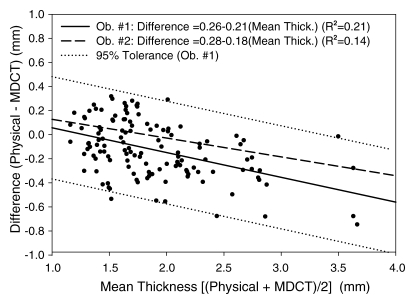
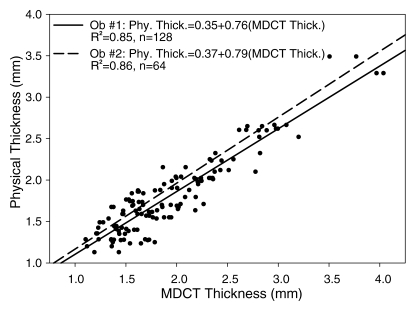
Analysis of the Bland-Altman plot as a combined dataset of both trials from observer 1 (B.C.A.) (Fig 5) demonstrated that cartilage was reconstructed to a bias of −0.13 mm (average difference between physical and multidetector CT thickness measurements) and repeatability coefficient (1.96 × the standard deviation of the differences between physical and multidetector CT) of ±0.46 mm. Regression of the difference (physical measurements − multidetector CT measurements) to the average ([physical measurements + multidetector CT measurements]/2) for both trials of observer 1 yielded a significant (P < .001) negative relationship (difference = 0.26−0.21 × mean thickness; R 2 = 0.22), indicating that there was tendency for multidetector CT to overestimate thickness when cartilage was greater than approximately 1.25 mm thick, and to underestimate thickness when cartilage was less than approximately 1.25 mm (Fig 5). Only four data points were outside the 95% tolerance interval (estimated as 1.96 times the standard deviation of the differences), which was 0.85 and 0.90 mm wide at the lower and upper boundaries of cartilage thickness analyzed, respectively (Fig 5). Regression of the Bland-Altman plot for observer 2 yielded a best-fit line (difference = 0.28−0.18 × mean thickness; R 2 = 0.14) that was very similar to observer 1 (Fig 5). Linear regression of physical measurements versus multidetector CT for both trials of observer 1 (Fig 6) yielded a significant (P < .001) relationship (physical thickness = 0.35 + 0.76 × multidetector CT thickness; R 2 = 0.85). Linear regression of data from observer 2 was nearly identical (physical thickness = 0.37 + 0.79 × multidetector CT thickness; R 2 = 0.86) (Fig 6).
Figure 5:
Bland-Altman plot shows data for mean cartilage thickness plotted against difference. Data points for both trials of observer 1 (Ob. #1) are plotted. Best-fit lines for observers 1 (solid line) and 2 (Ob. #2, dashed line) were nearly identical. Dotted lines = 95% tolerance interval for observer 1. Equations for both best-fit lines indicated tendency for multidetector CT (MDCT) to respectively over- and underestimate cartilage thicker and thinner than approximately 1.25 mm.
Figure 6:
Scatterplot of physical measurements (Phy. Thick.) of cartilage thickness plotted against multidetector CT measurements (MDCT. Thick.). Data points for both trials of observer 1 (Ob. #1) are plotted. Linear regressions of observers 1 (solid line) and 2 (Ob. #2, dashed line) indicated tendency for multidetector CT to overestimate thickness measurements. Strong coefficients of determination (R 2) demonstrated that 3D reconstructions of multidetector CT images are well suited to measure acetabular cartilage thickness.
The intra- and interobserver reproducibility of cartilage thickness as estimated from surfaces reconstructed from multidetector CT data were very good. For intraobserver correlation, the coefficient of variation was 14.80%, the ICC was 0.88, the repeatability coefficient was 0.55 mm, and the percentage variability was 11.77%. For interobserver correlation, the coefficient of variation was 13.47%, the ICC was 0.90, the repeatability coefficient was 0.52 mm, and the percentage variability was 11.63%.
Discussion
We quantified the accuracy of hip cartilage thickness measured from 3D surfaces generated by segmentation of multidetector CT arthrograms with commercial software. The magnitude and spatial distribution of acetabular cartilage thickness in the cadaver hips analyzed in our study were in good agreement with previous data (7,39–42). Shepherd and Seedhom (42) measured acetabular cartilage thickness in cadaver hips and yielded an average thickness of 1.20–2.25 mm (1.50 ± 0.29) (42). Mean acetabular cartilage thickness measured by Adam et al (39) was 0.85–1.72 mm, with maximum thickness values ranging from 1.43 from 3.14 mm. In our study, the thickest cartilage was found to occupy the superior quadrants, which also parallels results by Shepherd and Seedhom (42) and Athanasiou et al (40).
Linear regression of physical versus multidetector CT thickness data demonstrated a tendency for cartilage thickness to be overestimated by multidetector CT. Regression of the Bland-Altman plot also suggested that cartilage thickness was overestimated. However, unlike the regression equation, the best-fit line of the Bland-Altman plot crossed the y-axis at a thickness value within that measured in our study (approximately 1.25 mm), which indicated that multidetector CT respectively under- and overestimated the true thickness of cartilage when it was thinner or thicker than approximately 1.25 mm. Assuming consistent threshold levels were acquired, a possible explanation for this finding is as follows: when cartilage is surrounded by thicker, more radiopaque medium (ie, bone, contrast agent) there will be a net effect of perceived cartilage thinning owing to volumetric averaging between adjacent pixels. However, because volumetric averaging acts in both directions (ie, brighter pixels will appear darker when averaged with radiolucent pixels), cartilage that is thicker than the surrounding bone and contrast agent will cause thickness measurements to be overestimated.
It has been previously shown that CT volumetric averaging is dependent on the spatial resolution of the image data, the thickness of the imaged object, and the orientation of the section plane with respect to the object’s curvature (34,43–45). The width of the CT beam collimation and the full width at half maximum (FWHM) of the section sensitivity profile also dictates the perceived thickness of thin objects imaged by using multidetector CT (43,44). Reconstruction errors increase in near-exponential fashion (34,35,43,44) as the thickness of the object imaged falls below the FWHM (approximately 0.7 mm has been cited for a clinical multidetector CT scanner [43,44]). While we did not query cartilage with a thickness less than the FWHM of our CT scanner, the pixel resolution used in this study was below the FWHM. Therefore, volumetric averaging likely occurred beyond the single interface of adjacent pixels.
Our reported bias error equates to roughly a 5% error in terms of the average physical thickness value, which is in good agreement with results reported by Anderson et al (34), who demonstrated an error of less than 10% when simulated cartilage greater than 1.0 mm thick was reconstructed by using commercial software in a phantom study. Wyler et al (46) assessed the accuracy of multidetector CT arthrography in the hip joint by comparing physical measurements of cartilage thickness from anatomic slices to measurements acquired from multidetector CT arthrograms. They reported a mean difference between the two measurements of 0.30 mm ± 0.52 (standard error of the mean) (46), which is substantially larger than our mean error (ie, bias) of −0.13 mm ± 0.06 mm. The Bland-Altman plot reported by Wyler et al (46) demonstrated that, with 95% confidence (as assessed by the standard error), the mean difference between physical and CT-based measurements would be between −1.34 to 0.74 mm, which was approximately double the width of our tolerance interval (as assessed by the standard deviation). In addition, they reported a poor interobserver repeatability coefficient of 0.22, which was attributed to differences in the positioning of measurements between observers (46). The destructive nature of their experimental protocol (0.5-mm-thick coronal slices were cut prior to physical measurement) may also explain why repeatability was poor and errors were greater than in our study (46).
El-Khoury et al (16) compared ankle cartilage measurements obtained from multidetector CT arthrograms with physical measurements obtained from excised cores taken from cadaveric ankles (range, 1–2 mm thick) and reported an R 2 = 0.81, which is nearly identical to our study (R 2 = 0.85). An independent analysis of their raw data resulted in a bias value of 0.09 mm and repeatability coefficient of ±0.24 mm, which was slightly better than our results. Inspection of the best-fit regression line reported by El-Khoury et al indicated that multidetector CT had a tendency to underestimate thickness, whereas we observed an overestimation. One explanation for this discrepancy could be that El-Khoury et al analyzed single-image sections to estimate thickness rather than obtain these data from 3D reconstructions. Three-dimensional reconstruction accuracy of cartilage has been shown as inferior to in-plane estimates made from an MR imaging study of femoral cartilage (18). In addition, El-Khoury et al acquired images in the coronal plane of the ankle joint, transverse to the direction of curvature, which likely reduced volumetric averaging and staircase artifact. Three-dimensional reconstructions created on the basis of images acquired transverse to the direction of curvature resulted in lower errors than reconstructions of images acquired longitudinally (34,45,47). Repositioning of the hip joint in the CT scanner would likely have little effect because the hip joint is nearly spherical (48,49), and any imaging plane chosen is destined to initiate staircase artifact and volumetric averaging.
Several studies have quantified cartilage thickness by using MR imaging. McGibbon et al (18) reported both the in-plane and out-of-plane (3D reconstruction) accuracy of MR imaging for resolving the thickness of femoral subchondral bone and articular cartilage. They determined that 3D reconstruction errors were higher than in-plane errors, with a bias of −0.14 mm and absolute average error of ±0.32 mm, which can be roughly estimated as the width of the 95% tolerance interval (18). Nishii et al (8) described a method for determining acetabular cartilage thickness and reported mean errors of ±0.28 mm with an R 2 of 0.79. Cohen et al (19) compared cartilage thickness measurements of cadaveric knees using a B-spline curve-fitting technique that was compared with a highly accurate stereophotogrammetric measurement technique (50) and reported a mean error of 0.31 mm with 95% of the measurements within 0.62 mm, on average. Overall, these results, when compared with our data, suggest that MR imaging is equal to or slightly less accurate than multidetector CT for quantifying cartilage thickness. However, ionizing radiation exposure to organs such as the gonads, prostate, and bladder should be carefully considered when using multidetector CT.
There were limitations to our study that warrant discussion. We assessed the accuracy of cartilage thickness in normal hips. However, diseased hips may have thinner cartilage. Thus, our approach of generating 3D models of cartilage geometry should only be utilized for patients without radiographic evidence of cartilage thinning. Nevertheless, evidence suggests that cartilage may be thicker than normal in hips with early osteoarthritis and dysplasia (8). While CT arthrography allows one to delineate acetabular from femoral cartilage, the technique is limited because the boundary between cartilage and adjacent soft tissues such as the labrum cannot be clearly distinguished. However, because our study measured cartilage thickness in the weight-bearing region of the acetabulum, away from surrounding soft tissues, it was not necessary to clearly define these boundaries. Nevertheless, measures of cartilage thickness at the periphery should be interpreted with caution. In addition, although our choice of arthrography protocol was based on protocols commonly performed in live patients, there were some notable differences. We chose to use a full concentration of contrast agent. However, contrast agent is often diluted in clinical arthrography by using saline or a local anesthetic (30). It has recently been shown that a diluted contrast agent initiates less volumetric averaging that directly translates to more accurate 3D reconstructions (34). We chose to use a full concentration of contrast agent to guarantee a homogenous solution and ensure consistent determination of threshold level of cartilage from the image data. Absorption of contrast agent in the cartilage could skew measurements of cartilage thickness. However, each specimen was scanned within 5 minutes following injection. Diffusion of contrast agent in cartilage is nearly nonexistent in the first 45 minutes and it has been shown that Omnipaque may take more than 29 hours to completely diffuse in cartilage (51–54). Therefore, it is unlikely that the contrast agent was absorbed by the cartilage to any appreciable degree.
Although manual segmentation could compromise the accuracy of the 3D reconstruction, the width of the 95% tolerance intervals of the Bland-Altman plot (±0.46 mm) was only slighter larger than the pixel resolution used in our study (0.32 mm) and was less than the FWHM of the scanner. Raynauld et al (22) quantified knee cartilage volume by using a subvoxel segmentation method and reported intra correlation coefficients ranging from 0.94 to 0.99. Eckstein et al (21) quantified knee joint cartilage volume by using a region-growing algorithm and reported inter- and intraobserver repeatability coefficient of variation of less than 4.6%. Stammberger et al (25) reported interobserver coefficients of variation in thickness between 3.3% and 13.6% by using a B-spline snakes approach. While our values of intra- and interobserver are slightly higher than the aforementioned studies, cartilage is statistically thicker (39) and arguably easier to visualize and segment in the knee than it is in the hip. Hip joint cartilage has been shown to have thickness deviations on the order of 32% (39). Our maximum coefficient of variation (13.47%) is well below this value, which indicates that our simplified approach to quantify cartilage thickness is well suited for most clinical applications.
In a knee MR imaging study, Stammberger et al (25) demonstrated that automatic segmentation was as much as 3.6 times better than manual segmentation for quantifying maximum cartilage thickness and volume. However, Anderson et al (34) used both automatic and manual segmentation in a phantom multidetector CT arthrographic study and concluded, following a comparison of standard deviations between the two techniques, that use of manual segmentation did not increase reconstruction errors when compared with automatic segmentation. Cohen et al (19) found similar results when using MR: the maximum difference between the two techniques was 0.01 mm. While automatic segmentation would be advantageous by eliminating intra- and interobserver variation and represent a substantial time savings, it was not possible to separate cartilage from subchondral bone and contrast agent by using a single range of pixel intensities.
In conclusion, our results demonstrate that acetabular cartilage thickness can be estimated to approximately ±0.5 mm of the true value with 95% tolerance when cartilage geometry is semiautomatically reconstructed from multidetector CT arthrographic data by using commercial segmentation software. Very good intra- and interobserver agreement suggests that cartilage thickness can be estimated by a clinician or basic science researcher with nearly equal results. Our segmentation protocol was based on the use of commercial segmentation software. Therefore, the approach described herein is more adaptable to the clinical setting than are methods that rely on custom algorithms and software that is not readily available to clinicians and scientists alike.
Advances in Knowledge.
Acetabular cartilage thickness can be estimated within ±0.46 mm of the true value with 95% tolerance from three-dimensional surfaces that were semiautomatically reconstructed from multidetector CT arthrograms.
By using commercial segmentation software, acetabular cartilage thickness can be estimated with very good inter-and intraobserver reproducibility.
Implication for Patient Care.
Assuming that an accuracy of approximately ±0.5 mm is sufficient, reconstruction of acetabular cartilage geometry from multidetector CT arthrographic data could potentially be used as a preoperative planning tool.
Acknowledgments
The authors thank the University of Iowa, Department of Orthopaedics, for providing the equipment for specimen preparation and harvest; the Salt Lake City VA Medical Center Bone and Joint Laboratory for use of their equipment; Julia Crim, MD, for her guidance on imaging protocols, and Greg Stoddard, MSTAT, for statistical consultation.
Received October 22, 2008; revision requested December 12; revision received November 4, 2009; accepted November 11; final version accepted November 16.
Funding: This research was supported by the National Institutes of Health (grant RO1 AR053344).
Authors stated no financial relationship to disclose.
Abbreviations:
- FWHM
- full width at half maximum
- ICC
- intraclass correlation coefficient
- 3D
- three-dimensional
References
- 1.Nishii T, Sugano N, Tanaka H, Nakanishi K, Ohzono K, Yoshikawa H. Articular cartilage abnormalities in dysplastic hips without joint space narrowing. Clin Orthop Relat Res 2001;(383):183–190 [DOI] [PubMed] [Google Scholar]
- 2.Nishii T, Tanaka H, Nakanishi K, Sugano N, Miki H, Yoshikawa H. Fat-suppressed 3D spoiled gradient-echo MRI and MDCT arthrography of articular cartilage in patients with hip dysplasia. AJR Am J Roentgenol 2005;185(2):379–385 [DOI] [PubMed] [Google Scholar]
- 3.Tönnis D.Congenital dysplasia and dislocation of the hip in children and adults Berlin, Germany: Springer-Verlag, 1987 [Google Scholar]
- 4.Mechlenburg I.Evaluation of Bernese periacetabular osteotomy: prospective studies examining projected load-bearing area, bone density, cartilage thickness and migration. Acta Orthop Suppl 2008;79(329):4–43 [DOI] [PubMed] [Google Scholar]
- 5.Wu JZ, Herzog W, Epstein M. Joint contact mechanics in the early stages of osteoarthritis. Med Eng Phys 2000;22(1):1–12 [DOI] [PubMed] [Google Scholar]
- 6.Andriacchi TP, Lang PL, Alexander EJ, Hurwitz DE. Methods for evaluating the progression of osteoarthritis. J Rehabil Res Dev 2000;37(2):163–170 [PubMed] [Google Scholar]
- 7.Eckstein F, von Eisenhart-Rothe R, Landgraf J, et al. Quantitative analysis of incongruity, contact areas and cartilage thickness in the human hip joint. Acta Anat (Basel) 1997;158(3):192–204 [DOI] [PubMed] [Google Scholar]
- 8.Nishii T, Sugano N, Sato Y, Tanaka H, Miki H, Yoshikawa H. Three-dimensional distribution of acetabular cartilage thickness in patients with hip dysplasia: a fully automated computational analysis of MR imaging. Osteoarthritis Cartilage 2004;12(8):650–657 [DOI] [PubMed] [Google Scholar]
- 9.Rushfeld PD, Mann RW, Harris WH. Influence of cartilage geometry on the pressure distribution in the human hip joint. Science 1979;204(4391):413–415 [DOI] [PubMed] [Google Scholar]
- 10.Beaulé PE, Zaragoza E, Copelan N. Magnetic resonance imaging with gadolinium arthrography to assess acetabular cartilage delamination: a report of four cases. J Bone Joint Surg Am 2004;86-A(10):2294–2298 [DOI] [PubMed] [Google Scholar]
- 11.Kassarjian A. Hip MR arthrography and femoroacetabular impingement. Semin Musculoskelet Radiol 2006;10(3):208–219 [DOI] [PubMed] [Google Scholar]
- 12.Keeney JA, Peelle MW, Jackson J, Rubin D, Maloney WJ, Clohisy JC. Magnetic resonance arthrography versus arthroscopy in the evaluation of articular hip pathology. Clin Orthop Relat Res 2004;(429):163–169 [DOI] [PubMed] [Google Scholar]
- 13.Leunig M, Beck M, Kalhor M, Kim YJ, Werlen S, Ganz R. Fibrocystic changes at anterosuperior femoral neck: prevalence in hips with femoroacetabular impingement. Radiology 2005;236(1):237–246 [DOI] [PubMed] [Google Scholar]
- 14.Daenen BR, Ferrara MA, Marcelis S, Dondelinger RF. Evaluation of patellar cartilage surface lesions: comparison of CT arthrography and fat-suppressed FLASH 3D MR imaging. Eur Radiol 1998;8(6):981–985 [DOI] [PubMed] [Google Scholar]
- 15.Wyler A, Bousson V, Bergot C, et al. Comparison of MR-arthrography and CT-arthrography in hyaline cartilage-thickness measurement in radiographically normal cadaver hips with anatomy as gold standard. Osteoarthritis Cartilage 2009;17(1):19–25 [DOI] [PubMed] [Google Scholar]
- 16.El-Khoury GY, Alliman KJ, Lundberg HJ, Rudert MJ, Brown TD, Saltzman CL. Cartilage thickness in cadaveric ankles: measurement with double-contrast multi-detector row CT arthrography versus MR imaging. Radiology 2004;233(3):768–773 [DOI] [PubMed] [Google Scholar]
- 17.Eckstein F, Adam C, Sittek H, et al. Non-invasive determination of cartilage thickness throughout joint surfaces using magnetic resonance imaging. J Biomech 1997;30(3):285–289 [DOI] [PubMed] [Google Scholar]
- 18.McGibbon CA, Bencardino J, Yeh ED, Palmer WE. Accuracy of cartilage and subchondral bone spatial thickness distribution from MRI. J Magn Reson Imaging 2003;17(6):703–715 [DOI] [PubMed] [Google Scholar]
- 19.Cohen ZA, McCarthy DM, Kwak SD, et al. Knee cartilage topography, thickness, and contact areas from MRI: in-vitro calibration and in-vivo measurements. Osteoarthritis Cartilage 1999;7(1):95–109 [DOI] [PubMed] [Google Scholar]
- 20.Eckstein F, Charles HC, Buck RJ, et al. Accuracy and precision of quantitative assessment of cartilage morphology by magnetic resonance imaging at 3.0T. Arthritis Rheum 2005;52(10):3132–3136 [DOI] [PubMed] [Google Scholar]
- 21.Eckstein F, Westhoff J, Sittek H, et al. In vivo reproducibility of three-dimensional cartilage volume and thickness measurements with MR imaging. AJR Am J Roentgenol 1998;170(3):593–597 [DOI] [PubMed] [Google Scholar]
- 22.Raynauld JP, Kauffmann C, Beaudoin G, et al. Reliability of a quantification imaging system using magnetic resonance images to measure cartilage thickness and volume in human normal and osteoarthritic knees. Osteoarthritis Cartilage 2003;11(5):351–360 [DOI] [PubMed] [Google Scholar]
- 23.Solloway S, Hutchinson CE, Waterton JC, Taylor CJ. The use of active shape models for making thickness measurements of articular cartilage from MR images. Magn Reson Med 1997;37(6):943–952 [DOI] [PubMed] [Google Scholar]
- 24.Stammberger T, Eckstein F, Englmeier KH, Reiser M. Determination of 3D cartilage thickness data from MR imaging: computational method and reproducibility in the living. Magn Reson Med 1999;41(3):529–536 [DOI] [PubMed] [Google Scholar]
- 25.Stammberger T, Eckstein F, Michaelis M, Englmeier KH, Reiser M. Interobserver reproducibility of quantitative cartilage measurements: comparison of B-spline snakes and manual segmentation. Magn Reson Imaging 1999;17(7):1033–1042 [DOI] [PubMed] [Google Scholar]
- 26.Ghebontni L, Roger B, El-khoury J, Brasseur JL, Grenier PA. MR arthrography of the hip: normal intra-articular structures and common disorders. Eur Radiol 2000;10(1):83–88 [DOI] [PubMed] [Google Scholar]
- 27.Palmer WE. MR arthrography of the hip. Semin Musculoskelet Radiol 1998;2(4):349–362 [DOI] [PubMed] [Google Scholar]
- 28.Petersilge CA. Current concepts of MR arthrography of the hip. Semin Ultrasound CT MR 1997;18(4):291–301 [DOI] [PubMed] [Google Scholar]
- 29.Petersilge CA.MR arthrography for evaluation of the acetabular labrum. Skeletal Radiol 2001;30(8):423–430 [DOI] [PubMed] [Google Scholar]
- 30.Pfirrmann CW, Mengiardi B, Dora C, Kalberer F, Zanetti M, Hodler J. Cam and pincer femoroacetabular impingement: characteristic MR arthrographic findings in 50 patients. Radiology 2006;240(3): 778–785 [DOI] [PubMed] [Google Scholar]
- 31.Sahin G, Demirtaş M. An overview of MR arthrography with emphasis on the current technique and applicational hints and tips. Eur J Radiol 2006;58(3):416–430 [DOI] [PubMed] [Google Scholar]
- 32.Steinbach LS, Palmer WE, Schweitzer ME. Special focus session: MR arthrography. RadioGraphics 2002;22(5):1223–1246 [DOI] [PubMed] [Google Scholar]
- 33.Wyler A, Bousson V, Bergot C, et al. Comparison of MR-arthrography and CT-arthrography in hyaline cartilage-thickness measurement in radiographically normal cadaver hips with anatomy as gold standard. Osteoarthritis Cartilage 2009;17(1):19–25 [DOI] [PubMed] [Google Scholar]
- 34.Anderson AE, Ellis BJ, Peters CL, Weiss JA. Cartilage thickness: factors influencing multidetector CT measurements in a phantom study. Radiology 2008;246(1):133–141 [DOI] [PMC free article] [PubMed] [Google Scholar]
- 35.Anderson AE, Peters CL, Tuttle BD, Weiss JA. Subject-specific finite element model of the pelvis: development, validation and sensitivity studies. J Biomech Eng 2005;127(3):364–373 [DOI] [PubMed] [Google Scholar]
- 36.Altman DG, Bland JM. Measurement in medicine: the analysis of method comparison studies. Statistician 1983;32:307–317 [Google Scholar]
- 37.Bland JM, Altman DG. Measuring agreement in method comparison studies. Stat Methods Med Res 1999;8(2):135–160 [DOI] [PubMed] [Google Scholar]
- 38.McCarthy WF, Thompson DR. The analysis of pixel intensity (myocardial signal density) data: the quantification of myocardial perfusion by imaging methods. In: Collection of biostatistics research archive Berkeley, Calif: Berkeley Electronic Press, 2007 [Google Scholar]
- 39.Adam C, Eckstein F, Milz S, Putz R. The distribution of cartilage thickness within the joints of the lower limb of elderly individuals. J Anat 1998;193(pt 2):203–214 [DOI] [PMC free article] [PubMed] [Google Scholar]
- 40.Athanasiou KA, Agarwal A, Dzida FJ. Comparative study of the intrinsic mechanical properties of the human acetabular and femoral head cartilage. J Orthop Res 1994;12(3):340–349 [DOI] [PubMed] [Google Scholar]
- 41.Kurrat HJ, Oberländer W. The thickness of the cartilage in the hip joint. J Anat 1978;126(pt 1):145–155 [PMC free article] [PubMed] [Google Scholar]
- 42.Shepherd DE, Seedhom BB. Thickness of human articular cartilage in joints of the lower limb. Ann Rheum Dis 1999;58(1):27–34 [DOI] [PMC free article] [PubMed] [Google Scholar]
- 43.Prevrhal S, Engelke K, Kalender WA. Accuracy limits for the determination of cortical width and density: the influence of object size and CT imaging parameters. Phys Med Biol 1999;44(3):751–764 [DOI] [PubMed] [Google Scholar]
- 44.Prevrhal S, Fox JC, Shepherd JA, Genant HK. Accuracy of CT-based thickness measurement of thin structures: modeling of limited spatial resolution in all three dimensions. Med Phys 2003;30(1):1–8 [DOI] [PubMed] [Google Scholar]
- 45.Wang G, Vannier MW. Stair-step artifacts in three-dimensional helical CT: an experimental study. Radiology 1994;191(1):79–83 [DOI] [PubMed] [Google Scholar]
- 46.Wyler A, Bousson V, Bergot C, et al. Hyaline cartilage thickness in radiographically normal cadaveric hips: comparison of spiral CT arthrographic and macroscopic measurements. Radiology 2007;242(2):441–449 [DOI] [PubMed] [Google Scholar]
- 47.Buckwalter KA, Rydberg J, Kopecky KK, Crow K, Yang EL. Musculoskeletal imaging with multislice CT. AJR Am J Roentgenol 2001;176(4):979–986 [DOI] [PubMed] [Google Scholar]
- 48.Menschik F.The hip joint as a conchoid shape. J Biomech 1997;30(9):971–973 [DOI] [PubMed] [Google Scholar]
- 49.Rushfeldt PD, Mann RW, Harris WH. Improved techniques for measuring in vitro the geometry and pressure distribution in the human acetabulum. I. Ultrasonic measurement of acetabular surfaces, sphericity and cartilage thickness. J Biomech 1981;14(4):253–260 [DOI] [PubMed] [Google Scholar]
- 50.Ateshian GA, Soslowsky LJ, Mow VC. Quantitation of articular surface topography and cartilage thickness in knee joints using stereophotogrammetry. J Biomech 1991;24(8):761–776 [DOI] [PubMed] [Google Scholar]
- 51.Blum AG, Simon JM, Cotten A, et al. Comparison of double-contrast CT arthrography image quality with nonionic contrast agents: isotonic dimeric iodixanol 270 mg I/mL and monomeric iohexol 300 mg I/mL. Invest Radiol 2000;35(5):304–310 [DOI] [PubMed] [Google Scholar]
- 52.Silvast TS, Jurvelin JS, Aula AS, Lammi MJ, Töyräs J. Contrast agent-enhanced computed tomography of articular cartilage: association with tissue composition and properties. Acta Radiol 2009;50(1):78–85 [DOI] [PubMed] [Google Scholar]
- 53.Silvast TS, Jurvelin JS, Lammi MJ, Töyräs J. pQCT study on diffusion and equilibrium distribution of iodinated anionic contrast agent in human articular cartilage: associations to matrix composition and integrity. Osteoarthritis Cartilage 2009;17(1):26–32 [DOI] [PubMed] [Google Scholar]
- 54.Silvast TS, Kokkonen HT, Nieminen MT, et al. Diffusion rate and near equilibrium distribution of MRI and CT contrast agents in articular cartilage. Paper No. 241. Presented at the ## Annual Meeting of the Orthopaedic Research Society. Las Vegas, Nev, DATE, 2009 [DOI] [PubMed] [Google Scholar]


