

Our study contributes important information to existing literature in that we identified six performance cut points important for interpretation of screening mammograms and found that most of the cut points we identified would affect between 20% and 49% of interpreting physicians, who might benefit from additional training to improve their mammogram interpretation skills.
Abstract
Purpose:
To develop criteria to identify thresholds for minimally acceptable physician performance in interpreting screening mammography studies and to profile the impact that implementing these criteria may have on the practice of radiology in the United States.
Materials and Methods:
In an institutional review board–approved, HIPAA-compliant study, an Angoff approach was used in two phases to set criteria for identifying minimally acceptable interpretive performance at screening mammography as measured by sensitivity, specificity, recall rate, positive predictive value (PPV) of recall (PPV1) and of biopsy recommendation (PPV2), and cancer detection rate. Performance measures were considered separately. In phase I, a group of 10 expert radiologists considered a hypothetical pool of 100 interpreting physicians and conveyed their cut points of minimally acceptable performance. The experts were informed that a physician’s performance falling outside the cut points would result in a recommendation to consider additional training. During each round of scoring, all expert radiologists’ cut points were summarized into a mean, median, mode, and range; these were presented back to the group. In phase II, normative data on performance were shown to illustrate the potential impact cut points would have on radiology practice. Rescoring was done until consensus among experts was achieved. Simulation methods were used to estimate the potential impact of performance that improved to acceptable levels if effective additional training was provided.
Results:
Final cut points to identify low performance were as follows: sensitivity less than 75%, specificity less than 88% or greater than 95%, recall rate less than 5% or greater than 12%, PPV1 less than 3% or greater than 8%, PPV2 less than 20% or greater than 40%, and cancer detection rate less than 2.5 per 1000 interpretations. The selected cut points for performance measures would likely result in 18%–28% of interpreting physicians being considered for additional training on the basis of sensitivity and cancer detection rate, while the cut points for specificity, recall, and PPV1 and PPV2 would likely affect 34%–49% of practicing interpreters. If underperforming physicians moved into the acceptable range, detection of an additional 14 cancers per 100000 women screened and a reduction in the number of false-positive examinations by 880 per 100000 women screened would be expected.
Conclusion:
This study identified minimally acceptable performance levels for interpreters of screening mammography studies. Interpreting physicians whose performance falls outside the identified cut points should be reviewed in the context of their specific practice settings and be considered for additional training.
© RSNA, 2010
The Mammography Quality Standards Act (MQSA) was enacted in 1992, with implementation then being placed under the purview of the U.S. Food and Drug Administration (FDA) (1). As part of the FDA certification process, all interpreting physicians, radiologic technologists, and medical physicists must meet initial and continuing qualifications. Interpreting physicians must also demonstrate ongoing interpretation of a minimum of 960 mammograms every 2 years and completion of at least 15 category-one hours of continuing medical education every 3 years.
According to the MQSA, each facility must establish a system to record medical outcomes audit data (currently limited to correlations between biopsies recommended at mammography and pathology outcomes). While facilities are required to have auditing systems in place, calculation of performance measures is not required, and thresholds for acceptable interpretive performance in terms of specific measures such as sensitivity, specificity, recall rate, positive predictive value (PPV), and cancer detection rate have not been specified either for each interpreting physician or for the facility in aggregate (2).
Several reports (3–5) have provided desirable goals for interpretive performance at screening mammography. However, results of published research (6–10) on screening mammography performance indexes vary considerably, from 75% to 95% for sensitivity and from 83% to 98.5% for specificity. This variability influences the ability of mammography to reach its full potential for decreasing breast cancer mortality. Identifying low performers and providing additional training should lead to more effective breast cancer screening. Implementing such a program requires setting reasonable criteria to identify interpreting physicians who could potentially benefit from additional training. The purpose of this study was to develop criteria to identify thresholds for minimally acceptable performance of physicians in interpreting screening mammography studies and to profile the impact that implementing these criteria may have on the practice of radiology in the United States.
Materials and Methods
Recruitment of Expert Radiologists
The Committee for the Protection of Human Subjects at Dartmouth College approved all study activities. Criteria for selection of expert radiologists included that (a) they devoted 75% or more of their time to breast imaging, (b) they had been interpreting mammograms for at least 10 years, and (c) they either had completed fellowship training in breast imaging (these training programs began around 1985) or had more than 15 years of experience in interpreting mammograms. The principal investigators of the six National Cancer Institute–funded Breast Cancer Surveillance Consortium (BCSC) sites (11), by using their professional knowledge of those in the field, initially identified a cohort of 25 radiologists who met the selection criteria. We recruited, by means of electronic contact, 10 eligible radiologists who were able to attend a 1-day meeting in Seattle, Washington in January 2009. The 15 remaining expert radiologists who were invited could not attend on the day selected for the Angoff criterion–setting meeting. At that time, the expert radiologists reviewed and signed consent forms and completed a brief survey of their demographic and practice characteristics. The demographic and practice characteristics of the 10 expert radiologists were calculated by using means, standard deviations, ranges, and percentiles and are shown in Table 1. The mean age of the expert group was 58 years, and 60% were men. No demographic differences were noted according to the sex of the radiology experts. They practiced in relatively large practices and had been interpreting mammography studies for more than 25 years, on average. Thirty percent of the radiologists were fellowship trained, and the annual volume of screening and diagnostic mammography interpretation was high. Importantly, the experts represented both academic (60%) and community-based (40%) practices.
Table 1.
Characteristics of 10 Radiologists Involved in Setting Criteria
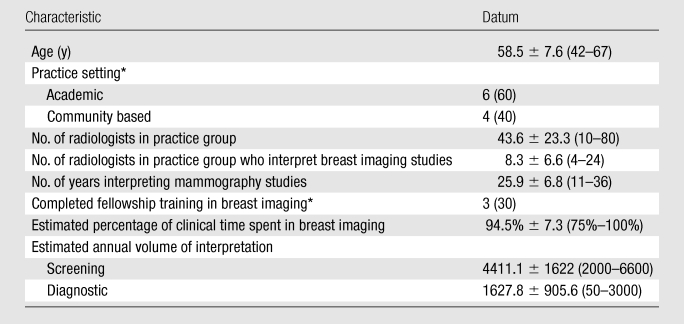
Note.—There were six male radiologists and four female radiologists. Unless otherwise specified, data are means ± standard deviations, with ranges in parentheses.
Data are numbers of participants, with percentages in parentheses.
Modified Angoff Criterion-Referenced Approach
We used a modified Angoff approach in two phases to set cut points for low interpretive performance at screening mammography (12–14). Briefly, the Angoff method is the most widely used criterion-referenced method of standard setting (15,16), and it is often used in licensing and certification examinations in medicine because it is well supported by research evidence (17). In the Angoff method, a panel of judges decides the level of performance that should be achieved by a minimally competent performer. The approach is criterion referenced if no normative data are provided to characterize the distribution of performance in the population of interest. A modified approach uses normative data in the process of identifying the performance cut points (12). In prior studies (18), the intraclass correlation coefficients achieved by using the Angoff method have been high, at 0.81 and 0.82.
With use of an Angoff criterion-referenced approach in phase I, the group of 10 expert radiologists first considered the interpretive performance of a hypothetical pool of 100 interpreting physicians. Working independently, the experts conveyed their cut points for achieving “minimally acceptable” performance in terms of sensitivity, specificity, recall rate, PPV of recall (PPV1), PPV of biopsy recommendation (PPV2), and cancer detection rate by providing confidential scores, which were then tallied. The experts agreed to standard definitions for these performance measures before scoring began (Table 2). The experts were informed that a physician’s performance falling outside the cut points would result in that physician being considered to receive a recommendation for additional training.
Table 2.
Screening Mammography Definitions Used for Angoff Scoring Criteria
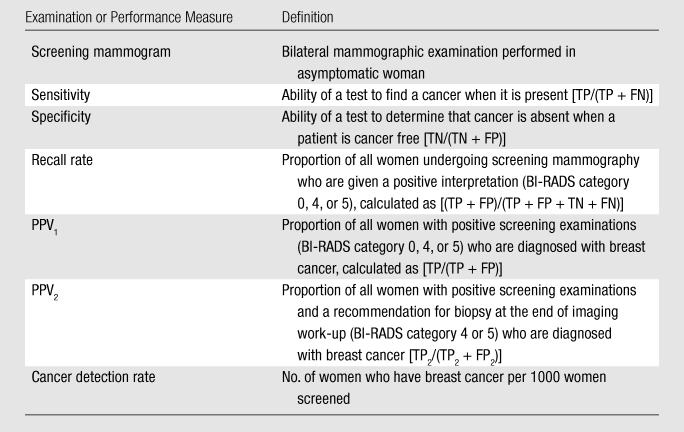
Note.—BI-RADS = Breast Imaging Reporting and Data System; FN = false-negative on the basis of initial assessment; FP = false-positive on the basis of initial assessment; FP2 = false-positive on the basis of the final assessment at the end of imaging work-up, where BI-RADS categories 1, 2, and 3 are considered negative and unresolved category 0 findings are considered missing data; TN = true-negative on the basis of initial assessment, where BI-RADS categories 1, 2, and 3 are considered negative; TP = true-positive on the basis of initial assessment, where BI-RADS categories 0, 4, and 5 are considered positive; TP2 = true-positive on the basis of the final assessment at the end of imaging work-up, where BI-RADS categories 4 and 5 are considered positive, and where initial assessment was considered positive (BI-RADS categories 0, 4, or 5). For further description of BI-RADS categories, see reference 19.
During each round of scoring, all expert radiologists’ cut points were summarized by the mean, median, mode, and range; these data were presented to the group. A nonradiologist facilitator (P.A.C.) with expertise in using the Angoff method to set performance criteria aided the discussion of the mean, median, mode, and range in scores, after which the experts recast their votes for minimally acceptable performance. The exercise was repeated until agreement for each cut point was achieved for the hypothetical group of interpreting physicians.
This approach allowed the scores to be anonymous, because individual scores were unknown, thus allowing an active discussion and, ultimately, consensus on the respective cut points. Each performance indicator was considered separately by moving from phase I to phase II before moving on to the next indicator. Sensitivity and cancer detection rates both involved deriving one cut point (with low performers dropping below it), while specificity, recall rate, PPV1, and PPV2 all involved deriving both upper and lower bounds, where low performers would be those whose performance either dropped below the lower-bound cut point or rose above the upper-bound cut point.
In phase II, a modified Angoff approach was used. With this approach, normative data on performance from a community-based sample of interpreting physicians who participate in the BCSC (11) were shown to illustrate the potential impact the proposed cut points would have on mammography screening practice (ie, the percentage of interpreting physicians who would be considered for additional training). Presentation of normative data has been shown to improve interexpert reliability and is used about 25% of the time that Angoff methods are applied (12). The process of scoring the cut points was repeated in phase II, with the mean, median, mode, and range presented at each round of scoring until consensus among the experts was achieved for each cut point. Field notes were recorded of the discussions following each scoring round in both phase I and phase II to characterize the decision-making process.
To calculate the normative statistics, we used data from the BCSC. Each BCSC registry and the Statistical Coordinating Center have received institutional review board approval for either active or passive consenting processes or a waiver of consent to enroll participants, link data, and perform analytic studies. All procedures are Health Insurance Portability and Accountability Act compliant, and all registries and the Statistical Coordinating Center have received a Federal Certificate of Confidentiality and other protection for the identities of the women, physicians, and facilities that are the subjects of this research.
The methods we applied, as previously described by Rosenberg et al (5), involved including screening mammography studies performed in women without breast symptoms that were interpreted at a BCSC facility from 2001 to 2006. Mammograms were linked to cancer registries and pathology databases to determine cancer status (ductal carcinoma in situ or invasive carcinoma) within 1 year of the mammogram. For each performance measure, we calculated the percentile distributions across radiologists. To reduce the number of radiologists with zero observed “events” (no abnormal interpretations, no cancers diagnosed, etc), we restricted the analysis to those who contributed at least a designated, subjectively determined minimum number of cases for each performance measure. For sensitivity, we included those who had interpreted a minimum of 10 mammograms associated with a cancer diagnosis. Radiologists who had interpreted at least 100 mammograms that were not associated with a cancer diagnosis contributed to the analysis of specificity. To contribute to the analysis of PPV1 or PPV2, radiologists needed to have recalled patients as having positive results after at least 100 screening or 100 diagnostic mammograms, respectively. For both recall rate and cancer detection rate, we included data only from those radiologists who had interpreted at least 100 mammograms. We displayed the frequency distributions overlaid with percentile values to report these data in an easily understandable format.
Determining Interrelationships among Performance Measures
The performance measures examined are related, and it is important to take these relationships into account when setting cut points. For example, the cut points for specificity and recall rate were determined together, because these measures are very closely related, given that the majority of women undergoing screening mammography do not have cancer. The difference between an interpreting physician’s false-positive rate (1 − specificity) and recall rate is bounded by the cancer rate, which is very low in a screening population (approximately five cases per 1000 women). For example, at a cancer rate of five cases per 1000 women, if an interpreter’s recall rate is 10.0% and he or she has perfect sensitivity, his or her specificity will be 90.5%. As sensitivity goes down, the interpreter’s specificity will get closer to 90%. Thus, cut points for recall rate and 1 − specificity should not differ by more than the cancer rate. When determining cut points for PPV1, we considered the cut points chosen for the other performance measures.
Simulation Analysis
We performed a simulation to investigate the potential impact of moving the lower-performing physicians’ performance measures into the acceptable range on the basis of the BCSC normative data. We simulated a cohort of 1 million women and a cancer status for each woman that was based on a prevalence of five cases per 1000 women. For each simulated woman, we chose one of the actual BCSC interpreting physicians, with a selection probability proportional to the physician’s interpretive volume, and then randomly generated a mammogram result given the simulated woman’s cancer status and the physician’s own observed screening performance measures. To simulate the retraining of low performers, we also simultaneously generated a second mammogram result for each woman associated with the same chosen interpreter. If the interpreter’s observed performance measure was in the acceptable range, the second mammogram result was identical to the first. If not, the relevant performance measure was replaced with a value belonging to a randomly chosen interpreter with an observed value in the acceptable range. We tabled both test results against cancer status for our simulated cohort and compared the numbers of true-positive and false-positive tests. The simulation was performed by using the R statistical software package (version 2.8.0; Comprehensive R Archive Network, Vienna, Austria [20]).
Results
The number of rounds of scoring needed to arrive at agreement ranged from two to four in phase I and from one to two in phase II. Summary scores for each of the study’s two phases are illustrated in Table 3. The ranges of cut point scores in phase I (1–30 points) were much higher than those in phase II (0–20 points). The ranges were highest for sensitivity, specificity, and PPV and were lowest for recall and cancer detection rates in both phase I and phase II.
Table 3.
Expert Radiologist Scoring Summary for Phases I and II
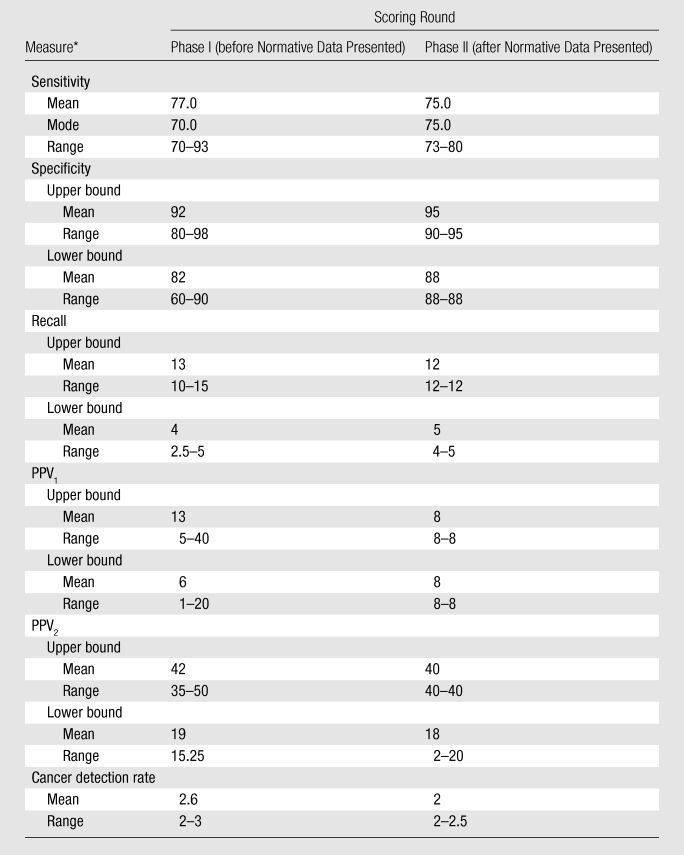
Cancer detection rate = number of women who have breast cancer per 1000 women screened, PPV1 = proportion of all women with positive screening examinations who are given a diagnosis of breast cancer, PPV2 = proportion of all women with positive screening examinations who are given a recommendation for biopsy at the end of the imaging work-up.
Table 4 illustrates the normative performance data at the lowest, 10th, 25th, 50th, 75th, 90th, and highest percentiles for 623 radiologist participants in the BCSC who interpreted mammograms for screening, diagnosis, or both between January 1, 2001, and December 31, 2006, and who met volume criteria for at least one performance measure. These radiologists (combined) interpreted 2040244 screening mammograms that were associated with 9451 cancers and 54350 diagnostic mammograms that were obtained for the additional evaluation of a recent mammogram and were associated with 2661 cancers. While data from the BCSC have contributed to over 300 publications (http://breastscreening.cancer.gov/publications/search.html), the data set used in this analysis is associated only with this manuscript. Table 4 additionally presents the numbers of interpreting physicians who met the volume criteria for each performance measure, along with the numbers of mammograms and cancers, that informed our analysis. Normative data for sensitivity ranged from 40.0% to 100%, with 84.7% as the median (50th percentile). Specificity ranged from 51.7% to 94.4%, with a median of 91.1%. Recall rate ranged from 0.6% to 48.6%, with a median of 9.2%. PPV1 ranged from 0% to 13.8%, with a median of 3.9%, and PPV2 ranged from 6.8% to 47.8%, with a median of 25.7%. Cancer detection rates per 1000 screening mammograms ranged from 0 to 24.4, with a median of 3.7.
Table 4.
BCSC Normative Performance Data at 10th, 25th, 50th, 75th and 90th Percentiles

CDR = cancer detection rate, PPV1 = positive predictive value for screening mammography, PPV2 = positive predictive value for diagnostic mammography
Table 5 lists the final cutoff points for low performance derived from the study’s two phases. These were as follows: sensitivity less than 75%, specificity less than 88% or greater than 95%, recall rate less than 5% or greater than 12%, PPV1 less than 3% or greater than 8%, PPV2 less than 20% or greater than 40%, and cancer detection rate less than 2.5 per 1000 interpretations. The selected cut points for performance measures would likely result in between 18% and 28% of radiologists being considered for additional training on the basis of sensitivity and cancer detection rate, while the cut points for specificity, recall, PPV1, and PPV2 would likely affect 34%–49% of practicing radiologists. Approximately 56% of radiologists had a recall rate above 12% and/or a cancer detection rate below 2.5 per 1000 interpretations.
Table 5.
Final Performance Cutoff Points
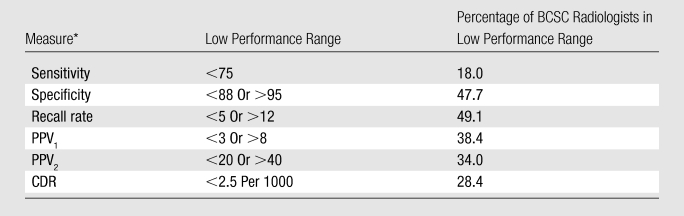
CDR = cancer detection rate, PPV1 = proportion of all women with positive screening examinations who are given a diagnosis of breast cancer, PPV2 = proportion of all women with positive screening examinations who are given a recommendation for biopsy at the end of the imaging work-up.
Last, in our simulated cohort of 1 million women, 4834 women had breast cancer. The number of cancers we estimated that would be correctly recalled increased from 4078 to 4216 in the simulated cohort as a result of effective additional training for low-performing interpreters that brought their performance to acceptable levels, and the number of false-positive findings decreased from 91454 to 82621. On the basis of these estimates, if we could move currently underperforming interpreters into the acceptable range, we would expect the earlier detection of approximately 14 cancers per 100000 women screened and a reduction in the number of false-positive examinations by 880 per 100000 women screened.
Discussion
Our study is, to our knowledge, the first to apply a well-researched process for identifying minimally acceptable performance levels for the interpretation of screening mammography studies. The range of performance that occurs in actual practice helped the experts reach consensus on cut points for minimally acceptable performance when the outcome would be to receive a recommendation to consider additional training. If the experts had been instructed to expect a different outcome (eg, to suspend or restrict practice), the chosen cut points may have been different.
The final criterion set for “low performers” was less than 75% for sensitivity, which is lower than the Agency for Health Care Policy and Research “desirable goal” of 85%, derived in 1994 with input from selected experts (4). Since that goal was reported, several investigators (5,6,8) have found that the mean sensitivity in community practice is much lower, ranging from 72% to 80%. Similarly, other measures of mammography interpretation performance in the community differ from that achieved by breast imaging specialists. This likely occurs because most physicians who interpret mammography studies devote only a small portion of their time to breast imaging, especially in rural settings, where patient volume is not sufficient to foster specialization in breast imaging (21).
Our study contributes important information to existing literature in that we identified six performance cut points important for interpretation of screening mammograms and found that most of the cut points would affect between 20% and 49% of interpreting physicians, who might benefit from additional training to improve their mammography interpretation skills. We also estimated the impact of receiving effective additional training, which would especially reduce unnecessary work-up. An important caveat is that the individual cut points should not be used in isolation from the others to determine whether additional training should be considered for an interpreter (22). For example, certain combinations of selected performance outcomes, such as high sensitivity or high cancer detection rate for the same reader or group of readers that achieves a below-lower-bound recall rate, are not problematic and would not warrant additional training. Also, new interpreters appear to have higher recall rates for a number of years before they establish a stable practice pattern (23). This may be a reasonable trade-off for achieving high sensitivity during the first few years of practice. However, once high sensitivity is achieved, interpreters should work to lower their recall rate without adversely affecting sensitivity.
Another important consideration is that performance measures may be affected by many factors, such as differences in patient populations, and estimated performance measures will be less stable if they are based on a low interpretive volume and thus a low number of cancers. To address this issue in phase II of our study, we set volume criteria that increased the stability of the rates for performance measures in our presentation of normative data. For example, for sensitivity, we included radiologists who interpreted a minimum of 10 mammograms associated with a cancer diagnosis, which would translate into interpreting approximately 2000 screening mammograms annually—well above the annual volume required in the United States to qualify as an interpreting physician. We chose this low number because most radiologists do not interpret many cancer cases. Unfortunately, rates based on only 10 mammograms are still quite variable, and ideally, rates would be estimated from a much larger numbers of interpretations. We required at least 100 interpretations for the other performance measures used in our display of normative data. However, even 100 mammograms may be too small a number to provide stable estimates. For example, if an interpreter’s true recall rate was 10%, we would expect his or her estimated recall rate to fall outside our proposed cut points (<5% or >12%) 22% of the time on the basis of chance alone if estimated from only 100 interpretations. At least 600 interpretations would be required to reduce this error rate to less than 5% in this example.
For the outcome measures that primarily reflect true-positive performance (sensitivity and cancer detection rate), we did not select an upper bound for “acceptability” because detecting more cancers is good in and of itself. However, for the outcome measures that primarily reflect false-positive performance (recall rate, specificity), as well as for the PPVs, we selected both upper and lower bounds for “acceptability.” This is because (a) too high a recall rate (which typically results in a low PPV and specificity) may indicate that the interpreting physician is assessing studies as abnormal to an excessive degree, resulting in an inappropriate frequency of false-positive examinations and a low probability of cancer among those patients recalled and (b) too low a recall rate (which typically results in a high PPV and specificity) may indicate that the interpreting physician is assessing studies as abnormal too infrequently, resulting in too low a rate of cancer detection and a high PPV if only the obvious lesions are being recalled. False-positive examinations are necessary in mammographic screening because mammographic features of early breast cancer are not that different from features that represent normal variants. Hence one must recall many (and biopsy some) benign lesions to maximize the detection of early cancer. Note that mammographic screening is not unique; all screening tests have acceptable frequencies of false-positive examinations.
Another important issue is that most interpreting physicians have access to data for accurate calculation of only two of the six performance measures included in this study: recall rate and PPV2. While these two measures are important, they are not as important as sensitivity or cancer detection rate when considering screening mammography. Recall rates and PPV2 cannot provide the kind of vital information that can be learned from the frequency with which cancer is detected or from review of the images of false-negative cases. The lack of accurate comprehensive performance measures occurs because linkage of mammography data to a regional tumor registry or pathology database such as that provided by the BCSC is not available to most facilities. Despite limitations in current database infrastructure, the Institute of Medicine has recommended expanding the medical MQSA audit to facilitate feedback on more key performance indexes (2).
The strengths of our study included the fact that we successfully recruited 10 expert radiologists from both academic and community-based practice to collaborate on an Angoff criterion-referenced and modified Angoff study. This methodologic approach has been used in similar studies in medicine to identify minimally competent physicians. Use of this approach in the assessment of screening mammography interpretation performance is both innovative and rigorous, as we used two important phases, a criterion-referenced phase and a normative-referenced phase, to fully consider the impact of the cut points that we selected. Another strength was that the normative data we used in phase II were physician based rather than measure based; this allowed us to estimate with accuracy the number of interpreters who were likely to benefit from additional training.
A weakness was that our study could not take into account the specifics of how the cut points can be applied in actual practice. For example, performance measures may be different in high-risk populations or for initial (prevalence) screening examinations versus subsequent (incident) screening examinations. Furthermore, a single measure of sensitivity does not discriminate between interpreting physicians in terms of the average size of tumors detected. The principal goal of screening mammography is not simply to detect occult breast cancers but to detect them when they are small. The majority of our measures require complete ascertainment of cancer cases, which is not currently feasible outside of regional tumor registry linkage; thus, accurate comprehensive performance data are not readily available for individual interpreting physicians in the United States. In addition, for very-low-volume interpreters (eg, those who interpret < 1000 screening mammograms per year), few cancers will be detected each year, resulting in unstable measures. In addition, we used 10 experts in mammography who may not be representative of all expert mammographers in the United States, and this may have influenced the cut points selected. Also, although our findings indicate the need to better educate half of mammographers in practice, educating these physicians would not guarantee that performance would be improved to the desired degree.
In conclusion, we have identified what we believe to be adequate performance levels for physicians interpreting screening mammography studies. We recognize that a combination of performance measures must be assessed for any individual interpreter. Interpreting physicians whose performance falls outside the identified cut points should be reviewed in the context of their specific practice settings and be considered for additional training.
Advances in Knowledge.
Final cut points to identify low performance were as follows: sensitivity less than 75%, specificity less than 88% or greater than 95%, recall rate less than 5% or greater than 12%, positive predictive value (PPV) of recall (PPV1) less than 3% or greater than 8%, PPV of biopsy recommendation (PPV2) less than 20% or greater than 40%, and cancer detection rate less than 2.5 per 1000 interpretations.
The selected cut points for performance measures would likely result in between 18% and 28% of interpreting physicians being considered for additional training on the basis of sensitivity and cancer detection rate.
The cut points for specificity, recall, and PPV1 and PPV2 would likely affect 34%–49% of practicing interpreters.
If underperforming physicians moved into the acceptable range, we would expect detection of an additional 14 cancers per 100000 women screened and a reduction in the number of false-positive examinations by 880 per 100000 women screened.
Implication for Patient Care.
Interpreting physicians whose performance falls outside the identified cut points should be reviewed in the context of their specific practice settings and be considered for additional training.
Acknowledgments
We thank the participating women, mammography facilities, and radiologists for the data they provided for this study. A list of the BCSC investigators and procedures for requesting BCSC data for research purposes are provided at http://breastscreening.cancer.gov/. The collection of cancer data used in this study was supported in part by several state public health departments and cancer registries throughout the United States. A full description of these sources is at http://breastscreening.cancer.gov/work/acknowledgement.html.
Received September 8, 2009; revision requested October 13; revision received October 29; accepted November 5; final version accepted November 10.
Supported by the National Cancer Institute Breast Cancer Surveillance Consortium (grants U01CA63740, U01CA86076, U01CA86082, U01CA63736, U01CA70013, U01CA69976, U01CA63731, U01CA70040) and the American Cancer Society, made possible by a donation from the Longaberger Company’s Horizon of Hope Campaign (grants SIRGS-07-271-01, SIRGS-07-272-01, SIRGS-07-274-01, SIRGS-07-275-01, SIRGS-06-281-01, ACS A1-07-362).
Authors stated no financial relationship to disclose.
Abbreviations:
- BCSC
- Breast Cancer Surveillance Consortium
- BI-RADS
- Breast Imaging Reporting and Data System
- MQSA
- Mammography Quality Standards Act
- PPV
- positive predictive value
- PPV1
- PPV of recall
- PPV2
- PPV of biopsy recommendation
References
- 1.U.S. Food and Drug Administration Mammography Quality Standards Act and Program. http://www.fda.gov/Radiation-EmittingProducts/MammographyQualityStandardsActandProgram/default.htm Accessed July 22, 2009
- 2.Institute of Medicine and National Research Council of the National Academies Improving breast imaging quality standards Washington, DC: National Academies Press, 2005 [Google Scholar]
- 3.Sickles EA, Wolverton DE, Dee KE. Performance parameters for screening and diagnostic mammography: specialist and general radiologists. Radiology 2002;224(3):861–869 [DOI] [PubMed] [Google Scholar]
- 4.Bassett LW, Hendrick RE, Bassford TL, et al. Quality Determinants of Mammography: Clinical Practice Guideline No. 13. AHCPR Publication No. 95-0632 Rockville, Md: Agency for Health Care Policy and Research, Public Health Service, U.S. Department of Health and Human Services, 1994 [Google Scholar]
- 5.Rosenberg RD, Yankaskas BC, Abraham LA, et al. Performance benchmarks for screening mammography. Radiology 2006;241(1):55–66 [DOI] [PubMed] [Google Scholar]
- 6.Carney PA, Miglioretti DL, Yankaskas BC, et al. Individual and combined effects of age, breast density, and hormone replacement therapy use on the accuracy of screening mammography. Ann Intern Med 2003;138(3):168–175 [DOI] [PubMed] [Google Scholar]
- 7.Kerlikowske K, Carney PA, Geller B, et al. Performance of screening mammography among women with and without a first-degree relative with breast cancer. Ann Intern Med 2000;133(11):855–863 [DOI] [PubMed] [Google Scholar]
- 8.Poplack SP, Tosteson AN, Grove MR, Wells WA, Carney PA. Mammography in 53,803 women from the New Hampshire mammography network. Radiology 2000;217(3):832–840 [DOI] [PubMed] [Google Scholar]
- 9.Elmore JG, Wells CK, Lee CH, Howard DH, Feinstein AR. Variability in radiologists’ interpretations of mammograms. N Engl J Med 1994;331(22):1493–1499 [DOI] [PubMed] [Google Scholar]
- 10.Beam CA, Layde PM, Sullivan DC. Variability in the interpretation of screening mammograms by US radiologists. Findings from a national sample. Arch Intern Med 1996;156(2):209–213 [PubMed] [Google Scholar]
- 11.National Cancer Institute Breast Cancer Surveillance Consortium [Accessed June 22, 2009]. http://breastscreening.cancer.gov/
- 12.Ricker KL. Setting Cut Scores: Critical Review of Angoff and Modified-Angoff Methods. Centre for Research in Applied Measurement and Evaluation, University of Alberta, Edmonton, Alberta, Canada http://www.google.com/search?q=angoff+method&ie=utf-8&oe=utf-8&aq=t&rls=org.mozilla:en-US:official&client=firefox-a Accessed June 22, 2009
- 13.Cope RT. A Generalizability Study of the Angoff Method Applied to Setting Cutoff Scores of Professional Certification Tests. Paper presented at the Annual Meeting of the American Educational Research Association (Washington, DC, April 20–24, 1987). http://www.eric.ed.gov/ERICWebPortal/custom/portlets/recordDetails/detailmini.jsp?_nfpb=true&_&ERICExtSearch_SearchValue_0=ED282921&ERICExtSearch_SearchType_0=no&accno=ED282921 Accessed June 22, 2009
- 14.Arrasmith DG, Hambleton RK. Steps for setting standards with the Angoff Method. http://www.eric.ed.gov/ERICWebPortal/Home.portal?_nfpb=true&_pageLabel=ERICSearchResult&_urlType=action&newSearch=true&ERICExtSearch_SearchType_0=au&ERICExtSearch_SearchValue_0=%22Arrasmith+Dean+G.%22 Accessed June 22, 2009
- 15.Boursicot K, Roberts T. Setting standards in a professional higher education course: defining the concept of the minimally competent student in performance based assessment at the level of graduation from medical school. Higher Educ Q 2006;60(1):74–90 [Google Scholar]
- 16.Talente G, Haist SA, Wilson JF. A model for setting performance standards for standardized patient examinations. Eval Health Prof 2003;26(4):427–446 [DOI] [PubMed] [Google Scholar]
- 17.Norcini JJ. Setting standards on educational tests. Med Educ 2003;37(5):464–469 [DOI] [PubMed] [Google Scholar]
- 18.George S, Haque MS, Oyebode F. Standard setting: comparison of two methods. BMC Med Educ 2006;6:46. [DOI] [PMC free article] [PubMed] [Google Scholar]
- 19.American College of Radiology Breast imaging reporting and data system (BI-RADS). 4th ed Reston, Va: American College of Radiology, 2003 [Google Scholar]
- 20.R Development Core Team R: A language and environment for statistical computing Vienna, Austria: R Foundation for Statistical Computing, 2008 [Google Scholar]
- 21.Lewis RS, Sunshine JH, Bhargavan M. A portrait of breast imaging specialists and of the interpretation of mammography in the United States. AJR Am J Roentgenol 2006;187(5):W456–W468 [DOI] [PubMed] [Google Scholar]
- 22.Lemmers O, Broeders M, Verbeek A, Heeten G, Holland R, Borm GF. League tables of breast cancer screening units: worst-case and best-case scenario ratings helped in exposing real differences between performance ratings. J Med Screen 2009;16(2):67–72 [DOI] [PubMed] [Google Scholar]
- 23.Miglioretti DL, Gard C, Carney PA, et al. Changes in the interpretive performance of screening mammography with increasing experience. Radiology (in press). [Google Scholar]