

Noninvasive dual-modality (volumetric spectroscopic photoacoustic and planar fluorescence imaging) in vivo mapping of sentinel lymph nodes and lymphatic vessels by using indocyanine green was successfully accomplished in healthy rats.
Abstract
Purpose:
To noninvasively map sentinel lymph nodes (SLNs) and lymphatic vessels in rats in vivo by using dual-modality nonionizing imaging—volumetric spectroscopic photoacoustic imaging, which measures optical absorption, and planar fluorescence imaging, which measures fluorescent emission—of indocyanine green (ICG).
Materials and Methods:
Institutional animal care and use committee approval was obtained. Healthy Sprague-Dawley rats weighing 250−420 g (age range, 60−120 days) were imaged by using volumetric photoacoustic imaging (n = 5) and planar fluorescence imaging (n = 3) before and after injection of 1 mmol/L ICG. Student paired t tests based on a logarithmic scale were performed to evaluate the change in photoacoustic signal enhancement of SLNs and lymphatic vessels before and after ICG injection. The spatial resolutions of both imaging systems were compared at various imaging depths (2–8 mm) by layering additional biologic tissues on top of the rats in vivo. Spectroscopic photoacoustic imaging was applied to identify ICG-dyed SLNs.
Results:
In all five rats examined with photoacoustic imaging, SLNs were clearly visible, with a mean signal enhancement of 5.9 arbitrary units (AU) ± 1.8 (standard error of the mean) (P < .002) at 0.2 hour after injection, while lymphatic vessels were seen in four of the five rats, with a signal enhancement of 4.3 AU ± 0.6 (P = .001). In all three rats examined with fluorescence imaging, SLNs and lymphatic vessels were seen. The average full width at half maximum (FWHM) of the SLNs in the photoacoustic images at three imaging depths (2, 6, and 8 mm) was 2.0 mm ± 0.2 (standard deviation), comparable to the size of a dissected lymph node as measured with a caliper. However, the FWHM of the SLNs in fluorescence images widened from 8 to 22 mm as the imaging depth increased, owing to strong light scattering. SLNs were identified spectroscopically in photoacoustic images.
Conclusion:
These two modalities, when used together with ICG, have the potential to help map SLNs in axillary staging and to help evaluate tumor metastasis in patients with breast cancer.
© RSNA, 2010
Supplemental material: http://radiology.rsna.org/lookup/suppl/doi:10.1148/radiol.10090281/-/DC1
Introduction
To reduce the side effects of axillary lymph node dissection, sentinel lymph node (SLN) biopsy (SLNB) has become the standard method for staging disease in patients with breast cancer (1). Although SLNB with blue dye and/or radioactive tracers has an identification rate of 90%–95% and a sensitivity of 88%–95%, these methods involve the use of ionizing radiation and are invasive (2,3). Moreover, they can fail to help identify axillary disease owing to a false negative rate of 5%–10% (2,3). Furthermore, while SLNB is less invasive than axillary lymph node dissection, it still poses a risk of postoperative complications: seroma formation, lymphedema, and motion limitation (4). As an alternative to SLNB, ultrasonographically (US)-guided fine-needle aspiration biopsy (FNAB) has been utilized (5). Although US-guided FNAB is less invasive, this technique requires accurate identification of the SLN. Therefore, there is still a pressing need to develop an accurate, nonionizing, and noninvasive detection method for lymph node assessment. In addition to lymph node assessment in tumor studies, lymphatic vessels play an important role in lymphatic metastasis (6,7). Although both lymphatic and vascular systems contribute to tumor metastasis, the studies of lymphatic systems have been hindered by technical limitations. Fluorescence optical microscopy (8) successfully images lymphatic capillaries but suffers from poor spatial resolution because of strong light scattering in relatively deep tissues.
Photoacoustic imaging (Appendix E1 [online]) is an emerging hybrid modality that can provide strong endogenous and exogenous optical absorption contrasts with high ultrasonic spatial resolution (9,10). The image resolution, as well as the maximum imaging depth, is scalable with ultrasonic frequency within the reach of diffuse photons. In biologic tissues the imaging depth can be up to a few centimeters deep. Methylene blue and gold nanoparticles have been applied to identify SLNs in rats with photoacoustic imaging (11,12). However, light is slightly more strongly scattered at the peak absorption wavelength of methylene blue, 677 nm, than light in the near-infrared region. The methylene blue dye can cause chemical mastitis, as well as photodamage under intense light. Furthermore, gold nanoparticles are not yet approved by the U.S. Food and Drug Administration for clinical applications.
To date, to our knowledge, no studies have been reported about the feasibility of photoacoustic imaging with indocyanine green (ICG) for identifying SLNs and lymphatic vessels. ICG is Food and Drug Administration–approved for determining human cardiac output, hepatic function, and blood flow and for ophthalmic angiography. Because ICG has a moderate fluorescence quantum yield (approximately 10%) and because fluorescence and photoacoustic signals increase and decrease with the fluorescence quantum yield, respectively, ICG can be used as a contrast agent for both fluorescence imaging (13) and photoacoustic imaging. Thus, the purpose of this study was to noninvasively map SLNs and lymphatic vessels in rats in vivo by using dual-modality (volumetric spectroscopic photoacoustic imaging, which measures optical absorption, and planar fluorescence imaging, which measures fluorescent emission) nonionizing imaging of ICG.
Materials and Methods
Animal Handling and Dye Preparation
Institutional animal care and use committee approval was obtained. Healthy Sprague-Dawley rats that weighed 250−420 g (age range, 60−120 days; five rats for photoacoustic imaging and three for fluorescence imaging) were used in all imaging experiments. First, the rats were given a mixture of ketamine (Ketaset; Fort Dodge Animal Health, Fort Dodge, Iowa) (85 mg per kilogram of body weight) and xylazine (AnaSed; Akorn, Decatur, Ill) (15 mg/kg) for anesthesia. After depilation of the axillary region, the rats were positioned atop a homemade holder. During the experiments, the rats were fully anesthetized by using a vaporized isoflurane system (Euthanex, Palmer, Pa) that provided 1 L/min oxygen and 0.75% isoflurane; their vital signs were managed by using a pulse oximeter. After image acquisition, the animals were euthanized with an overdose of pentobarbital (Sleepaway; Fort Dodge Animal Health); the SLNs were then dissected for visual verification of ICG uptake. ICG (as 0.2 mL of 1 mmol/L ICG [Cardiogreen; Sigma-Aldrich, St Louis, Mo]) was injected intradermally into the left forepaw pad of the rat. Figure 1c shows the optical spectrum of 1 mmol/L ICG (14).
Figure 1c:

(a) Experimental setup of the photoacoustic imaging system. (b) Experimental setup of the fluorescence imaging system. CCD = charge-coupled device. (c) Optical spectrum of 1 mmol/L ICG. A wavelength of 668 nm was used for photoacoustic imaging experiments. For spectroscopic photoacoustic imaging, wavelengths of 618 and 668 nm were chosen.
Volumetric Photoacoustic Imaging System and Experiment
The volumetric photoacoustic imaging system is shown in Figure 1a (15). The light was delivered from a tunable dye laser (ND6000; Continuum, Santa Clara, Calif) pumped by a Q-switched Nd:YAG laser (LS-2137; LOTIS, Minsk, Belarus) with a 6-nanosecond pulse duration and a 10-Hz pulse repetition rate. A light wavelength of 668 nm was used for most of the experiments, but both 618- and 668-nm optical wavelengths were used for spectroscopic SLN identification. Formed by a concave lens, a spherical conical lens, and an optical condenser, the dark-field light illumination was coaxially aligned with the US focus in water (16). The light fluence on the skin was 3.4 mJ/cm2, within the American National Standards Institute limit (17). Generated photoacoustic waves were detected by a single-element 5-MHz US transducer (V308; Panametrics-NDT, Waltham, Mass). The spatial resolutions at 19 mm deep in biologic tissues were 144 µm in the axial direction and 560 µm in the transverse direction (15). One-dimensional (1D) depth-resolved (A-line) images were acquired by measuring the time of arrival of photoacoustic signals. By scanning targets in two transverse directions (yielding two-dimensional depth-resolved images, called B-scans), three-dimensional images, which represented the optical absorption heterogeneities of tissues, were formed. The acquired volumetric images were expressed in two forms: a maximum amplitude projection (MAP) image, which projected the maximum signal along each A-line onto the corresponding x-y plane, and a true volumetric image processed with software (Volview; Kitware, Clifton Park, NY). The scanning step sizes for the x and y directions were 200 and 400 µm, respectively. For a 25 × 30-mm field of view, the acquisition time was 23 minutes.
Figure 1a:

(a) Experimental setup of the photoacoustic imaging system. (b) Experimental setup of the fluorescence imaging system. CCD = charge-coupled device. (c) Optical spectrum of 1 mmol/L ICG. A wavelength of 668 nm was used for photoacoustic imaging experiments. For spectroscopic photoacoustic imaging, wavelengths of 618 and 668 nm were chosen.
To investigate the feasibility of using ICG for volumetric in vivo mapping of SLNs and lymphatic vessels, the left axillae of five rats were noninvasively imaged by using the photoacoustic imaging system (Fig 2). Prior to the administration of ICG, control images were obtained; a series of photoacoustic images was then acquired after the injection of ICG. We monitored the first rat with photoacoustic imaging for 1 hour. The second rat was monitored for 3.2 hours to image the dynamics of SLNs and lymphatic vessels related to ICG injection, and the photoacoustic signals within those sites were quantified by spatially averaging local photoacoustic signals. Two other rats were first imaged for 1 hour to observe SLNs and lymphatic vessels and then used to observe image degradation with additional biologic tissues. The last rat was first imaged for 2.2 hours and then used for spectroscopic photoacoustic imaging. The statistical analysis showing photoacoustic signal enhancement in SLNs and lymphatic vessels at 0.2 and 1 hour after injection was based on the imaging results in these five rats. Photoacoustic signal enhancement was defined as the average photoacoustic signal intensity within the areas of SLNs and lymphatic vessels after ICG injection divided by the photoacoustic signal intensity within the same regions before injection.
Figure 2a:

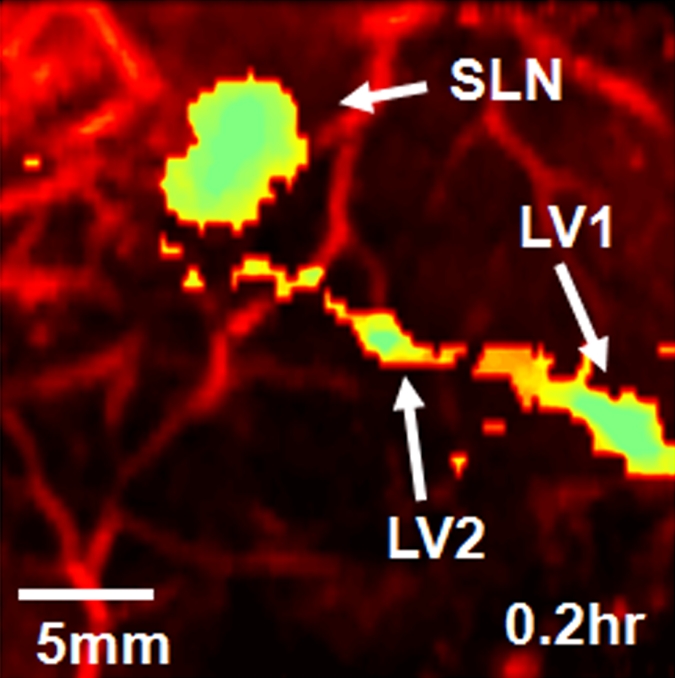
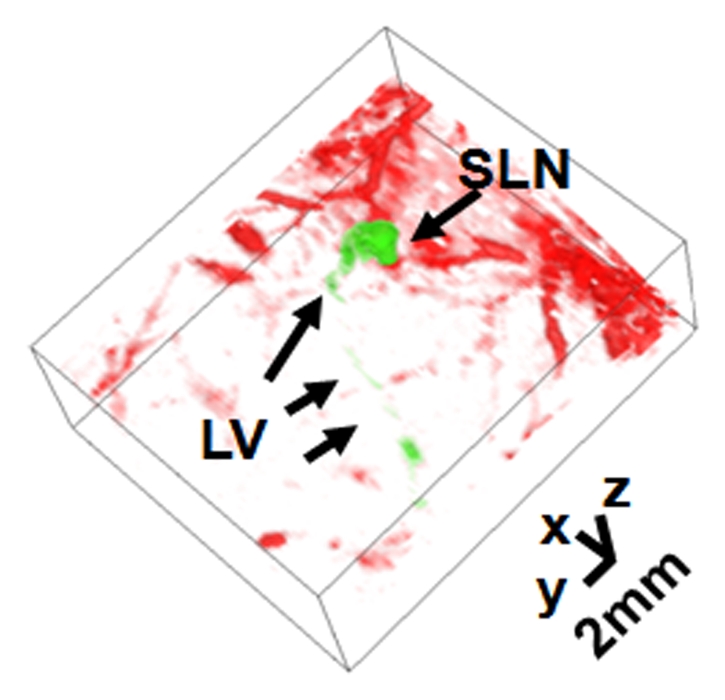
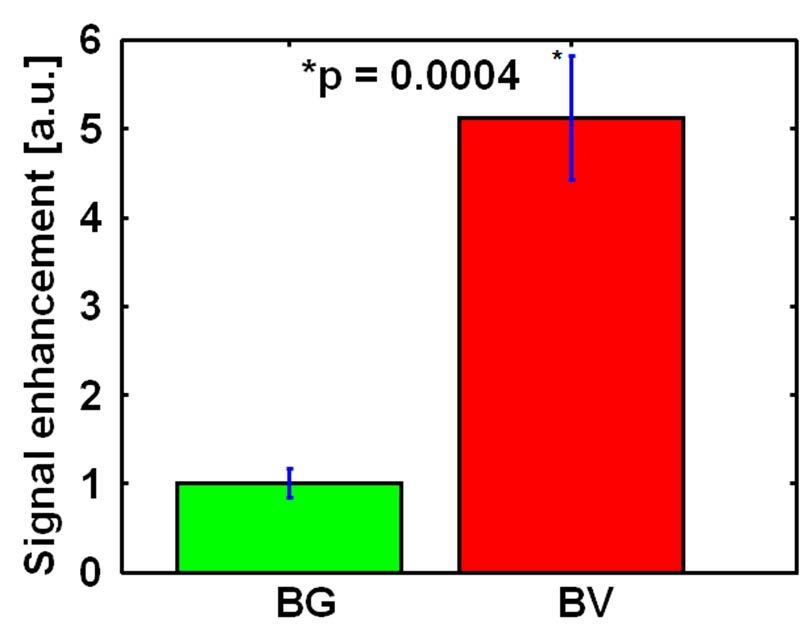
Volumetric photoacoustic imaging. (a) Control MAP image acquired before ICG injection in the axillary region. Blood vessels (BV) are seen. (b) Photoacoustic image acquired 0.2 hour after injection. Lymphatic vessels, as well as an SLN, are seen. (c) Three-dimensional photoacoustic image processed from the 0.7-hour postinjection data shown in Figure E1 (online). (d) Graph shows results of comparison of photoacoustic (PA) signals within the SLN and lymphatic vessels (LV) versus time before and after the injection in a given rat. The photoacoustic signals were normalized by the photoacoustic signals of adjacent blood vessels. (e) Graph shows results of statistical comparison of photoacoustic signal enhancement in the background (BG) (n = 5), SLN (n = 5), and lymphatic vessels (n = 4) at 0.2 and 1 hour after injection. The P values for the SLN and lymphatic vessels, respectively, were less than .002 and .001 at 0.2 hour after injection and less than .001 and .13 at 1 hour after injection. (f) Photographs of rat before dissection (top), axillary region after dissection (bottom left), and ICG-dyed lymph node (bottom right). a.u. = Arbitrary units (AU), error bars in d = standard deviation, error bars in e = standard error of the mean.
Planar Fluorescence Imaging System and Experiment
The planar fluorescence imaging system is shown in Figure 1b. The 784-nm, 80-mW light beam (Thorlabs, Newton, NJ) was expanded by a concave lens and illuminated the axilla of the animal. A fluorescent band-pass filter (F10–830; CVI Laser, Albuquerque, NM) was mounted onto the front of a cooled charge-coupled device camera (BU401–BR; Andor Technology, South Windsor, Conn). Emitted fluorescent light was collected by the camera. Three new rats were examined by using the fluorescence imaging system; two for SLN mapping until 1 hour after ICG injection and one for the study of spatial resolution degradation with additional chicken breast tissue. We quantified fluorescent signals by spatially averaging local fluorescent intensities within the SLN for 1 hour after the injection in a rat. The error bars were based on the variation of fluorescent intensities within the SLN.
Figure 1b:

(a) Experimental setup of the photoacoustic imaging system. (b) Experimental setup of the fluorescence imaging system. CCD = charge-coupled device. (c) Optical spectrum of 1 mmol/L ICG. A wavelength of 668 nm was used for photoacoustic imaging experiments. For spectroscopic photoacoustic imaging, wavelengths of 618 and 668 nm were chosen.
Image Degradation Study with Additional Biologic Tissues
We examined the degradation of spatial resolution in both photoacoustic and fluorescence images when the imaging depth was incremented. Using two rats for photoacoustic imaging and one rat for fluorescence imaging, 1 hour after the ICG injection we added chicken breast tissue on top of the axillary region. Most SLNs are about 2 mm deep below the skin surface in the axillary region in rats. After we added one 3–4-mm-thick layer of chicken breast, the depth was increased to 5–6 mm. By adding a second 2–3-mm-thick layer of chicken breast, we extended the total depth to approximately 8 mm. Our hypothesis was that the spatial resolution of the photoacoustic imaging system would be approximately maintained at the relatively low ultrasonic frequency even though the imaging depth was extended, since the resolution is determined by ultrasonic parameters (15). However, the spatial resolution of fluorescence imaging is expected to become worse because of strong light scattering. We compared the 1D profiles taken from each photoacoustic MAP image and planar fluorescence image. Those 1D profiles were shifted and normalized according to the equation , where S denotes the photoacoustic or fluorescence signal, S
max denotes the maximum signal, and S
bg denotes the background signal. The full widths at half maximum (FWHMs) of those 1D profiles, which were closely correlated with the spatial resolutions of both imaging systems, were estimated.
where S denotes the photoacoustic or fluorescence signal, S
max denotes the maximum signal, and S
bg denotes the background signal. The full widths at half maximum (FWHMs) of those 1D profiles, which were closely correlated with the spatial resolutions of both imaging systems, were estimated.
Spectroscopic Photoacoustic Imaging
Prior to the injection of ICG, the SLN and lymphatic vessels were not visible in control images. After the injection of ICG, the SLN and lymphatic vessels were difficult to distinguish from the surrounding blood vasculature without a proper control image. However, the SLN and lymphatic vessels can be distinguished from the surrounding blood vasculature by collecting images at two wavelengths (668 and 618 nm) after ICG injection. Because of the different absorption coefficients of blood and ICG at these optical wavelengths, lymphatic structures can be effectively differentiated from blood vessels by comparing the images acquired. First, we imaged the axillary region of one rat at 668 nm until 2.2 hours after the injection, and then we imaged the same region at 618 nm. After that, we switched the wavelength back to 668 nm to confirm that the disappeared photoacoustic signals within the SLNs came from the wavelength switch instead of from ICG clearance. We quantified photoacoustic signals by spatially averaging local photoacoustic amplitudes within the SLN and the adjacent blood vessels for 3.2 hours after the injection. The error bars were based on the variation of the photoacoustic signals within the SLN and blood vessels. Blood has more absorption at 618 nm than at 668 nm (18), so the photoacoustic signals at 618 nm were expected to be stronger in blood. However, ICG has much less absorption at 618 nm than at 668 nm (14), so the photoacoustic signals in ICG-dyed SLNs at 668 nm were expected to be stronger.
Statistical Analysis
The results from all five rats imaged with photoacoustic imaging were used for the statistical assessment of SLNs, whereas the results from only four rats imaged with photoacoustic imaging were used for the assessment of lymphatic vessels, since the lymphatic vessels were not visible in one experiment. The photoacoustic signal enhancement of SLNs and lymphatic vessels at 0.2 hour after injection was calculated, and then logarithmic transformation was applied to the photoacoustic signal enhancement for a better satisfaction of the normality assumption. Student paired t tests were performed to compare the pre- and postinjection differences. Note that the use of the paired t test based on a logarithmic scale was also equivalent to testing whether the photoacoustic signal enhancements (ie, the fold changes) of SLNs and lymphatic vessels were equal to 1. Statistical analyses were performed by using standard software (SAS, version 9; SAS Institute, Cary, NC). A P value of less than .05 was considered to indicate a significant difference, and all statistical tests were two sided.
Results
Volumetric Photoacoustic Imaging
Figure 2a shows the control image in one rat before the administration of ICG; the image depicts the surrounding vascular structures. The average photoacoustic signal enhancement from blood vessels was 5.1 AU ± 0.7 (standard error of the mean) (Figure E2 [online]). In Figure 2b, the SLN and lymphatic vessels, along with the surrounding blood vessels, are clearly shown at 0.2 hour after injection. Figure 2c shows a volumetric rendering of the data at 0.7 hour after injection (Figure E1 [online]). In addition to the SLN and lymphatic vessels, the functioning of the lymphatic valves can be inferred because lymphatic vessels were expanded immediately after the injection of ICG and then compressed. The photoacoustic signal in the SLN at 0.2 hour after injection was 0.96 AU ± 0.038 (standard deviation), a 7.4-fold increase over the value of 0.13 AU ± 0.13 before injection (Fig 2d and Figure E1 [online]). Furthermore, the signal (1.13 AU ± 0.038) at 1.2 hours after injection had increased by 18% over the signal at 0.2 hour after injection. The photoacoustic signals in two lymphatic vessel locations were 1.08 AU ± 0.048 (location 1) and 1.09 AU ± 0.073 (location 2) at 0.2 hour after injection, which represented nine- and 11-fold increases, respectively, over the values before injection. However, at 1.2 hours after injection, the signals (0.51 AU ± 0.034 for location 1 and 0.24 AU ± 0.001 for location 2) had decreased by 53% and 78%, respectively, from those at 0.2 hour after injection. In addition, after 1.5 hours, the photoacoustic signals from the SLN and the lymphatic vessels fluctuated slightly, moving in opposition. These results can be explained by the compression and expansion phases of lymphatic vessels. Furthermore, the ICG started to diffuse to a second lymph node at 1.7 hours after injection (Figure E1 [online]). Figure 2e shows the results of a statistical comparison of photoacoustic signal enhancement within the background, SLN, and lymphatic vessels at 0.2 and 1 hour after injection. In all five rats imaged with photoacoustic imaging, SLNs were clearly visible, with a photoacoustic signal enhancement of 5.9 AU ± 1.8 (standard error of the mean) (P < .002) at 0.2 hour after injection, while lymphatic vessels were seen in four of the five rats, with a photoacoustic signal enhancement of 4.3 AU ± 0.6 (P = .001). At 1 hour after injection, the photoacoustic signal enhancement from the SLN increased to 7.1 AU ± 2.2 (P < .001), but the enhancement from the lymphatic vessels decreased to 1.9 AU ± 0.2 (P = .13). The greenish lymph node dissected after photoacoustic imaging confirmed ICG uptake (Fig 2f), because normal lymph nodes do not have any green color.
Figure 2b:
Volumetric photoacoustic imaging. (a) Control MAP image acquired before ICG injection in the axillary region. Blood vessels (BV) are seen. (b) Photoacoustic image acquired 0.2 hour after injection. Lymphatic vessels, as well as an SLN, are seen. (c) Three-dimensional photoacoustic image processed from the 0.7-hour postinjection data shown in Figure E1 (online). (d) Graph shows results of comparison of photoacoustic (PA) signals within the SLN and lymphatic vessels (LV) versus time before and after the injection in a given rat. The photoacoustic signals were normalized by the photoacoustic signals of adjacent blood vessels. (e) Graph shows results of statistical comparison of photoacoustic signal enhancement in the background (BG) (n = 5), SLN (n = 5), and lymphatic vessels (n = 4) at 0.2 and 1 hour after injection. The P values for the SLN and lymphatic vessels, respectively, were less than .002 and .001 at 0.2 hour after injection and less than .001 and .13 at 1 hour after injection. (f) Photographs of rat before dissection (top), axillary region after dissection (bottom left), and ICG-dyed lymph node (bottom right). a.u. = Arbitrary units (AU), error bars in d = standard deviation, error bars in e = standard error of the mean.
Figure 2c:
Volumetric photoacoustic imaging. (a) Control MAP image acquired before ICG injection in the axillary region. Blood vessels (BV) are seen. (b) Photoacoustic image acquired 0.2 hour after injection. Lymphatic vessels, as well as an SLN, are seen. (c) Three-dimensional photoacoustic image processed from the 0.7-hour postinjection data shown in Figure E1 (online). (d) Graph shows results of comparison of photoacoustic (PA) signals within the SLN and lymphatic vessels (LV) versus time before and after the injection in a given rat. The photoacoustic signals were normalized by the photoacoustic signals of adjacent blood vessels. (e) Graph shows results of statistical comparison of photoacoustic signal enhancement in the background (BG) (n = 5), SLN (n = 5), and lymphatic vessels (n = 4) at 0.2 and 1 hour after injection. The P values for the SLN and lymphatic vessels, respectively, were less than .002 and .001 at 0.2 hour after injection and less than .001 and .13 at 1 hour after injection. (f) Photographs of rat before dissection (top), axillary region after dissection (bottom left), and ICG-dyed lymph node (bottom right). a.u. = Arbitrary units (AU), error bars in d = standard deviation, error bars in e = standard error of the mean.
Figure 2d:

Volumetric photoacoustic imaging. (a) Control MAP image acquired before ICG injection in the axillary region. Blood vessels (BV) are seen. (b) Photoacoustic image acquired 0.2 hour after injection. Lymphatic vessels, as well as an SLN, are seen. (c) Three-dimensional photoacoustic image processed from the 0.7-hour postinjection data shown in Figure E1 (online). (d) Graph shows results of comparison of photoacoustic (PA) signals within the SLN and lymphatic vessels (LV) versus time before and after the injection in a given rat. The photoacoustic signals were normalized by the photoacoustic signals of adjacent blood vessels. (e) Graph shows results of statistical comparison of photoacoustic signal enhancement in the background (BG) (n = 5), SLN (n = 5), and lymphatic vessels (n = 4) at 0.2 and 1 hour after injection. The P values for the SLN and lymphatic vessels, respectively, were less than .002 and .001 at 0.2 hour after injection and less than .001 and .13 at 1 hour after injection. (f) Photographs of rat before dissection (top), axillary region after dissection (bottom left), and ICG-dyed lymph node (bottom right). a.u. = Arbitrary units (AU), error bars in d = standard deviation, error bars in e = standard error of the mean.
Figure 2e:

Volumetric photoacoustic imaging. (a) Control MAP image acquired before ICG injection in the axillary region. Blood vessels (BV) are seen. (b) Photoacoustic image acquired 0.2 hour after injection. Lymphatic vessels, as well as an SLN, are seen. (c) Three-dimensional photoacoustic image processed from the 0.7-hour postinjection data shown in Figure E1 (online). (d) Graph shows results of comparison of photoacoustic (PA) signals within the SLN and lymphatic vessels (LV) versus time before and after the injection in a given rat. The photoacoustic signals were normalized by the photoacoustic signals of adjacent blood vessels. (e) Graph shows results of statistical comparison of photoacoustic signal enhancement in the background (BG) (n = 5), SLN (n = 5), and lymphatic vessels (n = 4) at 0.2 and 1 hour after injection. The P values for the SLN and lymphatic vessels, respectively, were less than .002 and .001 at 0.2 hour after injection and less than .001 and .13 at 1 hour after injection. (f) Photographs of rat before dissection (top), axillary region after dissection (bottom left), and ICG-dyed lymph node (bottom right). a.u. = Arbitrary units (AU), error bars in d = standard deviation, error bars in e = standard error of the mean.
Figure 2f:

Volumetric photoacoustic imaging. (a) Control MAP image acquired before ICG injection in the axillary region. Blood vessels (BV) are seen. (b) Photoacoustic image acquired 0.2 hour after injection. Lymphatic vessels, as well as an SLN, are seen. (c) Three-dimensional photoacoustic image processed from the 0.7-hour postinjection data shown in Figure E1 (online). (d) Graph shows results of comparison of photoacoustic (PA) signals within the SLN and lymphatic vessels (LV) versus time before and after the injection in a given rat. The photoacoustic signals were normalized by the photoacoustic signals of adjacent blood vessels. (e) Graph shows results of statistical comparison of photoacoustic signal enhancement in the background (BG) (n = 5), SLN (n = 5), and lymphatic vessels (n = 4) at 0.2 and 1 hour after injection. The P values for the SLN and lymphatic vessels, respectively, were less than .002 and .001 at 0.2 hour after injection and less than .001 and .13 at 1 hour after injection. (f) Photographs of rat before dissection (top), axillary region after dissection (bottom left), and ICG-dyed lymph node (bottom right). a.u. = Arbitrary units (AU), error bars in d = standard deviation, error bars in e = standard error of the mean.
Planar Fluorescence Imaging
By using the planar fluorescence imaging system, the dynamics of ICG uptake by the SLN were monitored. A large amount of ICG was trapped by the lymphatic vessels right after the injection. As time passed, the fluorescent signal within the SLN overwhelmed the signal from the lymphatic vessels and reached a steady state 40 minutes after the injection (Fig 3).
Figure 3a:

(a) Coronal planar fluorescence images acquired before injection (Control) and 0, 5, and 30 minutes after injection of ICG in a rat. LV = lymphatic vessel. (b) Bar graph shows changes in fluorescence signals within the SLN region after the injection.
Figure 3b:

(a) Coronal planar fluorescence images acquired before injection (Control) and 0, 5, and 30 minutes after injection of ICG in a rat. LV = lymphatic vessel. (b) Bar graph shows changes in fluorescence signals within the SLN region after the injection.
Image Degradation Study with Additional Biologic Tissues
Figure 4 shows MAP and corresponding B-scan photoacoustic images at three different SLN depths after the injection. The SLNs are clearly seen in the MAP and B-scan images. The spatial resolution was fairly well maintained, although the imaging depth was increased. The average FWHM of the three 1D profiles in Figure 4b was 2.0 mm ± 0.2 (standard deviation), which is comparable to the measured size of a dissected lymph node. Figure 4c shows fluorescent images at three SLN depths. As the imaging depth was extended, the fluorescent images became blurred. The FWHMs of the three 1D profiles widened from 8 to 22 mm as the imaging depth increased (Fig 4d).
Figure 4a:

Comparison of spatial resolutions between photoacoustic and fluorescence images with increases in imaging depth increments. (a) Photoacoustic MAP (top row) and corresponding depth-resolved B-scan (bottom row) images of SLNs at three depths. (b) Graph shows results for three 1D profiles taken from along the dotted lines in the MAP images in a. (c) Fluorescence images of SLNs at three depths. (d) Graph shows results for three 1D profiles taken from along the dashed lines in c.
Figure 4b:

Comparison of spatial resolutions between photoacoustic and fluorescence images with increases in imaging depth increments. (a) Photoacoustic MAP (top row) and corresponding depth-resolved B-scan (bottom row) images of SLNs at three depths. (b) Graph shows results for three 1D profiles taken from along the dotted lines in the MAP images in a. (c) Fluorescence images of SLNs at three depths. (d) Graph shows results for three 1D profiles taken from along the dashed lines in c.
Figure 4c:

Comparison of spatial resolutions between photoacoustic and fluorescence images with increases in imaging depth increments. (a) Photoacoustic MAP (top row) and corresponding depth-resolved B-scan (bottom row) images of SLNs at three depths. (b) Graph shows results for three 1D profiles taken from along the dotted lines in the MAP images in a. (c) Fluorescence images of SLNs at three depths. (d) Graph shows results for three 1D profiles taken from along the dashed lines in c.
Figure 4d:

Comparison of spatial resolutions between photoacoustic and fluorescence images with increases in imaging depth increments. (a) Photoacoustic MAP (top row) and corresponding depth-resolved B-scan (bottom row) images of SLNs at three depths. (b) Graph shows results for three 1D profiles taken from along the dotted lines in the MAP images in a. (c) Fluorescence images of SLNs at three depths. (d) Graph shows results for three 1D profiles taken from along the dashed lines in c.
Spectroscopic Photoacoustic Imaging
The image representing subtraction of the 0.2-hour postinjection image at 668 nm from the 2.2-hour postinjection image at 618 nm showed the SLN and lymphatic vessels (Fig 5, Figure E3 [online]). The quantified photoacoustic signal within the SLN was 1.0 AU ± 0.07 (standard deviation), which was a sudden increase right after the injection compared with the signal (0.05 AU ± 0.009) before injection, and slowly decreased as time passed. When the wavelength was changed to 618 nm, the photoacoustic signal decreased to 0.04 AU ± 0.007, close to the signal level seen with no ICG present. The signal again increased to 0.5 AU ± 0.02 after the wavelength was switched to 668 nm. In contrast, the photoacoustic signals within the adjacent blood vessel remained at 0.77 AU ± 0.03 at 668 nm, not showing any variation due to ICG injection. Then, the signal increased to 1.0 AU ± 0.013 when the wavelength was changed to 618 nm. The signal decreased to 0.73 AU ± 0.15 after the wavelength was switched to 668 nm. These variations agree well with the optical spectrum of blood.
Figure 5a:

Spectroscopic photoacoustic images. (a) Image at 668 nm 0.2 hour after injection. (b) Image at 618 nm 2.2 hours after injection. (c) Image at 668 nm 2.8 hours after injection. (d) Graph shows comparison of spectroscopic photoacoustic (PA) signals within the SLN region over a period of time. (e) Graph shows comparison of spectroscopic photoacoustic signals within blood vessels (BV) over a period of time. LV = lymphatic vessel. Numbers in colored bar at top of d and e = wavelength in nanometers.
Figure 5b:

Spectroscopic photoacoustic images. (a) Image at 668 nm 0.2 hour after injection. (b) Image at 618 nm 2.2 hours after injection. (c) Image at 668 nm 2.8 hours after injection. (d) Graph shows comparison of spectroscopic photoacoustic (PA) signals within the SLN region over a period of time. (e) Graph shows comparison of spectroscopic photoacoustic signals within blood vessels (BV) over a period of time. LV = lymphatic vessel. Numbers in colored bar at top of d and e = wavelength in nanometers.
Figure 5c:

Spectroscopic photoacoustic images. (a) Image at 668 nm 0.2 hour after injection. (b) Image at 618 nm 2.2 hours after injection. (c) Image at 668 nm 2.8 hours after injection. (d) Graph shows comparison of spectroscopic photoacoustic (PA) signals within the SLN region over a period of time. (e) Graph shows comparison of spectroscopic photoacoustic signals within blood vessels (BV) over a period of time. LV = lymphatic vessel. Numbers in colored bar at top of d and e = wavelength in nanometers.
Figure 5d:

Spectroscopic photoacoustic images. (a) Image at 668 nm 0.2 hour after injection. (b) Image at 618 nm 2.2 hours after injection. (c) Image at 668 nm 2.8 hours after injection. (d) Graph shows comparison of spectroscopic photoacoustic (PA) signals within the SLN region over a period of time. (e) Graph shows comparison of spectroscopic photoacoustic signals within blood vessels (BV) over a period of time. LV = lymphatic vessel. Numbers in colored bar at top of d and e = wavelength in nanometers.
Figure 5e:

Spectroscopic photoacoustic images. (a) Image at 668 nm 0.2 hour after injection. (b) Image at 618 nm 2.2 hours after injection. (c) Image at 668 nm 2.8 hours after injection. (d) Graph shows comparison of spectroscopic photoacoustic (PA) signals within the SLN region over a period of time. (e) Graph shows comparison of spectroscopic photoacoustic signals within blood vessels (BV) over a period of time. LV = lymphatic vessel. Numbers in colored bar at top of d and e = wavelength in nanometers.
Discussion
Using volumetric spectroscopic photoacoustic and planar fluorescence imaging, we have demonstrated the feasibility of noninvasive in vivo dual-modality mapping of SLNs and lymphatic vessels with ICG. Unlike gold nanoparticles, ICG is a Food and Drug Administration–approved dye for determining human cardiac output, hepatic function, and blood flow and for ophthalmic angiography. Unlike methylene blue, it has less potential for chemical side effects and photodamage. By applying a spectroscopic approach, this photoacoustic imaging system is potentially more useful in clinical conditions.
Images from both techniques clearly show SLNs, lymphatic vessels, and the course and flow of lymphatic vessels. The lymphatic vessels are expanded and compressed passively by the periodic motion of adjunct structures. During the expansion, the initial lymphatic vessel traps a large amount of ICG owing to the opening of primary lymphatic valves, and this allows an influx of ICG to the initial lumen. At the same time, the secondary valve, the traditional intralymphatic valve, inside the initial channel is closed. During the compression, the secondary valve of the current lumen opens, and the dye is transported to the next lumen (19). Although the fluorescence images clearly show subcutaneous SLNs and lymphatic vessels, as Kitai et al (20) and Miyashiro et al (21) reported, it is difficult to map deeply positioned axillary lymph nodes noninvasively because of poor spatial resolution. In addition, to find a positive sentinel node using a molecular targeted contrast agent without biopsy, a high-spatial-resolution imaging technique is necessary.
Our study had limitations. Because of the slow image acquisition (23 minutes), this photoacoustic imaging system is not suitable for monitoring the dynamics of ICG in SLNs and lymphatic vessels compared with fluorescence imaging. However, this is not a fundamental limitation of photoacoustic imaging. The time limitation can be easily overcome if a US array (22,23) is used as a detector and/or a high frame rate of laser pulses with a high-speed scanning system (24) is used. In addition, although we have conducted preliminary studies of the uptake dynamics of ICG on SLNs by using both imaging systems, further quantitative studies are required on the uptake and clearance times of ICG and the uptake amount as a function of ICG injection concentration. Moreover, although ICG is a near-infrared dye, the peak absorption of ICG in this study was shifted to 700 nm because of the aggregation of ICG molecules (14,25). Thus, more stable ICG derivative dyes (13) need to be tested to take full advantage of the high molecular extinction of the dye and the optically optimal tissue transparent window at the near-infrared dye region.
Practical applications: The potential clinical implications are important. The ability to visualize the axillary SLNs in vivo permits the translation of this technology to the clinical realm. Image-guided biopsy of breast masses and lesions has become the standard of care. Although the use of standard axillary US is helpful in a subset of patients with breast cancer, it is only helpful if the patient is found to have morphologically abnormal axillary lymph nodes. To date, to our knowledge, there has not been a reliable method to identify the SLN noninvasively. The combination of the described noninvasive dual-modality method of SLN identification and percutaneous biopsy of the identified SLNs would allow clinicians the ability to diagnose the presence or absence of malignancy and direct further treatment on the basis of those findings.
In summary, noninvasive dual-modality (volumetric spectroscopic photoacoustic and planar fluorescence imaging) in vivo mapping of SLNs and lymphatic vessels using ICG as a contrast agent was successfully accomplished in rats.
Advance in Knowledge.
Nonionizing volumetric spectroscopic photoacoustic imaging can noninvasively map sentinel lymph nodes and lymphatic vessels with high spatial resolution in healthy rats with the use of indocyanine green (ICG) in vivo.
Implication for Patient Care.
Volumetric spectroscopic photoacoustic imaging with ICG can potentially be used as a clinical tool for staging disease in patients with breast cancer.
Supplementary Material
Received February 16, 2009; revision requested March 16; revision received June 19; accepted July 29; final version accepted November 16.
This research was supported by the National Institutes of Health (grants R01 EB000712, R01 EB008085, R01 NS46214, U54 CA136398).
L.V.W. has a financial interest in Endra (Ann Arbor, Mich), which, however, did not support this work.
Abbreviations:
- AU
- arbitrary units
- FWHM
- full width at half maximum
- ICG
- indocyanine green
- MAP
- maximum amplitude projection
- 1D
- one-dimensional
- SLN
- sentinel lymph node
References
- 1.Kobayashi H, Kawamoto S, Sakai Y, et al. Lymphatic drainage imaging of breast cancer in mice by micro-magnetic resonance lymphangiography using a nano-size paramagnetic contrast agent. J Natl Cancer Inst 2004;96(9):703–708 [DOI] [PubMed] [Google Scholar]
- 2.McMasters KM, Tuttle TM, Carlson DJ, et al. Sentinel lymph node biopsy for breast cancer: a suitable alternative to routine axillary dissection in multi-institutional practice when optimal technique is used. J Clin Oncol 2000;18(13):2560–2566 [DOI] [PubMed] [Google Scholar]
- 3.Ung OA. Australasian experience and trials in sentinel lymph node biopsy: the RACS SNAC trial. Asian J Surg 2004;27(4):284–290 [DOI] [PubMed] [Google Scholar]
- 4.Purushotham AD, Upponi S, Klevesath MB, et al. Morbidity after sentinel lymph node biopsy in primary breast cancer: results from a randomized controlled trial. J Clin Oncol 2005;23(19):4312–4321 [DOI] [PubMed] [Google Scholar]
- 5.Krishnamurthy S, Sneige N, Bedi DG, et al. Role of ultrasound-guided fine-needle aspiration of indeterminate and suspicious axillary lymph nodes in the initial staging of breast carcinoma. Cancer 2002;95(5):982–988 [DOI] [PubMed] [Google Scholar]
- 6.Padera TP, Kadambi A, di Tomaso E, et al. Lymphatic metastasis in the absence of functional intratumor lymphatics. Science 2002;296(5574):1883–1886 [DOI] [PubMed] [Google Scholar]
- 7.Kwon S, Sevick-Muraca EM. Noninvasive quantitative imaging of lymph function in mice. Lymphat Res Biol 2007;5(4):219–231 [DOI] [PubMed] [Google Scholar]
- 8.Baluk P, Fuxe J, Hashizume H, et al. Functionally specialized junctions between endothelial cells of lymphatic vessels. J Exp Med 2007;204(10):2349–2362 [DOI] [PMC free article] [PubMed] [Google Scholar]
- 9.Wang X, Pang Y, Ku G, Xie X, Stoica G, Wang LV. Noninvasive laser-induced photoacoustic tomography for structural and functional in vivo imaging of the brain. Nat Biotechnol 2003;21(7):803–806 [DOI] [PubMed] [Google Scholar]
- 10.Zhang HF, Maslov K, Stoica G, Wang LV. Functional photoacoustic microscopy for high-resolution and noninvasive in vivo imaging. Nat Biotechnol 2006;24(7):848–851 [DOI] [PubMed] [Google Scholar]
- 11.Song KH, Stein EW, Margenthaler JA, Wang LV. Noninvasive photoacoustic identification of sentinel lymph nodes containing methylene blue in vivo in a rat model. J Biomed Opt 2008;13(5):054033. [DOI] [PMC free article] [PubMed] [Google Scholar]
- 12.Song KH, Kim C, Cobley CM, Xia Y, Wang LV. Near-infrared gold nanocages as a new class of tracers for photoacoustic sentinel lymph node mapping on a rat model. Nano Lett 2009;9(1):183–188 [DOI] [PMC free article] [PubMed] [Google Scholar]
- 13.Li M, Oh J, Xie X, et al. Simultaneous molecular and hypoxia imaging of brain tumors in vivo using spectroscopic photoacoustic tomography. Proc IEEE 2008;96(3):481–489 [Google Scholar]
- 14.Oregon Medical Laser Center Web site [Accessed September 4, 2008]. http://omlc.ogi.edu/spectra/icg/index.html. Updated 2007.
- 15.Song KH, Wang LV. Deep reflection-mode photoacoustic imaging of biological tissue. J Biomed Opt 2007;12(6):060503. [DOI] [PubMed] [Google Scholar]
- 16.Maslov K, Stoica G, Wang LV. In vivo dark-field reflection-mode photoacoustic microscopy. Opt Lett 2005;30(6):625–627 [DOI] [PubMed] [Google Scholar]
- 17.American National Standards Institute American national standard for the safe use of lasers. ANSI Z136.1-2000 New York, NY: American National Standards Institute, 2007 [Google Scholar]
- 18.Oregon Medical Laser Center Web site [Accessed September 4, 2008]. http://omlc.ogi.edu/spectra/hemoglobin/. Updated 2007.
- 19.Schmid-Schönbein GW. The second valve system in lymphatics. Lymphat Res Biol 2003;1(1):25–29; discussion 29–31 [DOI] [PubMed] [Google Scholar]
- 20.Kitai T, Inomoto T, Miwa M, Shikayama T. Fluorescence navigation with indocyanine green for detecting sentinel lymph nodes in breast cancer. Breast Cancer 2005;12(3):211–215 [DOI] [PubMed] [Google Scholar]
- 21.Miyashiro I, Miyoshi N, Hiratsuka M, et al. Detection of sentinel node in gastric cancer surgery by indocyanine green fluorescence imaging: comparison with infrared imaging. Ann Surg Oncol 2008;15(6):1640–1643 [DOI] [PubMed] [Google Scholar]
- 22.Liang S, Konstantin M, Bitton R, et al. Fast 3-D dark-field reflection-mode photoacoustic microscopy in vivo with a 30-MHz ultrasound linear array. J Biomed Opt 2008;13(5):054208. [DOI] [PMC free article] [PubMed] [Google Scholar]
- 23.Ephrat P, Roumeliotis M, Prato FS, Carson JJ. Four-dimensional photoacoustic imaging of moving targets. Opt Express 2008;16(26):21570–21581 [DOI] [PubMed] [Google Scholar]
- 24.Maslov K, Zhang HF, Hu S, Wang LV. Optical-resolution photoacoustic microscopy for in vivo imaging of single capillaries. Opt Lett 2008;33(9):929–931 [DOI] [PubMed] [Google Scholar]
- 25.Landsman ML, Kwant G, Mook GA, Zijlstra WG. Light-absorbing properties, stability, and spectral stabilization of indocyanine green. J Appl Physiol 1976;40(4):575–583 [DOI] [PubMed] [Google Scholar]
Associated Data
This section collects any data citations, data availability statements, or supplementary materials included in this article.