Abstract
In microorganisms, noise in gene expression gives rise to cell-to-cell variability in protein concentrations1–7. In mammalian cells, protein levels also vary8–10 and individual cells differ widely in responsiveness to uniform physiological stimuli11–15. In the case of apoptosis mediated by TRAIL (TNF related apoptosis-inducing ligand) it is common for some cells in a clonal population to die while others survive – a striking divergence in cell fate. Among cells that die, the time between TRAIL exposure and caspase activation is highly variable. Here we image sister cells expressing reporters of caspase activation and mitochondrial outer membrane permeabilisation (MOMP) following exposure to TRAIL. We show that naturally occurring differences in the levels or states of proteins regulating receptor-mediated apoptosis are the primary causes of cell-to-cell variability in the timing and probability of death. Protein state is transmitted from mother to daughter, giving rise to transient heritability in fate, but protein synthesis promotes rapid divergence so that sister cells soon become no more similar to each other than pairs of cells chosen at random. Our results have implications for understanding “fractional killing” of tumor cells following exposure to chemotherapy, and for variability in mammalian signal transduction in general.
TRAIL elicits a heterogeneous phenotypic response in both sensitive and relatively resistant cell lines: some cells die within 45 min, others 8–12 hr later, and yet others live indefinitely (Supplementary Fig. 1). During the variable delay between TRAIL addition and MOMP, upstream initiator caspases are active but downstream effector caspases are not11,12. Possible sources of cell-to-cell variability in responses to TRAIL include genetic or epigenetic differences, stochastic fluctuations in biochemical reactions involving low copy number components (“intrinsic noise”3), differences in cell cycle phase, and natural variation in the concentrations of key reactants. To distinguish among these and other possibilities, we used live-cell microscopy to compare the timing and probability of death in sister cells exposed to TRAIL. Were phenotypic variability caused by genetic or epigenetic differences, sister cells should behave identically. In contrast, were stochastic fluctuations in reactions triggered by TRAIL to predominate, sister cells should be no more similar to each other than pairs of cells selected at random. The influence of cell cycle state on apoptosis should be readily observable from time-lapse imaging of asynchronous cultures. Finally, variability arising from differences in protein levels (or in activity or modification state) should produce a highly distinctive form of inheritance in which newly born sister cells are very similar, because they inherit similar numbers of abundant factors from their mother4,7, but then diverge as new proteins are made and levels drift10,16. With this in mind, we examined apoptosis in HeLa cells and in non-transformed MCF10A mammary epithelial cells in the presence and absence of protein synthesis inhibitors.
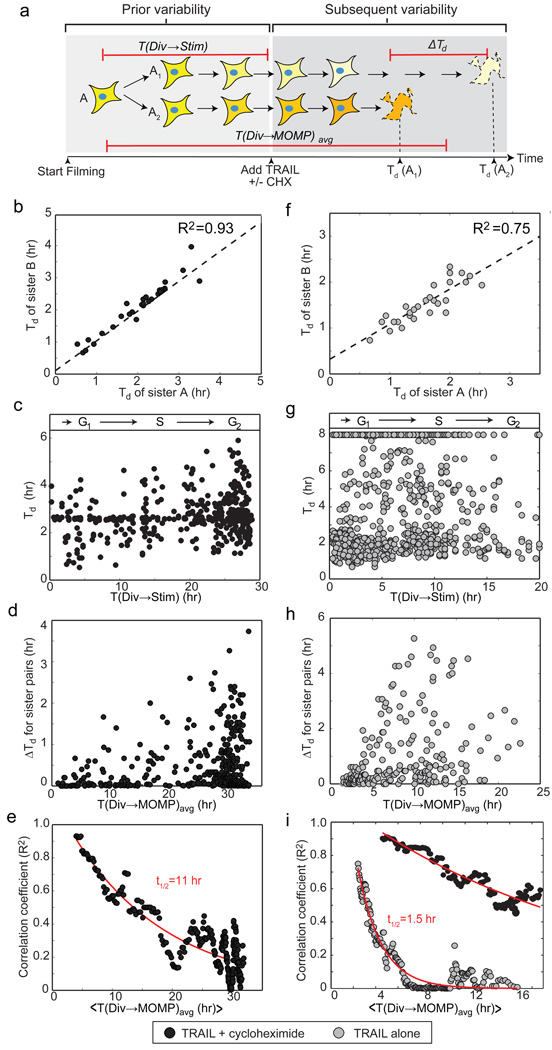
Pairs of sister cells expressing a fluorescent reporter of MOMP (IMS-RP11) born during a 20–30 hr period were identified by time-lapse microscopy. TRAIL and the protein synthesis inhibitor cycloheximide were then added and filming continued for another 8 hr. The TRAIL to MOMP interval (Td) was calculated for each cell (Fig. 1a). Among recently divided sisters (< 7 hr between division and death), Td was highly correlated (R2 = 0.93, Fig. 1b) whereas Td was uncorrelated (R2 = 0.04) for recently divided cells chosen at random. Time since division (Fig. 1c) and position in the dish (data not shown) did not correlate with Td, ruling out a role for cycle state and cell-cell interactions under our experimental conditions. However, as time since division increased, sister-to-sister correlation in Td decayed exponentially with a half-life of ~11 hr so that sisters lost memory of shared ancestry within 50 hours or about 2 cell generations (R2 ≤ 0.05, the same as random pairs of cells; Fig. 1d,e). Similar results were obtained with MCF10A cells (Supplementary Fig. 2).
Figure 1. Time-to-death is highly correlated between HeLa sister cells but correlation decays as a function of time since division.
a, Schematic of experimental design. ΔTd represents the difference in time of MOMP between sisters; T(Div → MOMP)avg the time between cytokinesis of the mother and the average time of MOMP in daughter cells; T(Div → Stim) the time between cytokinesis and TRAIL addition. The shading of each cell depicts concentrations/states of relevant proteins. b and f, Similarity in Td among pairs of recently divided sister cells (T(Div → MOMP)avg < 7 hr for (b) and <3.5 hr for (f)). c and g, Td as a function of T(Div → Stim), a proxy for cell cycle state (R2 < 0.03). d and h, ΔTd as a function of T(Div → MOMPavg. e and i, Decay in the correlation of Td between sister pairs as a function of T(Div → MOMP)avg. In (i), black circles represent data for cells treated with TRAIL plus cycloheximide imaged in parallel with the TRAIL alone treatment (Supplementary Fig. 5).
High correlation among recently born sisters shows that variability in Td arises from differences that exist prior to TRAIL exposure and rules out stochastic fluctuations in signaling reactions. Rapid decorrelation also rules out genetic mutation or conventional epigenetic differences (which typically last 10–105 cell divisions17). However, transient heritability is precisely what we expected for cell-to-cell differences arising from variations in the concentrations or states of proteins that are partitioned binomially at cell division.
Whereas all TRAIL-treated HeLa cells eventually died in the presence of cyloheximide, in its absence a fraction always survived (presumably due to induction of survival pathways18). When the fates of sister cells were compared, both lived or both died in almost all cases (chi-square test, p=7×10⁻¹⁹, Supplementary Fig. 3). Variability in Td across the population was large (Fig. 1g and Supplementary Fig. 4), but recently born sisters were nevertheless correlated in Td (R2=0.75, Fig. 1f). Again, cell cycle phase was not correlated with fate or time-to-death (Fig. 1g). Decorrelation in Td among sisters was an order of magnitude more rapid in the presence of protein synthesis than in its absence (~1.5 hr half-life, Fig. 1h,i and Supplementary Fig. 5). Thus, the length of time that Td is heritable is very sensitive to rates of protein synthesis, both basal and TRAIL-induced.
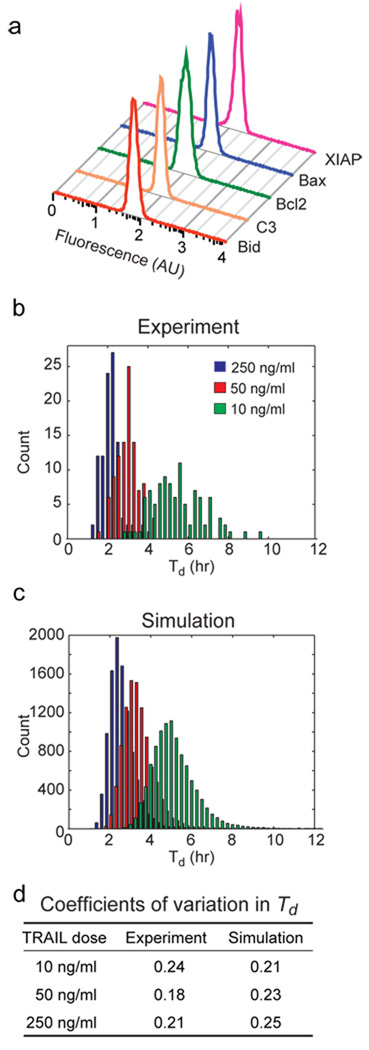
Are the concentrations of proteins regulating TRAIL-induced apoptosis sufficiently different from cell to cell to account for variability in Td? Using flow cytometry, we measured the distributions of five apoptotic regulators for which specific antibodies are available. All five proteins were log-normally distributed across the population with coefficients of variation between 0.21 and 0.28 for cells of similar size (Fig. 2a), consistent with data on other proteins10. To determine the impact of variability in protein levels on variability in time-to-death, we turned to an ordinary differential equation model of TRAIL-induced apoptosis12. This model encapsulates the biochemistry of TRAIL-mediated death and recapitulates the dynamics of apoptosis under various conditions of protein depletion or over-expression12. When variability in Td arising from variance in protein levels was modeled, a good match was observed to experimental data (Fig. 2b–d) implying that measured differences in protein levels are sufficient to account for variability in Td.
Figure 2. Endogenous variation in the concentrations of apoptotic regulators is sufficient to explain variability in Td.
a, Protein distributions in untreated HeLa cells determined by flow cytometry. b and c, Distributions of Td for HeLa cells treated with TRAIL at concentrations indicated (with cyloheximide) as determined experimentally (b) or estimated by simulations (c). d, Coefficients of variation for distributions in (b) and (c).
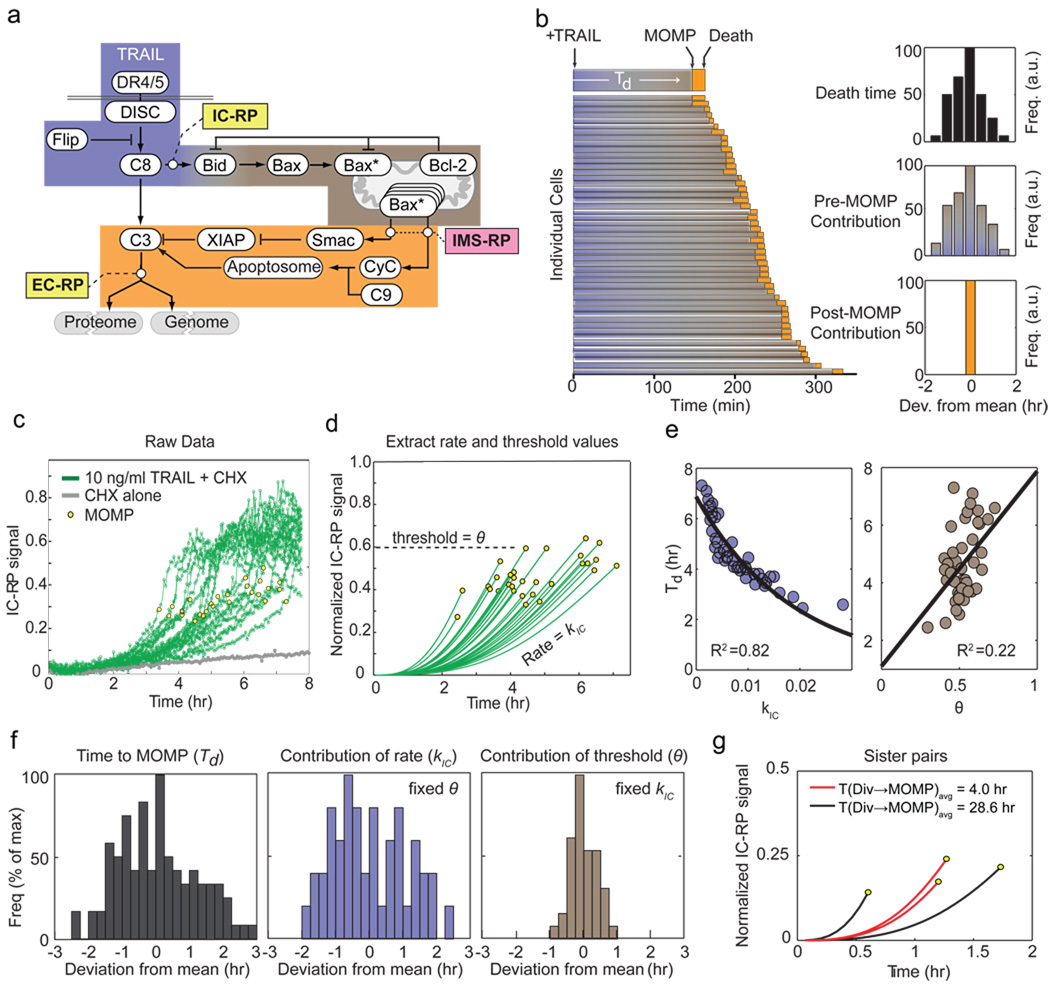
Which steps in receptor-mediated apoptosis are responsible for variation in time-to-death? To address this question, we grouped reactions into three sets: those occurring before, during, or subsequent to MOMP (Fig. 3a – blue, grey, and orange). Before MOMP, TRAIL binds and oligomerizes DR4/5 receptors, promoting assembly of death-inducing signaling complexes (DISCs) that then activate initiator pro-caspases-8 and -10 (C8/10)19. Active C8/10 cleaves Bid to tBid20,21, which activates the pore-forming proteins Bax and Bak22. C8/10 also processes effector pro-caspases-3 and −7 (C3/7) but C3/7 activity is held in check by XIAP until MOMP19. MOMP itself involves self-assembly of activated Bax/Bak into transmembrane pores, a process antagonized by anti-apoptotic Bcl-2 proteins22. When levels of activated tBid, Bax, and Bak exceed a threshold set by inhibitory Bcl-2 proteins, pores form in the mitochondrial outer membrane, allowing cytochrome c and Smac to translocate into the cytosol22. In post-MOMP reactions, cytosolic Smac neutralizes XIAP, relieving C3/7 inhibition and allowing cleavage of effector caspase substrates and consequent cell death19. In a parallel route to C3/C7 activation, cytosolic cytochrome c promotes apoptosome assembly and caspase-9 activation.
Figure 3. A single time-dependent process upstream of MOMP predicts time-to-death.
a, Schematic of receptor-mediated apoptosis signalling with IC-RP, EC-RP, and IMS-RP indicated. The Bcl-2 protein family is represented in simplified form by Bid, Bax, and Bcl-2. Reactions occur before (blue), during (grey), or subsequent to MOMP (orange). b, Timing of apoptotic events in HeLa cells expressing IMS-RP and EC-RP and treated with TRAIL; blue-grey denotes the pre-MOMP interval and orange the interval between MOMP and half-maximal cleavage of EC-RP (a marker of death). Insets show death times computed from data (top) and contributions of pre-MOMP (middle) or post-MOMP (top) intervals. c and d, Raw and fitted trajectories for IC-RP cleavage in single TRAIL-treated HeLa cells co-expressing IMS-RP and IC-RP. Values for height of the MOMP threshold (θ) and rate of approach to the threshold (kIC) were derived by fitting (Supplementary Fig. 6). e, Correlation between Td and kIC (left) or θ (right) for data in (d). f, Relative contributions of variability in kIC (blue) or θ (grey) to variability in Td (black; Supplementary Fig. 7). g, Trajectories of IC-RP cleavage in recently divided sister HeLa cells having similar Td (red) and older sisters with differing Td (black) treated with 50 ng/ml TRAIL.
To determine which steps in TRAIL-induced apoptosis play the greatest role in determining variability in death time, we imaged cells expressing a reporter of either initiator or effector caspase activity (IC-RP or EC-RP)11 in combination with IMS-RP. We found almost all variability in Td to arise during the pre-MOMP interval (Fig. 3b). The timing of MOMP itself is determined by the rate at which tBid accumulates to a threshold set by the levels of Bcl-2 family proteins. This rate and threshold can be determined from the initial rate of IC-RP cleavage (kIC) and the fraction of IC-RP cleaved (θ) at the time of MOMP, respectively. When kIC and θ were measured in single TRAIL-treated cells, the timing of MOMP was found to be controlled by a variable rate of approach to a threshold of variable height (Fig. 3c,d). However, variation in kIC played a significantly greater role in determining Td than variation in θ (R2=0.82 vs. R2=0.22; Fig. 3e,f, and Supplementary Fig. 7). Moreover, kIC was very similar in recently born sister cells with similar Td, but dissimilar in older sisters (Fig. 3g). We conclude that cell-to-cell variability in kIC – and by implication the rate of conversion of Bid to tBid – is the primary determinant of variability in time-to-death under our experimental conditions.
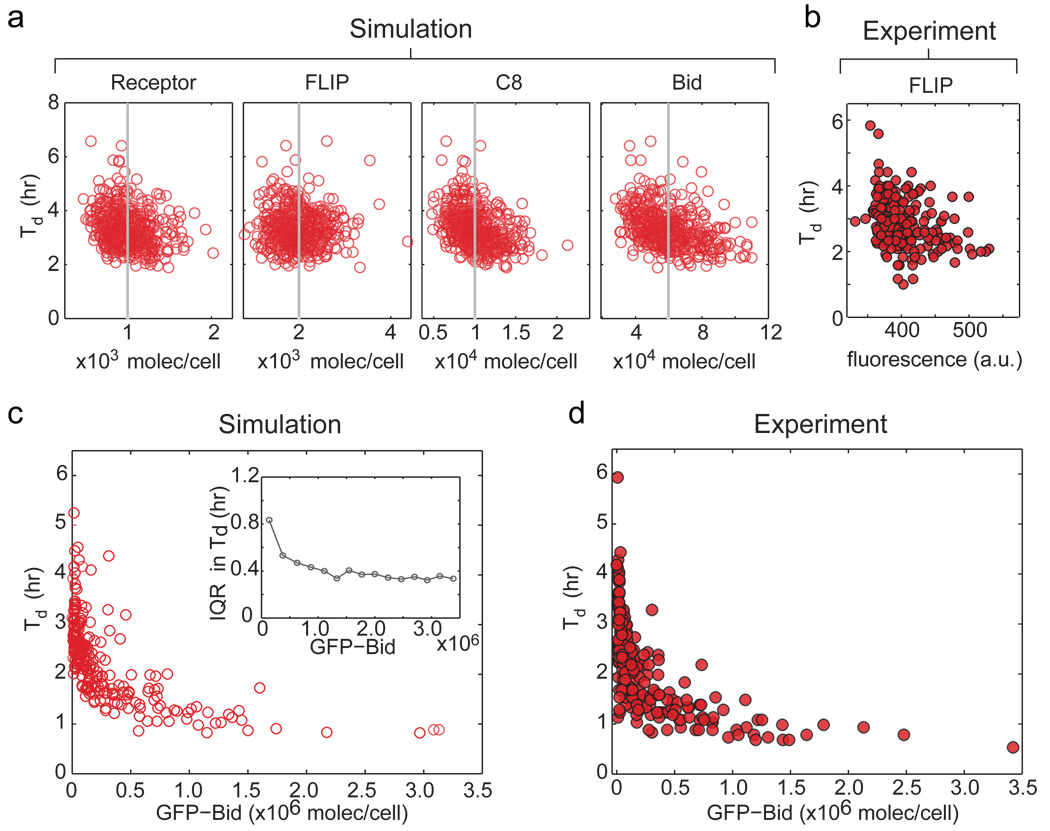
Levels of multiple proteins set kIC, including DR4/5 receptors, DISC components, C8, and Bid itself. Modelling suggested that knowing the concentration of any single protein upstream of Bid would have minimal value in predicting Td – the impact of variation in all other proteins is too great (Fig. 4a). Live-cell analysis of FLIP, an important regulator of pro-caspase-8 binding to the DISC, was consistent with this prediction, as was analysis of other single proteins by flow cytometry (Fig. 4b and data not shown). However, modelling showed that with increasing over-production of Bid, measurement of its levels would be increasingly predictive of Td (Fig. 4c, Supplementary Fig. 8). We therefore measured the relationship between dispersion in Td and levels of Bid-GFP (Fig. 4d). A ~50-fold increase in Bid-GFP caused the variability in Td to fall significantly, concomitant with a decrease in mean time-to-death from ~3 hr to ~45 min. Thus, only when over-expressed is the level of one protein predictive of Td; under normal circumstances, control is multivariate.
Figure 4. No single protein predicts Td under normal conditions but over-expression can increase predictability.
a, Td as a function of four protein levels based on simulation. Grey lines denote mean protein concentration; each point represents a single simulated cell. b, Death time as a function of endogenous FLIP levels in H1299 cells. c and d, Effect of GFP-Bid over-expression on Td in HeLa cells, as predicted by simulation (c) or observed in experiment (d). Inset shows reduction in dispersion of Td with increasing Bid, as measured by interquartile range (IQR; Supplementary Fig. 8).
Other studies (for example, ref. 23) address genetic factors determining the average sensitivity of cell lines to TRAIL whereas this paper examines non-genetic cell-to-cell variability within an individual cell line. We come to three primary conclusions. First, cell-to-cell variation in the timing and probability of death is transiently heritable. Cell cycle state, number of neighbouring cells, and stochastic fluctuations in TRAIL-induced signalling reactions do not play a major role under our conditions. Instead, variability in phenotype arises from cell-to-cell differences in protein levels that exist prior to TRAIL exposure (our experiments do not distinguish between cell-to-cell differences in total concentrations or in post-translationally modified forms). Second, the rate at which sisters lose memory of a shared past is an order of magnitude faster in the presence of protein translation than in its absence. This further implicates variability in protein levels as the origin of differences in phenotype. Third, knowing the concentration of individual proteins does not allow Td to be predicted but measuring the rate of a single reaction does (Bid to tBid conversion in our experiments). These findings are likely to hold for other examples of ligand-induced apoptosis, however for intrinsic apoptosis, different proteins will control the rate of approach to MOMP and θ may dominate in certain contexts. Moreover, given the prevalence of multi-protein cascades in signal transduction, multivariate control over cell-to-cell variability is likely to be more common than the univariate control observed in other settings8,23,24.
Heritable, non-genetic determinants of phenotype are often referred to as “epigenetic”17, but the transient heritability we observe is fundamentally different in origin and duration. Given variability in growth rates and noise in gene expression, genetically identical cells will inevitably contain slightly different concentrations of most proteins. However, differences in protein concentrations do not necessarily affect phenotype, a property often referred to as robustness25. For example, the efficiency with which effector caspase substrates are cleaved does not vary from cell to cell11. Given the importance of tight control over apoptosis, cell-to-cell variability in the timing and probability of death seems unlikely to reflect an inability of cells to achieve robust regulation. Instead, by transforming what is a binary decision at the single-cell level into a graded response at the population level, variability probably has an adaptive advantage. TRAIL is currently undergoing clinical trials as an anti-cancer drug26 and our findings may have implications for the use of TRAIL and other apoptosis inducers as therapeutics. Many drugs exhibit “fractional killing” in which each round of therapy kills some but not all of the cells in a tumor27. Traditionally, this is thought to reflect differences in genotype, cell cycle state, or the involvement of cancer stem cells, but our data demonstrate that dramatic variability can also arise from natural differences in protein levels. We propose that the efficiency of TRAIL-mediated killing of cancer cells could be increased by reducing the impact of cell-to-cell variability, perhaps through co-drugging.
Methods Summary
Live-cell microscopy
Cells expressing IMS-RP and FRET reporters EC-RP or IC-RP were imaged as described11. In Figure 1, cells were imaged for 20–30hr to determine time of division and identify sisters; then media containing 50 ng/ml TRAIL plus 2.5 µg/ml cycloheximide or 250 ng/ml TRAIL alone was added. The difference in TRAIL concentrations was designed to generate a similar range in Td with and without cycloheximide (Supplementary Fig. 4). Cells were then imaged for 8 hr to determine the time of MOMP, by monitoring cytosolic translocation of IMS-RP. Unless otherwise noted, all treatments included 2.5 µg/ml cycloheximide.
Data analysis
Correlation coefficients (R2) were obtained by linear regression except where noted. Sister-sister correlation was determined by sorting pairs of cells on T(Div → MOMP)avg and calculating R2 for the first 40 pairs. R2 was then re-calculated for cells 2–41, 3–42, etc., and the results plotted as a function of the average T(Div → MOMP)avg for the 40 cells in question, denoted by “< >”. The results were fit to an exponential decay: R2 = 1.2e(−0.063T(Div→MOMP)avg) for TRAIL plus cycloheximide, and R2 = 2.3e(−0.47T(Div→MOMP)avg) for TRAIL alone. Half-lives were calculated as ln(2)/0.063 = 11 hr, and ln(2)/0.47 = 1.5 hr. Contributions to Td of kIC, θ, and pre- and post-MOMP intervals were obtained by fixing one parameter and allowing the other to vary over the observed range, then mean-centring the resulting distributions (Supplementary Fig. 7). Fitted IC-RP trajectories were obtained after subtracting a trajectory for cycloheximide alone (Fig. 3c) to control for photobleaching (Supplementary Fig. 6).
Modelling
The responses of cell populations were simulated using a trained ODE model12 sampling from log-normally distributed protein concentrations with CV≈0.25 (see Supplemental Methods). In Figure 4, GFP-Bid (an experimental observable) was added to log-normally distributed endogenous Bid (unobservable); other proteins were sampled from lognormal distributions as before. Simulations were adjusted to match the distribution GFP-Bid achieved experimentally.
Supplementary Material
Supplementary Information is linked to the online version of the paper at ww.nature.com/nature.
Acknowledgements
We thank D. Flusberg, S. Govind, L. Kleiman, A. Letai, B. Millard, R. Milo, T. Norman, J. Paulsson, and R. Ward for their help. This work was supported by NIH grants GM68762 and CA112967.
References
- 1.Blake WJ, AErn M K, Cantor CR, et al. Nature. 2003;422(6932):633. doi: 10.1038/nature01546. [DOI] [PubMed] [Google Scholar]
- 2.Colman-Lerner A, Gordon A, Serra E, et al. Nature. 2005;437(7059):699. doi: 10.1038/nature03998. [DOI] [PubMed] [Google Scholar]
- 3.Elowitz MB, Levine AJ, Siggia ED, et al. Science (New York, N.Y. 2002;297(5584):1183. doi: 10.1126/science.1070919. [DOI] [PubMed] [Google Scholar]
- 4.Golding I, Paulsson J, Zawilski SM, et al. Cell. 2005;123(6):1025. doi: 10.1016/j.cell.2005.09.031. [DOI] [PubMed] [Google Scholar]
- 5.McAdams HH, Arkin A. Proceedings of the National Academy of Sciences of the United States of America. 1997;94(3):814. doi: 10.1073/pnas.94.3.814. [DOI] [PMC free article] [PubMed] [Google Scholar]
- 6.Ozbudak EM, Thattai M, Kurtser I, et al. Nat Genet. 2002;31(1):69. doi: 10.1038/ng869. [DOI] [PubMed] [Google Scholar]
- 7.Rosenfeld N, Young JW, Alon U, et al. Science (New York, N.Y. 2005;307(5717):1962. doi: 10.1126/science.1106914. [DOI] [PubMed] [Google Scholar]
- 8.Chang HH, Hemberg M, Barahona M, et al. Nature. 2008;453(7194):544. doi: 10.1038/nature06965. [DOI] [PMC free article] [PubMed] [Google Scholar]
- 9.Feinerman O, Veiga J, Dorfman JR, et al. Science (New York, N.Y. 2008;321(5892):1081. doi: 10.1126/science.1158013. [DOI] [PMC free article] [PubMed] [Google Scholar]
- 10.Sigal A, Milo R, Cohen A, et al. Nature. 2006;444(7119):643. doi: 10.1038/nature05316. [DOI] [PubMed] [Google Scholar]
- 11.Albeck JG, Burke JM, Aldridge BB, et al. Mol Cell. 2008;30(1):11. doi: 10.1016/j.molcel.2008.02.012. [DOI] [PMC free article] [PubMed] [Google Scholar]
- 12.Albeck JG, Burke JM, Spencer SL, et al. PLoS Biol. 2008;6(12):2831. doi: 10.1371/journal.pbio.0060299. [DOI] [PMC free article] [PubMed] [Google Scholar]
- 13.Geva-Zatorsky N, Rosenfeld N, Itzkovitz S, et al. Mol Syst Biol. 2006;2 doi: 10.1038/msb4100068. 2006 0033. [DOI] [PMC free article] [PubMed] [Google Scholar]
- 14.Goldstein JC, Kluck RM, Green DR. Ann N Y Acad Sci. 2000;926:132. doi: 10.1111/j.1749-6632.2000.tb05607.x. [DOI] [PubMed] [Google Scholar]
- 15.Lahav G, Rosenfeld N, Sigal A, et al. Nat Genet. 2004;36(2):147. doi: 10.1038/ng1293. [DOI] [PubMed] [Google Scholar]
- 16.Kaufmann BB, Yang Q, Mettetal JT, et al. PLoS Biol. 2007;5(9):e239. doi: 10.1371/journal.pbio.0050239. [DOI] [PMC free article] [PubMed] [Google Scholar]
- 17.Rando OJ, Verstrepen KJ. Cell. 2007;128(4):655. doi: 10.1016/j.cell.2007.01.023. [DOI] [PubMed] [Google Scholar]
- 18.Chaudhary PM, Eby M, Jasmin A, et al. Immunity. 1997;7(6):821. doi: 10.1016/s1074-7613(00)80400-8. [DOI] [PubMed] [Google Scholar]
- 19.Fuentes-Prior P, Salvesen GS. Biochem J. 2004;384(Pt 2):201. doi: 10.1042/BJ20041142. [DOI] [PMC free article] [PubMed] [Google Scholar]
- 20.Li H, Zhu H, Xu CJ, et al. Cell. 1998;94(4):491. doi: 10.1016/s0092-8674(00)81590-1. [DOI] [PubMed] [Google Scholar]
- 21.Luo X, Budihardjo I, Zou H, et al. Cell. 1998;94(4):481. doi: 10.1016/s0092-8674(00)81589-5. [DOI] [PubMed] [Google Scholar]
- 22.Youle RJ, Strasser A. Nat Rev Mol Cell Biol. 2008;9(1):47. doi: 10.1038/nrm2308. [DOI] [PubMed] [Google Scholar]
- 23.Wagner KW, Punnoose EA, Januario T, et al. Nature medicine. 2007;13(9):1070. doi: 10.1038/nm1627. [DOI] [PubMed] [Google Scholar]
- 24.Cohen AA, Geva-Zatorsky N, Eden E, et al. Science (New York, N.Y. 2008;322(5907):1511. doi: 10.1126/science.1160165. [DOI] [PubMed] [Google Scholar]
- 25.Barkai N, Leibler S. Nature. 1997;387(6636):913. doi: 10.1038/43199. [DOI] [PubMed] [Google Scholar]
- 26.Ashkenazi A, Herbst RS. J Clin Invest. 2008;118(6):1979. doi: 10.1172/JCI34359. [DOI] [PMC free article] [PubMed] [Google Scholar]
- 27.Berenbaum MC. Cancer Chemother Rep. 1972;56(5):563. [PubMed] [Google Scholar]
Associated Data
This section collects any data citations, data availability statements, or supplementary materials included in this article.
Supplementary Materials
Supplementary Information is linked to the online version of the paper at ww.nature.com/nature.


