Abstract
A spin-locked balanced steady-state free-precession (slSSFP) pulse sequence is described that combines a balanced gradient-echo acquisition with an off-resonance spin-lock pulse for fast MRI. The transient and steady-state magnetization trajectory was solved numerically using the Bloch equations and was shown to be similar to balanced steady-state free-precession (bSSFP) for a range of T2/T1 and flip angles, although the slSSFP steady-state could be maintained with considerably lower radio frequency (RF) power. In both simulations and brain scans performed at 7T, slSSFP was shown to exhibit similar contrast and signal-to-noise ratio (SNR) efficiency to bSSFP, but with significantly lower power.
Keywords: spin-locked, SSFP, slSSFP, trueFISP, T1rho
It is well known that in the presence of radio frequency (RF) irradiation, spin magnetization has different relaxation properties from T1 and T2 (1). In the rotating reference frame, the components of the magnetization parallel and perpendicular to the effective field have characteristic relaxation times T1ρ and T2ρ, respectively. Like T1, T1ρ varies, or disperses, with field strength because of energy exchange with the lattice. In MRI, T1ρ contrast is useful because only frequency components of the lattice that are equivalent to the amplitude of the RF field can cause relaxation in the rotating frame. These frequency components are typical of slow exchange, such as proton water exchange with hydroxyl and amide functional groups, slow rotation, static dipolar, or quadrupolar interactions.
There are a great number of T1ρ pulse sequences for imaging (2–6) that will not be detailed here; suffice it to say that all require both magnetization preparation to sensitize the signal to relaxation and long delay times to restore equilibrium. This paradigm is inherently time inefficient and, instead, it might be desirable to continuously acquire the T1ρ-weighted signal in the steady-state. Certainly, a few T1ρ sequences employ very short delay times, and, therefore, a steady-state is formed (2). This technique is rarely used in practice because of the significant signal loss incurred when equilibrium is not fully restored and, because of specific absorption rate (SAR) constraints, the minimum scan time is usually much greater than a magnetization prepared multiacquisition scheme that allows full recovery of longitudinal magnetization (7,8).
Steady-states in MRI are ubiquitous. Likely the most well-known steady-state contrast is the short TR, low flip angle, spoiled gradient-echo, which produces T1 contrast. Equally well-known is the short-TR balanced steady-state free-precession (bSSFP) sequence, which produces a T2/T1 contrast. Unfortunately, it is not clear how to establish a steady-state T1ρ contrast with significant signal because, on-resonance, the rotating frame thermal polarization is nearly zero with RF fields appropriate for clinical use. On the other hand, the steady-state of an off-resonance spin-lock can be significant, and the matter remains simply to deliver an off-resonance spin-locking RF pulse train interrupted briefly for a short period of data acquisition.
In this study, we aimed to develop a spin-locked steady-state free-precession (slSSFP) pulse sequence in phantoms and in vivo. An unexpected consequence of this work was the similarity of the contrast to bSSFP, such that we additionally compared the slSSFP signal to the well-known bSSFP signal as a function of flip angle and the relaxation times T1 and T2. The signal was found to be nearly identical at one-half the flip angle, demonstrating high signal-to-noise ratio (SNR) efficiency with significantly lower power than bSSFP.
METHODS
Pulse Sequence Design
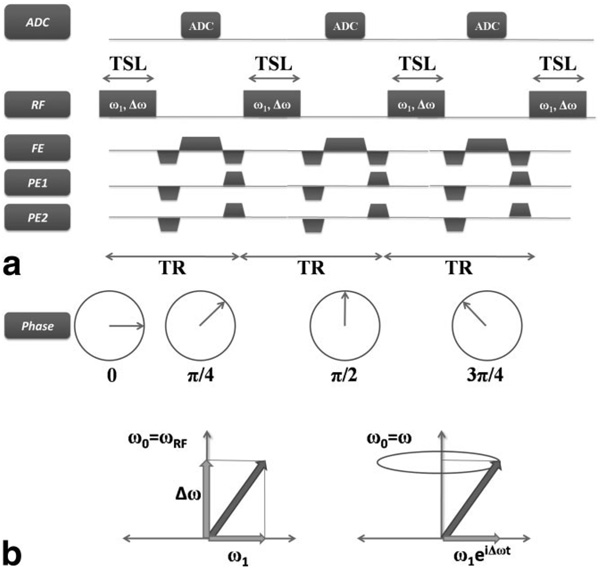
The slSSFP pulse sequence is shown in Fig. 1. The initial magnetization is partially flipped into the transverse plane by a preparatory RF pulse (not shown). Thereafter, a train of off-resonance spin-locking pulses is applied continuously to the magnetization. Figure 1a depicts three such kernels, where each kernel of duration TR comprises a spin-locking pulse of duration TSL, interleaved with a period for frequency and phase encoding. The off-resonance spin locking pulses are characterized by an amplitude ω1 and frequency ωRF, which may differ from the Larmor precession frequency ω by
| [1] |
FIG. 1.
The spin-locked balanced steady-state free-precession (slSSFP) imaging sequence. a: Three kernels of the slSSFP pulse sequence are shown diagrammatically. During each repetition of the kernel (duration = TR), a single, nonselective, off-resonance spin-locking pulse of amplitude ω1 and duration TSL is delivered parallel to the magnetization, followed by a short period for frequency and phase encoding. In this example, the phase of the transmitter and receiver are incremented by Φ = ΔωTSL = π/4 following each locking pulse. b: The magnetization trajectory in a reference frame rotating with the RF field (left) and with the Larmor frequency (right). In the frame rotating with the RF field, the magnetization is fixed along a single axis, but in the frame rotating at the Larmor frequency, the magnetization rotates with the RF field, tracing a cone of fixed angle with respect to the z-axis.
In a reference frame ω0, which rotates at the frequency of the RF field
| [2] |
the magnetization nutates about an effective field with amplitude
| [3] |
The effective field makes an angle with the z-axis such that tan
| [4] |
It will be clear in a moment why this angle is α/2, rather than α. Each off-resonance spin-locking pulse is terminated momentarily to apply frequency and phase-encoding imaging gradients, and for data acquisition, after which the spin-lock is resumed. In this way, the entire train of off-resonance spin-locking pulses is alternated with data acquisition periods until all repetitions of the kernel are complete.
If the flip angle of the initial preparatory pulse is chosen such that its flip angle α = θ and the spin-lock amplitude is sufficient
| [5] |
then the magnetization remains fixed along the effective field and does not rotate (Fig. 1b). During the interpulse interval, the magnetization precesses around the z-axis with frequency Δω, as usual, and the phase of the subsequent RF pulse is incremented by
| [6] |
where t is the duration of the period between two locking pulses. Alternatively, in a reference frame that rotates at the Larmor precession frequency
| [7] |
the magnetization rotates at a constant frequency Δω around the z-axis during RF irradiation, rather than during the free-precession period.
The key feature of this sequence is that the contrast is fundamentally different from an off-resonance T1ρ prepared experiment, since the magnetization is in a complicated steady-state, which depends on ω1, Δω, T1ρ, T1, and T2 and, unexpectedly, seems much closer in contrast to a half-alpha prepared, phase-alternated, bSSFP sequence.
Numerical Simulations
The transient and steady-state response of the magnetization to the slSSFP and bSSFP pulse sequences was simulated in Matlab (Version 7.5.0; Natick, MA, USA) using an ordinary differential equation solver based on an explicit Runge-Kutta formula, the Dormand-Prince pair (Matlab “ode45” function). The Bloch equations were formulated to include the effects of RF irradiation and relaxation in a frame of reference rotating at the Larmor precession frequency
| [8] |
The complex signal was the transverse components of the magnetization
| [9] |
In the simulation of the slSSFP pulse sequence, a single, 35°, preparatory RF pulse was delivered on-resonance to flip the magnetization along the effective field. Subsequently, a series of rectangular off-resonance spin-locking pulses were delivered each with amplitude
| [10] |
and frequency
| [11] |
such that the effective field
| [12] |
For all simulations, each spin-locking pulse (TSL = 1 ms) was interleaved with a period of free-precession (4 ms) and each subsequent RF pulse phase was shifted Δω TSL, so that the magnetization was always locked along the effective field. The total number of pulses was 600 and the simulated scan duration was 3 s. The relaxation times T1 (1000 ms) and T2 (45 ms) were chosen to correspond roughly to those of knee articular cartilage.
We chose to compare slSSFP to the well-known bSSFP signal response because bSSFP has very high SNR efficiency and, like slSSFP, has balanced gradients and fixes the magnetization along a well-defined axis in the steady-state. bSSFP was constructed by half-alpha preparation and 180° phase alternation of the RF pulse every TR (9). The bSSFP RF pulse flip angle α (70°) was chosen to be twice the amplitude of the slSSFP initial pulse flip angle, so the steady-state magnetization had the same alignment as slSSFP with respect to the transverse plane. The duration of the bSSFP RF pulse (1 ms) and period of free precession (4 ms) were equivalent to those of the slSSFP simulations.
MRI
Five phantoms were prepared in 15-ml conical tubes of distilled water and 0.01, 0.03, 0.05, 0.07, and 0.09 mM MnCl2 and spaced evenly in a single plastic container. The outer compartment contained doped tap water. T1 and T2 relaxation times were measured by conventional inversion-recovery–prepared fast spin-echo (TI = 50–3200 ms, TR = 10 s) and multicontrast spin-echo (TE = 25–250 ms, TR = 10 s) methods and were approximately T2/T1 = 921/2279, 448/1702, 289/142, 194/1154, and 154/1009 ms. Agarose gel phantoms were poured from 2%, 4%, 6%, and 8% (w/v) agarose in distilled water doped with 0.04 mM MnCl2 and temperature-induced polymerization.
For both brain (7T) and knee studies (1.5T), a single healthy female volunteer (22 years old) gave informed consent prior to MRI in a protocol approved by the Institutional Review Board of the University of Pennsylvania.
The pulse sequence was designed in the SequenceTree pulse programming environment (Laboratory of Structural NMR Imaging, University of Pennsylvania, Philadelphia, PA, USA) and compiled in IDEA (Siemens Medical Solutions USA, Inc., Malvern, PA, USA). Images were acquired on 1.5T or 7T MRI systems (Siemens) equipped with 40-mT/m gradients and either a circularly polarized extremity coil (1.5T; Siemens) or an 8-channel transmit and receive RF coil (7 T; Rapid Biomedical GmbH, Rimpar, Germany). When acquired concurrently, in all cases bSSFP and slSSFP scans were identical (with respect to bandwidth, pulse duration, field-of view [FOV], etc.) with the exception of phase and frequency modulation of the transmitter and receiver.
Phantom images were acquired at 1.5T using FOV = 150 mm2, TE/TR = 3.1 ms/6.2 ms, bandwidth = 500 Hz/pixel, matrix size = 128 × 128 × 40, TSL = 400 μs, and slice thickness = 5 mm. The flip angle or effective field angle was adjusted.
Human knee images were acquired at 1.5T using FOV = 150 mm2, TE/TR = 3.1/6.2 ms, bandwidth = 500 Hz/pixel, matrix size = 128 × 128 × 64 (to improve figure quality, the images shown are 256 × 256 × 64), TSL = 200 μs, slice thickness = 5 mm, and α = 20° or 40°. The RF pulse power was adjusted from 63 Hz (10 dB) to 893 Hz (33 dB) in 1-dB increments, where the power in dB was measured with respect to a 20-Hz pulse.
Coronal slSSFP human brain images were acquired at 7T at resolution = 0.469 mm2, FOV = 240 × 165 mm2, TE/ TR = 3.6 ms/7.2 ms, bandwidth = 510 Hz/pixel, matrix size = 512 × 392 × 256, slice thickness = 0.7 mm, TSL = 400 μs, and ω1/2π = 80 Hz.
Steady-State Frequency Response
The steady-state sequences were modified to measure the frequency response (αbSSFP = 20°, B0 = 1.5T, νeff = 5500 Hz). A small gradient in the phase encoding direction was pulsed briefly each TR (Gphase = 0.6 mT/m). The gradient had the effect of generating a spatially-dependent phase along the phase encoding direction such that
| [13] |
The experiments were performed in a homogeneous, spherical water phantom having relaxation times T1/T2 = 300 ms/100 ms.
Data Analysis
Circular regions-of-interest (ROIs) were drawn manually in phantoms and in the medial patellar cartilage compartment, plantaris muscle, and synovium of the knee joint from which the signal was measured; noise measurements were made from an ROI containing no tissue signal. The contrast-to-noise ratio (CNR) was measured by the difference in mean signal intensity from two such ROIs divided by the noise. Signal variation in slSSFP scans was measured by least-squares estimation of the percent change in signal with power (ΔS(%)/ΔdB). The reference amplitude from which the RF power (in dB) was measured was 20 Hz.
Brain images at 7T were resliced along axial and sagittal orientations and interpolated along the slice direction to match the in-plane resolution (0.469 mm), followed by correction for B1 heterogeneity, which was performed using a Gaussian low-pass filter algorithm and a custom-written program in Matlab. In brief, low-frequency component images (the filter) were obtained by windowing the spatial frequency domain with the two-dimensional Gaussian algorithm, and, subsequently, due to the low-frequency variation in the B1 field, images at full resolution were multiplied by the filter inverse to obtain an image without spatial heterogeneity.
RESULTS
Magnetization Trajectory
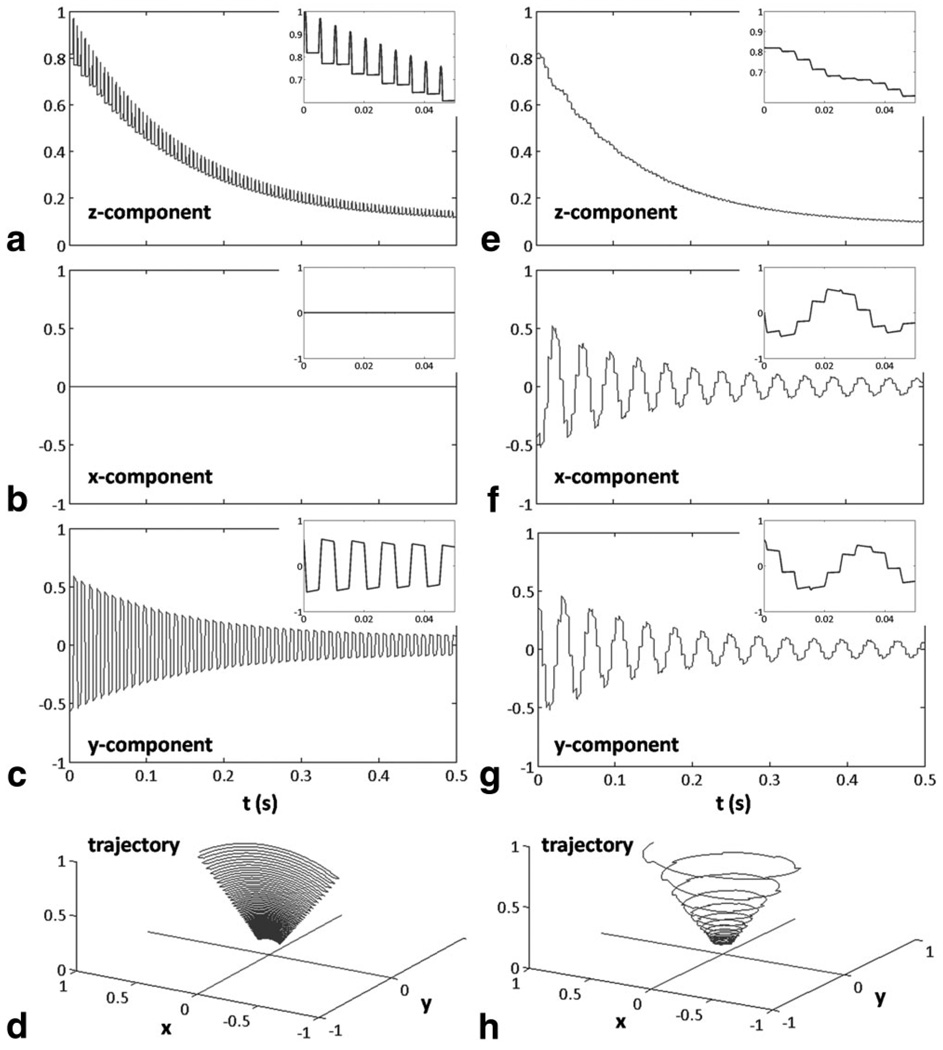
The magnetization trajectory during the first 100 RF pulses is shown in Fig. 2 and inset to each curve is the response to the first 10 RF pulses. As expected, for bSSFP, the longitudinal (Fig. 2a) and transverse (Fig. 2b) components of the magnetization approach a steady-state condition, which is dependent on T1, T2, TR, and α. During each RF pulse, the magnetization is flipped through the z-axis due to phase-alternation, so that briefly during the pulse the component of the magnetization in the transverse plane is zero. The trajectory of the magnetization vector can be shown to oscillate between ±α due to phase alternation (Fig. 2c), as described above. No component of the magnetization is parallel to the x-axis, which always holds true for RF delivered on-resonance.
FIG. 2.
Longitudinal (a,e) and transverse (b,c,f,g) components and magnetization trajectory (d,h) during slSSFP (right) and comparison to bSSFP (left). The simulation depicts a magnetization trajectory in a frame of reference rotating at the Larmor frequency and so the magnetization rotates in the transverse plane during spin-lock (f,g) as shown by oscillating x and y transverse components. The bSSFP flip angle α is twice the slSSFP angle of effective field orientation.
During slSSFP, the longitudinal magnetization decreases monotonically to the steady-state after the initial preparatory α pulse (Fig. 2d). Similarly, the transverse magnetization decays monotonically to the steady-state (Fig. 2e). In contrast to the magnetization trajectory in Figs. 2a and b, the trajectory is smooth, since the magnetization is never flipped. In fact, it can be shown that in the absence of relaxation, the magnetization has fixed longitudinal magnetization for all time. The trajectory of the magnetization is very different from bSSFP (Fig. 2f). Although the magnetization is initially aligned at an angle α in the y-z plane, the magnetization traces a cone of angle α during RF irradiation.
Dependence on Relaxation Times
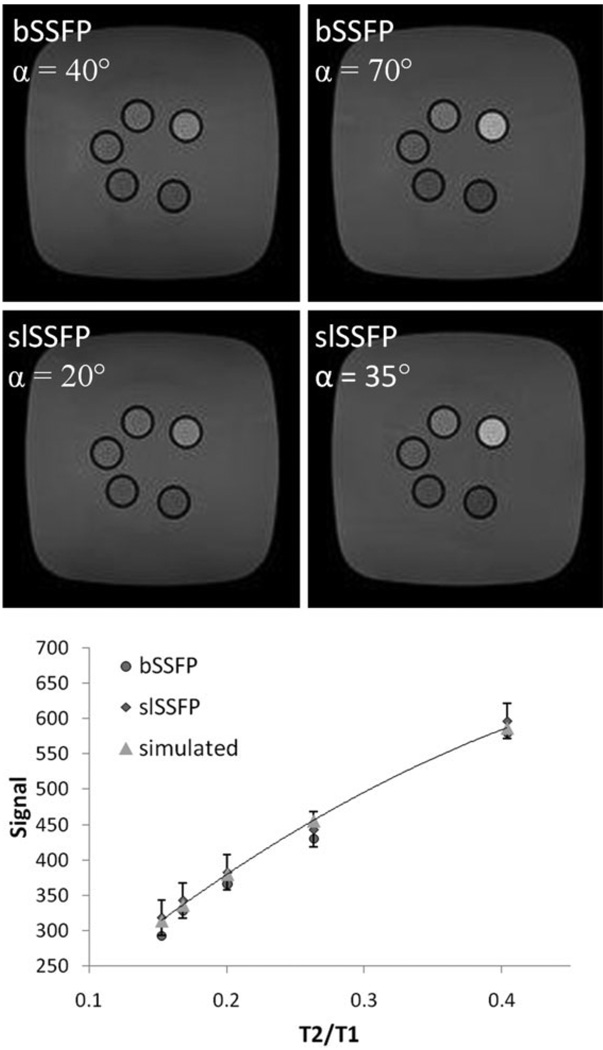
To determine the steady-state signal dependence on the relaxation times T1 and T2, the five MnCl2 phantoms (0.01–0.09 mM) were scanned at two angles αbSSFP = 40° and 70°. Separately, the T1 and T2 of the phantoms were each measured and the signal was plotted against the ratio T2/T1 for 70°. It was found that the signal was identical to within 8% of for a wide range of T2/T1 values (Fig. 3) and the signal at 40° was measured to have a similar dependence. The simulated curve was generated by a curve-fitting routine using a flip angle of 70° and the measured T1 and T2 using the steady-state equation for phase-alternated bSSFP (10).
FIG. 3.
Images depicting signal contrast in five MnCl2 phantoms for both bSSFP (top) and slSSFP(middle) scans at a flip angle of 40° (effective field angle 2α = 40°) and 70° (35°). A plot of the experimental and simulated signal dependence on the relaxation times T2/T1 during each scan is shown at the bottom.
Dependence on RF Pulse Power and Effective Field Angle
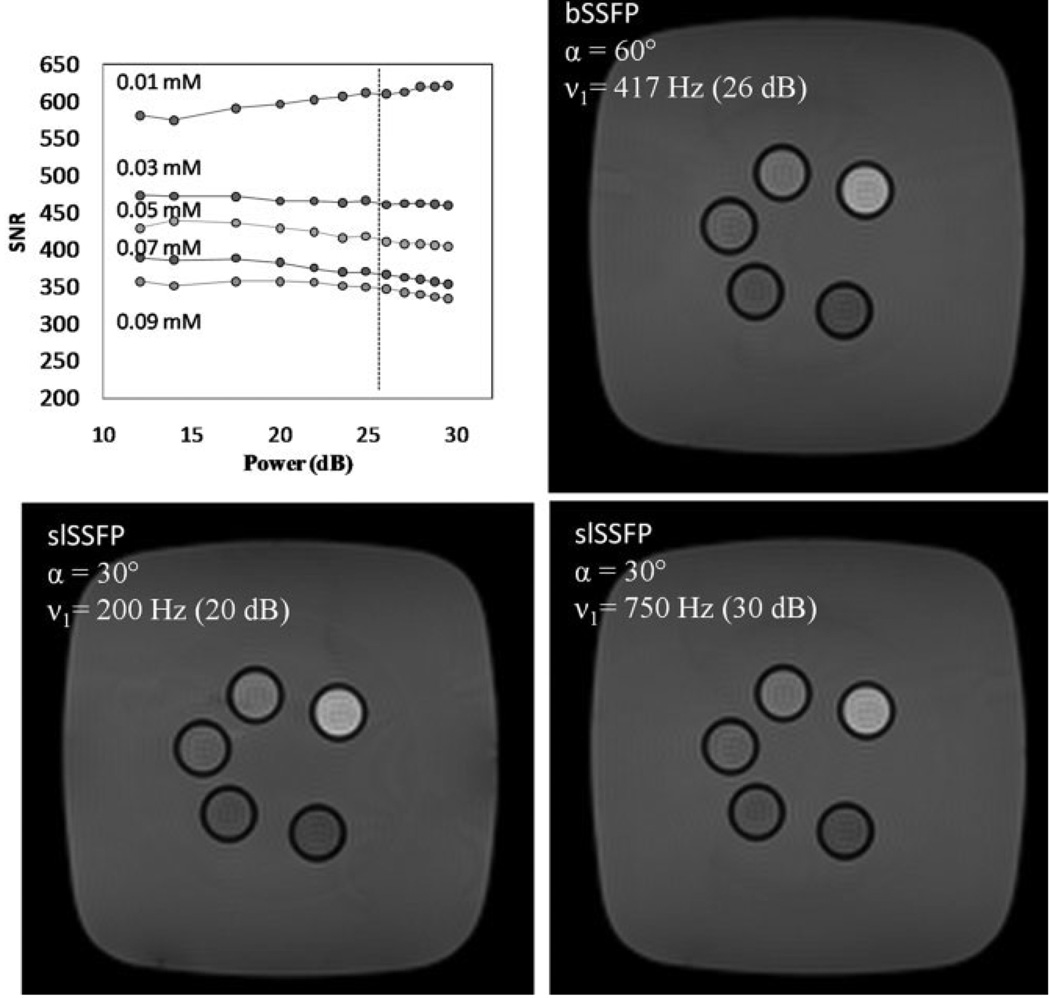
The Bloch equations predict that the steady-state signal should be independent of ω1 if Eq. [5] is satisfied and Δω is adjusted to maintain the orientation of the effective field. Several experiments were performed to validate the independence of the steady-state signal in response to RF pulse power adjustment. The SNR from each of the five MnCl2 samples was found to vary less than 1% per dB of RF pulse power over a wide range of pulse power from 10 to 30 dB (ν1 = 71–710 Hz) (Fig. 4). The percent change in signal for each of the phantoms was 0.47 (0.01 mM), 0.17 (0.03 mM), 0.47 (0.01 mM), 0.56 (0.07 mM), and 0.34 (0.09 mM) %/dB. For reference, the amplitude of an identical RF pulse used during bSSFP, which would achieve the same signal, is drawn as a vertical line, which illustrates that a spin-locked steady-state could be maintained with nearly 14 dB lower power and a 24-fold reduction in SAR under these conditions.
FIG. 4.
The slSSFP signal was independent from the delivered pulse power in five MnCl2-doped phantoms. The dashed vertical line depicts the bSSFP power that was required to maintain the steady-state with αbSSFP = 60°. As the two lower images demonstrate, it is possible to vary the slSSFP pulse power over a wide range without a significant change in SNR.
It was important to shim well, since RF pulse power <15 dB (112 Hz) suffered signal nonuniformity due to variations in the static field. It was observed that for low angles this restriction was less critical because, for the same ω1, an increased Δω was necessary to properly orient the effective field and, consequently, the increased ωeff could adequately overcome static field variations.
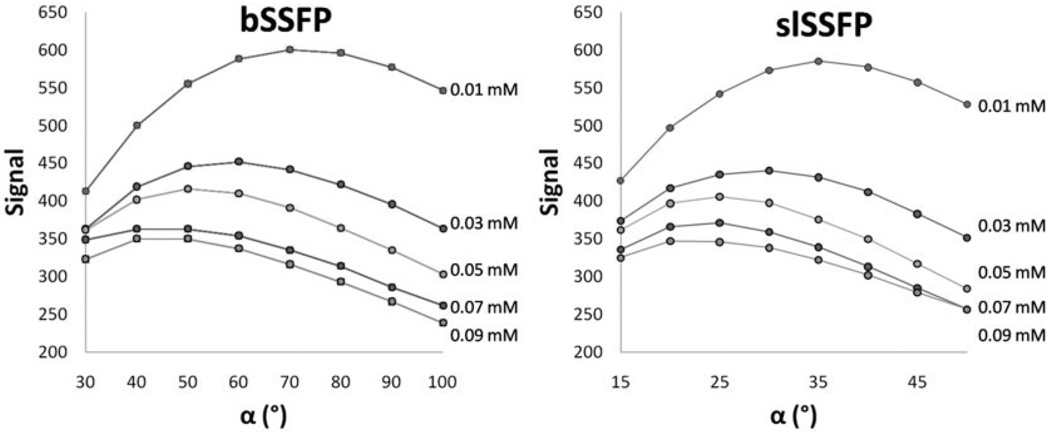
It was predicted that it should still be possible to modulate the slSSFP signal by rotating the direction of the effective field. In this way, it was possible to mimic the well-known bSSFP flip-angle signal-dependence. This was found experimentally in MnCl2 samples, which demonstrated an effective field orientation–dependent signal that was identical to the flip angle–dependent bSSFP signal (Fig. 5), but for one-half the angle. The phase-alternated bSSFP flip angle was maximized in the limit TR T2 < T1:
| [14] |
which for each sample was calculated to be 64.9°, 54.3°, 48.2°, 44.6°, and 42.7°, respectively. This was in agreement with both the observed bSSFP maximum and the slSSFP maximum, but with an effective field oriented at one-half the angle.
FIG. 5.
Experimentally determined slSSFP signal dependence (right) is nearly identical to bSSFP (left) in five MnCl2-doped phantoms and could be adjusted by modulation of the effective field orientation and preparatory flip angle.
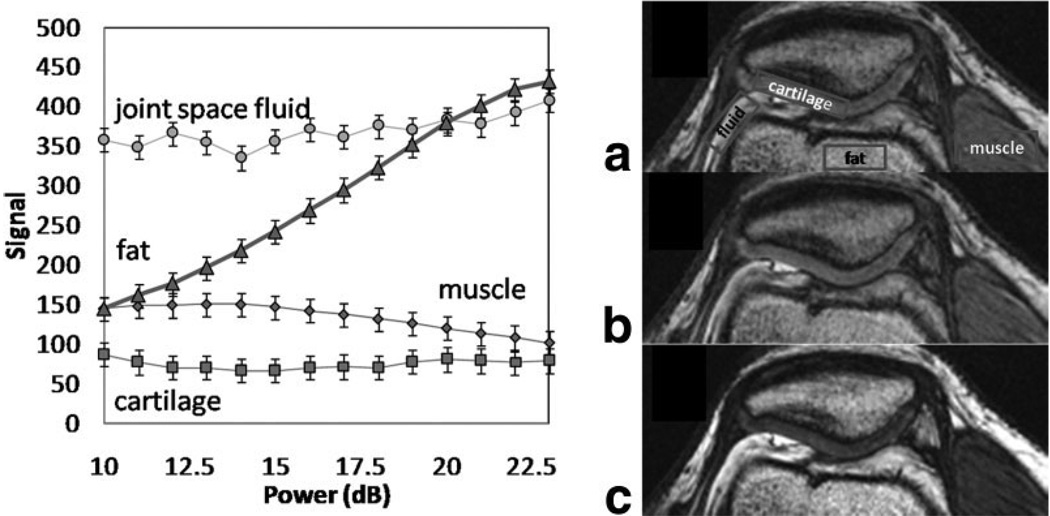
To further test the signal independence, in vivo knee imaging was performed and the signal from joint space fluid (JSF), muscle (M), and cartilage (C) was also determined to be relatively independent of pulse power (Fig. 6), although the effects of low-frequency relaxation dispersion were not analyzed. Representative axial knee images are shown in Fig. 6 and demonstrate a 11.5-dB reduction in power, with only very small change in signal and contrast from Fig. 6a (12 dB, 80 Hz) to Fig. 6b (23.5 dB, 300 Hz). Tissues for which the slSSFP pulse and receiver phase was not properly matched, such as fat, could demonstrate exhibit contrast variation with ω1. The CNR was measured for joint space fluid, muscle, and cartilage as 20 (JSF/M), 25 (JSF/C), and 5 (M/C) (Fig. 6a and b) and 55, 50, and 5 (Fig. 6c).
FIG. 6.
The slSSFP signal is relatively independent of pulse power in knee joint space fluid, muscle, and cartilage as shown by the graph on the left. To further illustrate, two slSSFP axial knee images shown were acquired with (a) 12 dB (80 Hz), α = 20°, and (b) 23.5 dB (300 Hz), α = 20°, demonstrating how RF pulse power can be lowered in such as a way to reduce SAR, but without changing contrast. On the other hand, it is possible to change contrast by rotating the orientation of the effective field (c) 23.5 dB (300 Hz), α = 40°.
slSSFP at Ultrahigh Field
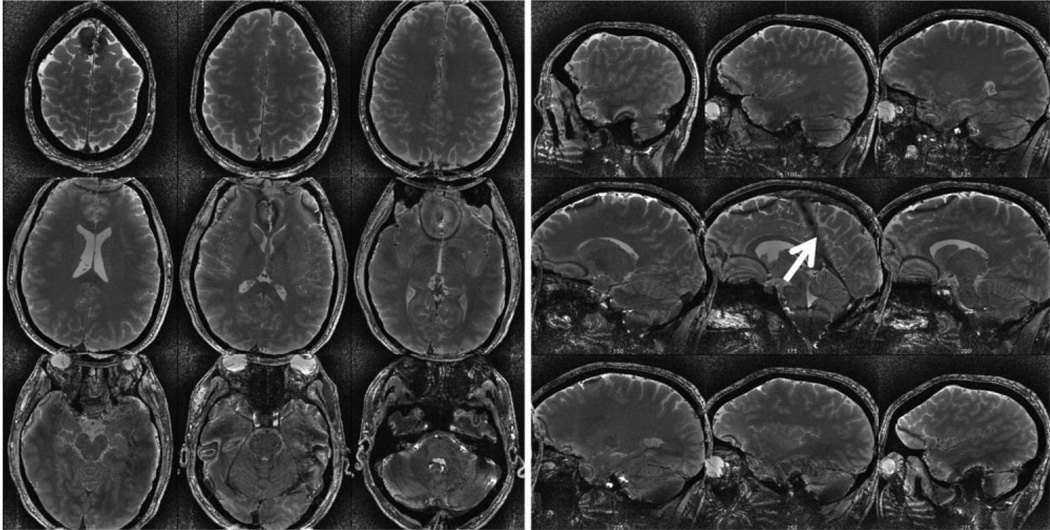
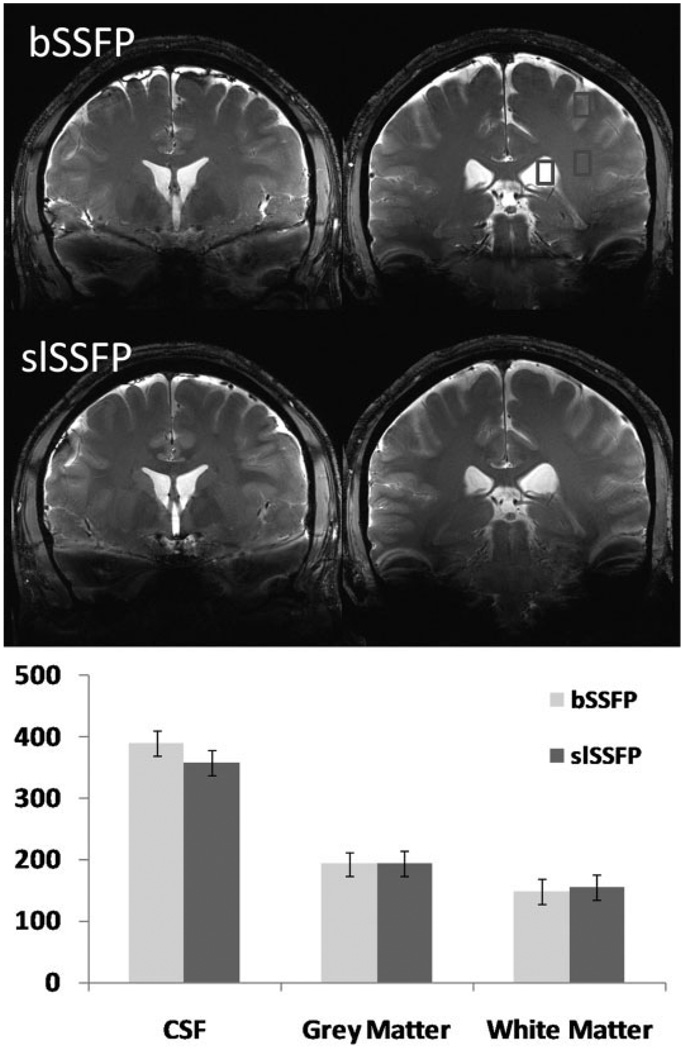
To measure the potential CNR among brain tissues at ultrahigh field using slSSFP, brain scans were performed at 7T with full- volume coverage as shown in Fig. 7. T2-weighted contrast was maximized empirically (αbSSFP = 15°) and gray matter (GM), white matter (WM), and cerebrospinal fluid (CSF) CNR was measured to be 9.4 (GM/WM), 24.6 (GM/CSF) and 34.0 (WM/CSF). A similar bSSFP scan could not be performed with these scanning parameters because of SAR limitations. The reduction in power achieved with slSSFP that enabled scanning was 2.3 dB. This pulse-power reduction corresponded to a pulse-amplitude reduction from ω1/2π = 104 Hz (bSSFP) to 80 Hz (slSSFP). Although the pulse power was relatively low for slSSFP, it should be reiterated that for low effective field orientations, the effective field amplitude ωeff = 612 Hz could adequately overcome variations in the static field to reduce artifacts. Figure 8 demonstrates the result of two scans with increased pulse duration (800 μs) to accommodate the bSSFP flip angle and illustrates the similarity in CNR and SNR efficiency.
FIG. 7.
Full brain coverage (0.47 mm2 × 0.7 mm) with T2-weighting was achieved using fast slSSFP imaging at ultrahigh field (7T) for which a similar bSSFP scan was not possible because the delivered SAR exceeded mandated limits. The white arrow depicts steady-state artifacts due to static field variation and the halo surrounding the brain is an artifact of postprocessing B1 heterogeneity correction.
FIG. 8.
Comparison of 7T bSSFP (top) and slSSFP (middle) scans with identical sequence parameters, but with a pulse duration twice that which was used in Fig. 7 to enable scanning within SAR limitations. The chart on the bottom shows the SNR characteristics of both pulse sequences in the CSF, gray matter, and white matter in three ROIs drawn as depicted in the upper right image.
Steady-State Frequency Response
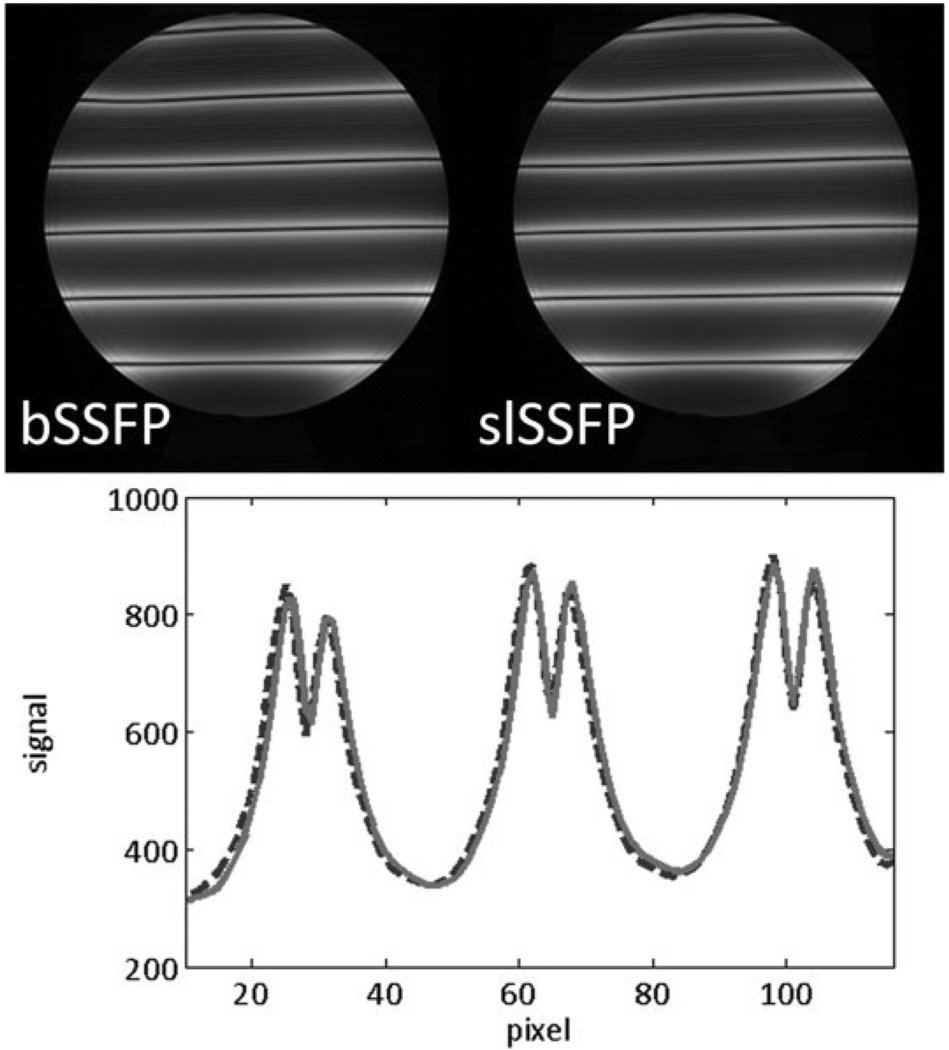
One of the key features of the bSSFP sequence is the frequency response profile and its characteristic signal voids that repeat whenever the phase accumulation during a single TR is radians. By briefly applying a gradient pulse along the phase-encoding direction for each TR, one can produce a spatially-dependent frequency-response profile along the gradient axis. In this way, the band separation is related to the gradient moment rather than the frequency shift from resonance. Figure 9 depicts a single slice from two consecutive acquisitions of bSSFP and slSSFP in which both the band separation and signal amplitude is similar. At low ω1 there was ω1-dependence, which may explain the change in the fat steady-state signal observed in the knee. The shift in the spectral response was small and did not significantly affect tissues that were properly locked along the effective field.
FIG. 9.
The spatially-dependent frequency response of bSSFP (upper left image, dotted curve in graph) and slSSFP (upper right image, solid curve in graph) is shown. These images were obtained by briefly applying a gradient pulse each TR to generate a small, but nonzero, gradient moment.
DISCUSSION
We demonstrated that slSSFP scanning can be performed over a range of RF pulse power without modifying the steady-state signal. At high (3T) and ultrahigh (7T+) fields this is important since the RF pulse amplitude can be adjusted to satisfy SAR constraints, presumably without affecting image contrast. This result seems counterintuitive since most spin-locking applications are SAR-intensive, requiring both high-power and long-duration irradiation; however, here it was shown experimentally that for liquid samples under extreme motional narrowing, the RF power can be reduced without changing the contrast.
The numerical treatment of slSSFP presented here is valid for a single-spin population in motionally-narrowed systems, but the magnetization response is certainly much more complex in vivo. In future work, we will focus first on rotating frame relaxation and magnetization transfer effects. As Redfield (1,11) showed in his pioneering work, the numerical treatment of the Bloch equations used above violates the second law of thermodynamics. Instead, a proper description includes the effects of energy exchange with the lattice in the rotating frame of reference. Still, the use of the Bloch equations to compare bSSFP and slSSFP is justified since we are not currently aware of any rotating frame relaxation analysis of bSSFP in imaging, although effects such as rotating frame relaxation on image contrast are likely present.
The effects of off-resonance spin-locking RF irradiation on image contrast have been previously examined by several authors (12–14). All authors seem to agree that with fixed RF amplitude ω1, there is a tradeoff between T1 and T1ρ contrast which depends on Δω. We suspect that a similar tradeoff exists for steady-state off-resonance T1ρ contrast, but that remains to be explored.
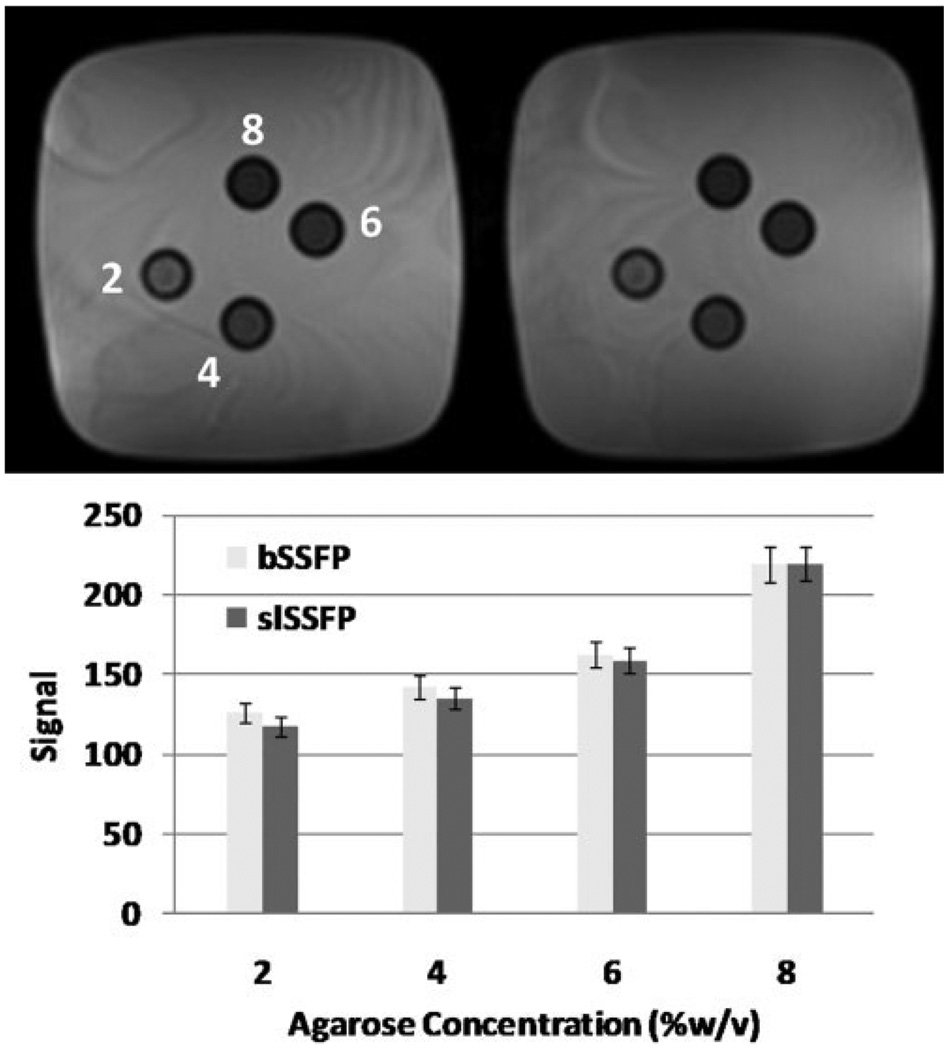
The delivery of RF irradiation generates a magnetization transfer effect that may alter the steady-state signal from that which is described in the foregoing theory. Previous investigations of SSFP sequences have shown that there is an intrinsic magnetization transfer effect that affects the signal contrast (15,16). It seems that the difference in contrast as a result of off-resonance irradiation in slSSFP is not very much different from bSSFP in a clinical situation, as Fig. 6, Fig. 7, and Fig. 8 illustrate, and similar observations were found for agarose phantoms of varying concentrations (Fig. 10). For all practical purposes, the dominant contrast mechanisms are the relaxation times and the orientation of the effective field. This may be because the primary magnetization transfer contrast in the tissues observed is that between a free-water pool and a bound-water pool whose broad line extends across the frequencies irradiated in this study. A thorough study of magnetization transfer will require an analysis of the signal on the separate, complex dependencies of the frequency of RF irradiation, the exchange rate, the number of spin pools undergoing exchange, the size of the spin pools, and several other considerations. In addition, untying the magnetization transfer effect from a possible T1ρ dispersion effect remains since both depend on ω1.
FIG. 10.
SSFP scans of 2%, 4%, 6%, and 8% (w/v) agarose gels (α = 20°) at 1.5T. The signal intensity for bSSFP and slSSFP is equivalent within error.
Phase-alternated bSSFP and slSSFP have many features in common and, at the same time, have many important differences. In the implementation here, both bSSFP and slSSFP consist of a series of rectangular pulses interleaved with a short acquisition period and balanced imaging gradients. The duration of the rectangular pulses for both bSSFP and slSSFP was identical. Both sequences used 3D phase-encoding with identical k-space trajectories. Both sequences were prepared with an α/2 pulse. The primary difference between the two sequences was that for bSSFP the RF pulse was delivered on-resonance and with a phase perpendicular to the magnetization, while for slSSFP the RF field was delivered off-resonance and with a phase parallel to the magnetization. Despite these differences, and despite neglecting an off-resonance rotating frame analysis, the magnetization response is nearly identical.
slSSFP is limited to nonselective excitation and this may reduce the utility of the technique for MR applications that require slice selection. To apply a gradient simultaneously with the off-resonance spin-locking pulse would dephase spin isochromats and thus would be no longer locked parallel to the effective field. These challenges are similar to those encountered when designing slice-selective adiabatic pulses (17). For some applications, it is possible to overcome these limitations by using local transmit or receive coils or simply encoding the entire field of view. The latter may not be too constraining because of the very high acquisition rate of SSFP sequences together with very short RF pulse durations and partial or parallel acquisition techniques to reduce the number of gradient encodings.
The sensitivity of slSSFP to field heterogeneity (B0 and B1) is different from bSSFP and we will consider both types of heterogeneity rigorously in future work. If the RF field is not homogeneous then the magnetization is not uniformly flipped along the effective field. Subsequently, during the spin-locking pulse, the magnetization nutates around the effective field and the transient decay to the steady-state is different. Previous efforts to reduce spin-lock nutations have been successful using rotary echo or adiabatic techniques and we believe that these techniques will be similarly useful here (18,19). On the other hand, any free-precession that occurs due to static field heterogeneity will cause the magnetization to enter a different steady-state as well. Like bSSFP, we expect there will be a spectral response that depends on the accumulated phase per TR; however, if the amplitude of the spin-locking pulse is sufficient (ω1 > Δω0), then it may be possible to achieve very long TRs (by increasing the duration of the RF pulse and not the free-precession period) with artifacts comparable to a much shorter TR bSSFP. Also, integrated spin-echo and spin-lock experiments could eliminate artifacts completely (20), but with a SAR penalty. It is unclear whether rotating frame relaxation or field heterogeneity accounts for differences in contrast between bSSFP and slSSFP in Fig. 6 and Fig. 7, although certainly the effects of field heterogeneity are clearly visible. The frequency response shifted with ω1 for the same effective field orientation and this might explain the change in the fat steady-state. We suspect that the frequency-dependent response is related to the effective field orientation, spin-lock amplitude, Δω, and the relaxation times. The change in the steady-state signal was apparently small for tissues that were properly locked.
In conclusion, slSSFP is a promising new steady-state sequence with high SNR efficiency and can be used with considerably lower power than a bSSFP with similar contrast. In addition, many sequence features remain to be explored, including the effects of rotating frame relaxation, magnetization transfer effects, and frequency response.
ACKNOWLEDGMENTS
We greatly appreciate the support of Mr. Matthew Fenty and Mr. Michael Wang.
REFERENCES
- 1.Redfield AG. Nuclear spin thermodynamics in the rotating frame. Science. 1969;164:1015. doi: 10.1126/science.164.3883.1015. [DOI] [PubMed] [Google Scholar]
- 2.Borthakur A, Wheaton A, Charagundla SR, Shapiro EM, Regatte RR, Akella SVS, Kneeland JB, Reddy R. Three-dimensional T1 rho-weighted MRI at 1.5 Tesla. J Magn Reson Imaging. 2003;17:730–736. doi: 10.1002/jmri.10296. [DOI] [PubMed] [Google Scholar]
- 3.Borthakur A, Hulvershorn J, Gualtieri E, Wheaton AJ, Charagundla S, Elliott MA, Reddy R. A pulse sequence for rapid in vivo spin-locked MRI. J Magn Reson Imaging. 2006;23:591–596. doi: 10.1002/jmri.20537. [DOI] [PMC free article] [PubMed] [Google Scholar]
- 4.Wheaton AJ, Borthakur A, Kneeland JB, Regatte RR, Akella SVS, Reddy R. In vivo quantification of T1rho using a multislice spin-lock pulse sequence. Magn Reson Med. 2004;52:1453–1458. doi: 10.1002/mrm.20268. [DOI] [PubMed] [Google Scholar]
- 5.Li XJ, Han ET, Ma CB, Link TM, Newitt DC, Majumdar S. In vivo 3T spiral imaging based multi-slice T1ρ mapping of knee cartilage in osteoarthritis. Magn Reson Med. 2005;54:929–936. doi: 10.1002/mrm.20609. [DOI] [PubMed] [Google Scholar]
- 6.Grohn HI, Michaeli S, Garwood M, Kauppinen RA, Grohn OHJ. Quantitative T1ρ and adiabatic Carr-Purcell T2 magnetic resonance imaging of human occipital lobe at 4 T. Magn Reson Med. 2005;54:14–19. doi: 10.1002/mrm.20536. [DOI] [PubMed] [Google Scholar]
- 7.Witschey WRT, Borthakur A, Elliott MA, Fenty M, Sochor MA, Wang C, Reddy R. T1 rho-prepared balanced gradient echo for rapid 3D T1rho MRI. J Magn Reson Imaging. 2008;28:744–754. doi: 10.1002/jmri.21444. [DOI] [PMC free article] [PubMed] [Google Scholar]
- 8.Li XJ, Han ET, Busse RF, Majumdar S. In vivo T1rho mapping in cartilage using 3D magnetization-prepared angle-modulated partitioned k-space spoiled gradient echo snapshots (3D MAPSS) Magn Reson Med. 2008;59:298–307. doi: 10.1002/mrm.21414. [DOI] [PMC free article] [PubMed] [Google Scholar]
- 9.Scheffler K, Lehnhardt S. Principles and applications of balanced SSFP techniques. Eur Radiol. 2003;13:2409–2418. doi: 10.1007/s00330-003-1957-x. [DOI] [PubMed] [Google Scholar]
- 10.Scheffler K, Hennig J. T1 quantification with inversion recovery True-FISP. Magn Reson Med. 2001;45:720–723. doi: 10.1002/mrm.1097. [DOI] [PubMed] [Google Scholar]
- 11.Redfield AG. Nuclear magnetic resonance saturation and rotary saturation in solids. Phys Rev. 1955;98:1787–1809. [Google Scholar]
- 12.Moran PR, Hamilton CA. Near-resonance spin-lock contrast. Magn Reson Imag. 1995;13:837–846. doi: 10.1016/0730-725x(95)00029-g. [DOI] [PubMed] [Google Scholar]
- 13.Ulmer JL, Mathews VP, Hamilton CA, Elster AD, Moran PR. Magnetization transfer or spin-lock? An investigation of off-resonance saturation pulse imaging with varying frequency offsets. AJNR Am J Neuroradiol. 1996;17:805–819. [PMC free article] [PubMed] [Google Scholar]
- 14.Grohn OHJ, Makela HI, Lukkarinen JA, DelaBarre L, Lin J, Garwood M, Kauppinen RA. On- and off-resonance T1 rho MRI in acute cerebral ischemia of the rat. Magn Reson Med. 2003;49:172–176. doi: 10.1002/mrm.10356. [DOI] [PubMed] [Google Scholar]
- 15.Bieri O, Scheffler K. Optimized balanced steady-state free precession magnetization transfer imaging. Magn Reson Med. 2007;58:511–518. doi: 10.1002/mrm.21326. [DOI] [PubMed] [Google Scholar]
- 16.Bieri O, Scheffler K. On the origin of apparent low tissue signals in balanced SSFD. Magn Reson Med. 2006;56:1067–1074. doi: 10.1002/mrm.21056. [DOI] [PubMed] [Google Scholar]
- 17.Johnson AJ, Garwood M, Ugurbil K. Slice selection with gradient-modulated adiabatic excitation despite the presence of large B1-inhomogeneities. J Magn Reson. 1989;81:653–660. [Google Scholar]
- 18.Solomon I. Rotary spin echoes. Phys Rev Lett. 1959;2:301–302. [Google Scholar]
- 19.Witschey WRT, Borthakur A, Elliott MA, Mellon E, Niyogi S, Wang CY, Reddy R. Compensation for spin-lock artifacts using an off-resonance rotary echo in T1rho (off)-weighted imaging. Magn Reson Med. 2007;57:2–7. doi: 10.1002/mrm.21134. [DOI] [PMC free article] [PubMed] [Google Scholar]
- 20.Witschey WRT, Borthakur A, Elliott MA, Mellon E, Niyogi S, Wallman DJ, Wang CY, Reddy R. Artifacts in T1ρ-weighted imaging: Compensation for B1 and B0 field imperfections. J Magn Reson. 2007;186:75–85. doi: 10.1016/j.jmr.2007.01.015. [DOI] [PMC free article] [PubMed] [Google Scholar]


