Abstract
17-Allylamino, 17-Demethoxygeldanamycin (17-AAG), an effective inhibitor of the heat shock protein hsp90, preferentially inhibiting tumor hsp90 compared to hsp90 from normal cells (1), has shown promising results against several cancers, including hormone resistant prostate cancer. Levels of several oncogenic proteins critical to tumor growth and progression, such as AR (androgen receptor) and HER2/neu, were reduced 4 hours post 17-AAG treatment. Post treatment metabolic changes have also been observed in several tumor cell lines. In this study total choline (t-cho) distributions in hormone sensitive CWR22 and hormone resistant CWR22r prostate cancer xenograft tumors in mice were measured before, 4 hours and 48 hours after a single bolus 17-AAG treatment at 100 mg/kg using proton MRS. Our results show that tumor t-cho levels declined 4 hours after the treatment for CWR22 (P = 0.001) and 48 hours post treatment for CWR22r (P=0.003). Metabolic changes, in particular of t-cho intensity detected by 1H MRSI, are consistent with the observed immunohistochemistry changes, tumor growth inhibition for CWR22r (P=0.01 at 14 days post treatment) and a constant PSA level versus increasing PSA for control CWR22 (P=0.01). Metabolic changes in t-cho by proton MRSI can be used as an early biomarker of response for advanced stage prostate cancer in targeted therapy such as 17-AAG.
Introduction
Prostate cancer is the most common non-cutaneous malignancy and the second most frequent oncologic cause of death in older men in the United States. Over 65% of all prostate cancer cases are diagnosed in men over age 65. Prostate cancer screening has led to increased detection of localized disease which is more amenable to curative treatment than advanced cancers (2), however the treatment of metastatic prostate cancer remains a significant clinical problem.
Hormone therapy and chemotherapy are the main therapeutic options for metastatic prostate cancer. Prostate cancer cells have androgen receptors (AR) on the cell surface and tumor growth is usually initially androgen driven. When androgen binds to AR, a series of signaling cascades are initiated to promote tumor growth. In the absence of androgen stimulation, prostate cancer cells will initially enter into growth arrest and subsequently undergo apoptosis. Prostate cancer usually responds initially to hormonal therapy which has been used either as neoadjuvant or palliative treatment to improve patient survival (3). However despite the initial positive response, the tumor almost invariably evolves and becomes hormone resistant, resulting ultimately in disease progression and often significant morbidity and possibly mortality. In patients who relapse post hormonal therapy, tumor growth is accompanied by increases in AR level which are normal or above normal compared to pre-treatment tumor levels, despite the absence of stimulation from androgen hormone (4, 5). Activation and over-expression of other pro-tumor and anti-apoptotic growth factors, such as tyrosine kinase HER-2, AKT, FKBP5, has also been related to the emergence and growth of resistant prostate cancer (6).
More recently, hormone refractory prostate cancer has frequently been treated with chemotherapy (7). The focus of chemotherapy development has shifted towards targeted therapy and inhibition of signaling pathways and this has proved successful in several disease systems (8–10). Inhibition of signaling pathways has had more moderate success in treating more common cancers and this may be due to the fact that inhibition of a single pathway can be circumvented by activating other pathways or by downstream activation. Thus an alternate approach would either be to try to circumvent multiple pathways by combining several agents, or to develop an agent that has activity against multiple targets.
Recently a new targeted drug, 17-AAG, has shown promise in treating prostate cancer, including the hormone resistant form, along with other advanced cancers of breast, colon and brain, and is undergoing clinical trials (11, 12). 17-AAG is one of a new class of agents which inhibit the heat shock protein, hsp-90. The hsp family proteins were first discovered to be overexpressed in fruit flies in high temperature environment (13). They were later found to be also involved during other cellular stress periods which include hypoxia, radiation, and cytotoxic environment etc. The main functions of hsp proteins are to form complexes with their client proteins, which are often overexpressed, to promote cell survival during stress. The complex increases their stability and protects them from cellular degradation by the proteasome. The hsp-90 chaperone protein complex has several important client signaling proteins, including AR, Akt, and HER-2/neu, which are important to tumor growth. The inhibition of hsp-90 causes its client proteins to be degraded and thereby inhibits tumor growth. By simultaneously blocking several important survival and pro-growth factors, targeting hsp-90 can reduce various cell survival signaling pathway’s compensatory effects to suppress tumor growth. In pre-clinical studies, 17-AAG has demonstrated its efficacy as an anti-neoplastic agent as a single drug, in combination with other chemotherapy agents, and as a sensitizer in combination with radiation (14, 15). A multi-center phase II clinical trial for hormone-refractory metastatic prostate cancer is being conducted to evaluate PSA response to 17-AAG treatment (16).
CWR22 is a recently developed human primary prostate cancer model (17, 18). Its many characteristics closely resemble those of clinical prostate cancers, making it an attractive model for pre-clinical studies. CWR22 tumors grown in nude mice induce elevated PSA, and tumor growth is highly androgen sensitive (18). When tumors undergo androgen deprivation, they regress, accompanied by a concomitant drop in serum PSA level. The model is also similar to clinical prostate cancer in that, after months of successful hormonal therapy the tumor can recur in a hormone refractory state, which has been used to develop new variants of hormone resistant CWR22 tumor. Several hormone independent CWR22 tumor lines have been established through this process to investigate the resistant disease (19, 20).
Molecular targeted therapies such as 17-AAG have emerged to be a new paradigm for cancer research and treatment in the past decade (21–23). The metabolic effects of 17-AAG in prostate cancer have not been investigated but have been studied by nuclear magnetic resonance (NMR) in colon tumors by Chung et. al (24). They showed that treatment with 17-AAG for 4 days at 80 mg/kg resulted in an increase in phosphocholine, as measured from cell extract and xenograft tumor extract. In a ras-transfected NIH 3T3 fibroblast cell line, Ronen et. al using 31P NMR, observed that 17-AAG caused a significant decrease in phosphocholine along with cell death (25). Since 1H MRSI is becoming a common tool in prostate cancer clinical care (26–28) and has multiple advantages for clinical studies compared to 31P (greater sensitivity leading to shorter studies with smaller voxels, widespread availability of appropriate hardware), it was hypothesized that it would be clinically valuable to determine if 1H MRSI could provide a clinically important early metabolic biomarker that could be non-invasively measured to guide treatment development and monitor response. Magnetic resonance or more specifically magnetic resonance spectroscopy (MRS) is a unique tool that allows for non-invasive detection of cellular metabolite levels. Several metabolites including creatine, total choline (t-cho), citrate and fat content can usually be detected in in vivo proton MRS. T-cho representing free, mobile small compounds containing trimethylamine group (-N(CH3)3) has been found elevated in many instances in cell malignancy transformation and in various malignancies to correlate with tumor growth and tumor cell proliferation both in vivo and in vitro (29–31). In this study using proton MRS, we measured the metabolic response of both the hormone sensitive and resistant human prostate cancers (CWR22 and CWR22r) in mouse xenografts following 17-AAG treatment.
Methods
Cell lines and Animals
Human prostate CWR22 cells were maintained in nude mice and were originally a gift from Dr. Pretlow (17). The hormone resistant cell line CWR22r was obtained from ATCC (American Type Cell Culture, Manassas, VA). Athymic nude male mice were used for all studies. Tumors were implanted in the mouse flank using minced CWR22 or CWR22r tumor tissue one day after testosterone pellets had been implanted. One bolus dose of 17-AAG dissolved in DMSO at 100 mg/kg was injected i.p. when tumor sizes were about 120 mm3. Tumor growth was monitored for both treated and untreated control groups with cohort sizes between 6 and 9 mice. Tumor volume was calculated by using the ellipsoid model from the measured three dimensions of the tumor: π/6 × d1 × d2 × d3, where d1−d3 are the tumor sizes along three orthogonal directions including the long axis of the tumor. For PSA measurements, blood was withdrawn from the mouse tail vein at 5-day intervals, and a PSA enzyme immunoassay test kit was used (American Laboratory Products Co., Windham, NH). Optical density (OD) was measured at the wavelength of 450 nm using a BIORAD model 680 multi-well plate reader (Bio-Rad Laboratories, Hercules, CA). The standard absorption curve was measured with the standard solution using the plate reader and PSA values were read off the measured standard curve based on the measured sample OD. 7 mice were used for PSA measurement for treated and control groups for each tumor models. The animal protocol was approved by MSKCC Institutional Animal Care and Use Committee and followed the guideline for appropriate and humane animal use.
In vivo MR Spectroscopy of tumor xenograft
in vivo MR spectroscopy was conducted when the tumor sizes were approximately 300 mm3 at pre-, 4 hours and 48 hours post 17-AAG treatment with a cohort size of 7. All MR studies were performed on a Bruker Biospec 4.7T scanner (Bruker Biospin MRI GmbH, Ettlingen, Germany). A home-made 10 mm diameter 2-turn solenoid RF coil was used for all in vivo MR measurements. A water bath, maintained at a temperature of 37° C, was used to improve B0 field homogeneity and to maintain the mouse body temperature. The mouse flank tumor was immersed in the water bath and positioned inside the solenoid coil. The animals were anesthetized with 1.5% isoflurane (Hospira Inc., Lake Forest, IL). CHESS water suppression (32) was used for water suppressed slice selective proton CSI measurements with the following acquisition parameters: FOV 32 mm × 32 mm, 16 phase encoding steps in both spatial dimensions, TR 1s, TE 75 ms, NEX 8, SW 2000, 1024 acquisition points, slice thickness 4 mm with the slice plane perpendicular to the solenoid coil axis, a scanning time of 34 minutes. The CSI voxel size was 2 × 2 × 4 mm3. T2-weighted anatomical reference images along the same slice orientation were acquired using the fast spin-echo RARE (Rapid Acquisition with Relaxation Enhancement) method with the same FOV, 1 mm slice thickness, 4 slices, TR 2s, TE 45 ms and 8 phase encoded echoes (RARE factor). B0 field homogeneity was improved by shimming on the tumor slice, with a typical water resonance half height line width of 20–30 Hz.
Data Analysis
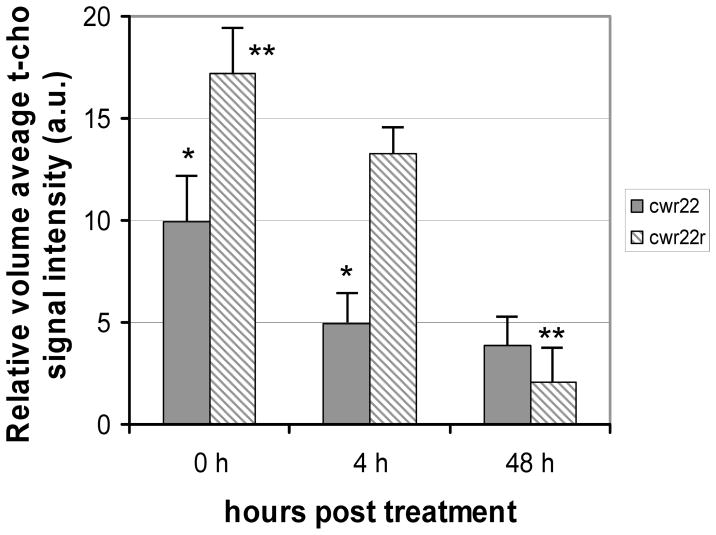
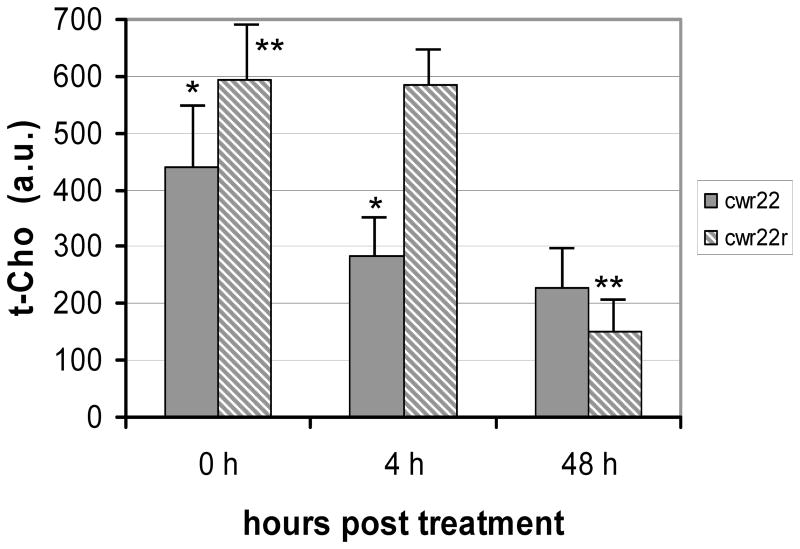
All MRSI data were processed off-line using SAGE-IDL (Spectroscopy Analysis by General Electric, GE medical, Milwaukee, WI; Research Systems Inc., Boulder, CO) with customized automated routines. 10 Hz line-broadening was applied in the spectral dimension. A convolution subtraction method for post-processing water suppression was used. All the spectra in each voxel were phase corrected and the spectral base-line was fitted using a spline routine. Peak line-shape was fitted using a combination of Gaussian and Lorentzian with the Levenberg-Marquardt steepest descent method in SAGE-IDL. T-cho levels for each voxel were obtained from the peak area at approximately 3.22 ppm and were used as relative concentrations with arbitrary units. Peak intensities for each mouse were referenced by the standard deviation (STD) spectral noise level between 8–10 ppm to correct instrument variation. Absolute concentrations were not measured in the study. Tumor volume in the MR slice was measured by using Xtip software suite (Bruker Biospin MRI GmbH, Ettlingen, Germany) for relative t-cho concentration calculations. MR spectroscopic images of t-cho peak were obtained from voxel spectral analysis using IDL. All statistical data represented mean and standard deviation. Statistical analysis of peak areas (Figure 5, 6) was carried out using EXCEL (Microsoft, Richmond, WA). Statistical comparisons of different cohorts were performed using unequally distributed t-test with the significance criteria of 0.05.
Figure 5.
Comparison of relative tumor t-cho levels in CWR22 (solid, n=7) and CWR22r (striped, n=7). Significant differences are observed. * p < 0.05. ** p < 0.001
Figure 6.
Comparison of maximum tumor single voxel t-cho levels in CWR22 (solid, n=7) and CWR22r (striped, n=7). Significant differences are observed. * p < 0.05. ** p < 0.001
Results
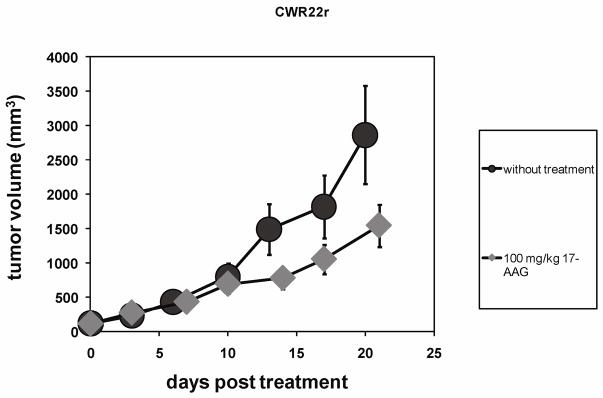
Inspection of Figure 1 shows a growth inhibition apparent at 14 days after a single dose bolus 17-AAG treatment at 100 mg/kg. The tumor volumes in the treated cohorts for CWR22r were significantly smaller (P = 0.01) than the control group with an average treated volume of 781 ± 202 mm3 (n = 9, day 14) as compared to 1493 ± 711 mm3 (n = 8, day 13) in the control group (Figure 1).
Figure 1.
Tumor growth curves for xenograft hormone resistant human prostate cancer CWR22r with bolus 100 mg/kg 17-AAG treatment (n=9) and without the treatment (n=8). Average tumor volumes were 781 ± 202 mm3 at day 14 (treated) and 1493 ± 711 mm3 at day 13(without treatment), with a statistically significant p=0.01.
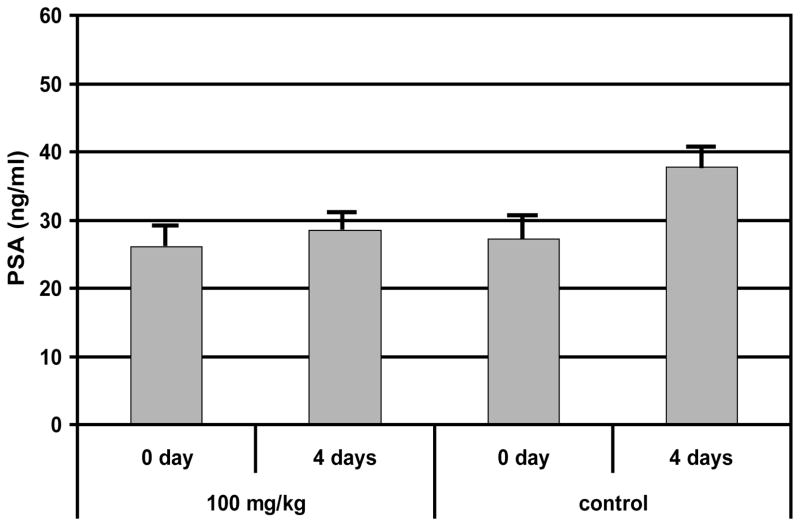
Hormone resistant CWR22r tumors produced little PSA (less than 1ng/ml), while PSA was highly elevated in the hormone sensitive CWR22 tumors. Similar to clinical prostate cancer, CWR22 produced progressively increased levels of PSA with increasing tumor burden. In the absence of 17-AAG treatment, the serum PSA level in CWR22 tumors increased from 27 ± 7 to 38 ± 9 ng/ml (P=0.01, n = 7) in a 4-day interval, consistent with our previous observation of a positive correlation between the PSA level and the tumor volume (33). With the bolus 100 mg/kg 17-AAG treatment we observed that mouse serum PSA level was unchanged 4 days post treatment (P = 0.24, n = 7) (Figure 2). However tumor growth was not significantly different from the control group (control group n = 6; treatment group n = 9). Therefore the negative effect of 100 mg/kg 17-AAG on tumor metabolism was reflected in tumor PSA level but not manifested in tumor volume for CWR22.
Figure 2.
Comparison of blood plasma PSA levels for CWR22 in 100 mg/kg 17-AAG treatment group (n=7) and the untreated control group (n=7) at 0 and 4 days post treatment. * statistically significant p=0.01.
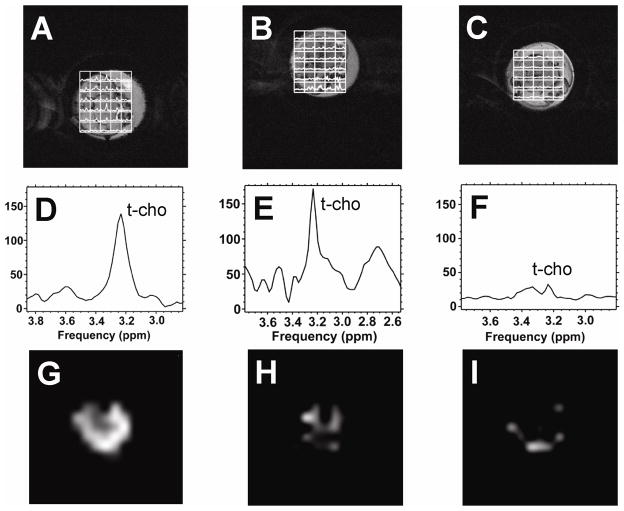
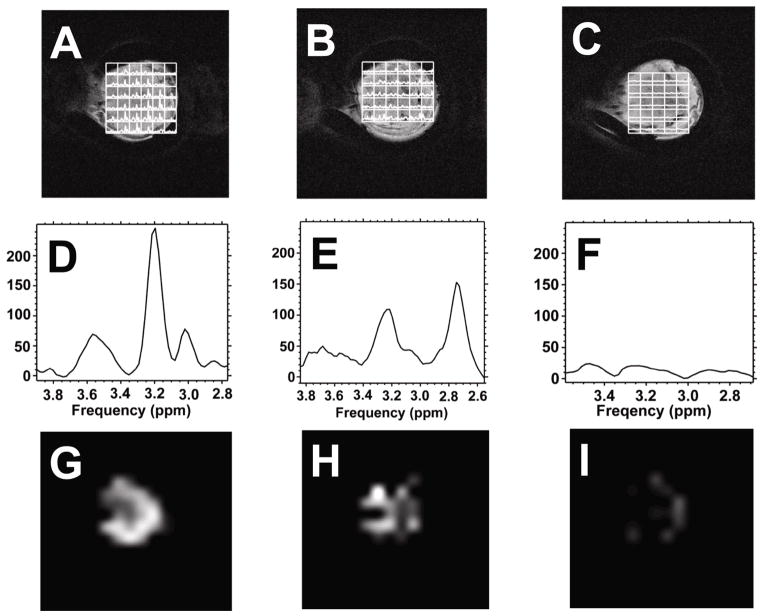
To measure tumor t-cho levels in vivo we used the water suppressed two-dimensional proton CSI method. Elevated t-cho resonances could be observed in tumor containing voxels. Figures 3A–3C show the grid plots of CWR22 spectra overlaid on the tumor images at pre-treatment, 4 hours and 48 hours post 17-AAG treatment. Figures 3D–3F show the corresponding summation spectra of all the tumor voxels. T-cho spectroscopic images of the tumors at the three time points are shown in Figures 3G–3I. Tumor t-cho level was found to be non-uniformly distributed (Figures 3G–3I), with higher t-cho level appearing in the tumor rim and lower t-cho level in the center of the tumor for the untreated tumor. Figures 4A–4I show the overlay plot, the summation spectra and spectroscopic images for the resistant CWR22r tumor. The t-cho distribution pattern in CWR22r tumor was similar to that of CWR22.
Figure 3.
1H CSI grid plots, 1H 1D summation spectra, and t-cho spectroscopic images of the CWR22 tumor region. A), D) & G). 0 hour. B), E) & H) 4 hour. C), F) & I) 48 hour. Figures A, B, C are CSI grid plots overlaid on tumor T2-weighted images; Figures D, E, F are the spectra calculated from summing the spectra from all the tumor voxels; Figures G, H, I are spectroscopic images of tumor t-cho intensities in the tumor. Water suppressed slice selective CSI images were acquired with FOV 32 × 32 mm2, 16 × 16 phase encoding steps, slice thickness 4 mm, TR 1s, TE 75 ms, spectral width 2000 Hz, NEX 8. Only the CSI grid covering the tumor region is shown by overlaying on top of the corresponding slice of the anatomical T2-weighted tumor image. T-cho spectroscopic images were generated in a 16 × 16 grid using measured t-cho peak areas in arbitrary units with a full FOV of 32 mm and the final displays were smoothed with cubic interpolation to 256×256 pixels with the same image intensity scale.
Figure 4.
1H CSI plots and t-cho spectroscopic images of the CWR22r tumor region. A), D) & G). 0 hour. B), E) & H) 4 hour. C), F) & I) 48 hour. Figures A, B, C are CSI grid plots overlaid on tumor T2-weighted images; Figures D, E, F are the spectra calculated from summing the spectra from all the tumor voxels; Figures G, H, I are spectroscopic images of tumor t-cho levels measured above. CSI acquisition parameters are the same as in Figure 3. The spectroscopic images have the same intensity scale.
We measured both the relative volume average t-cho level, the sum of the t-cho intensities (integrated peak area) of all the voxels in the tumor divided by the total voxel volume, and the maximum single voxel t-cho level in the tumor at each time point. CWR22r tumors were found to have a much higher t-cho level than CWR22 before treatment (P<0.001, n = 7). Both CWR22 and CWR22r tumors treated with 17-AAG demonstrated a decrease in t-cho from 0 to 48 hours. Both the average t-cho concentration and the maximum single voxel t-cho level experienced a decline for both tumor lines (Figure 5 and Figure 6). At 4 hours post 17-AAG injection the average t-cho level already showed a decrease in CWR22 tumors (P=0.03, n=7), with no further significant decrease at 48 hours (Figure 5). A similar trend was seen for the maximum single voxel t-cho level. In contrast the decrease in t-cho levels for the hormone resistant CWR22r tumors was not significant 4 hours post treatment (P = 0.18, n = 7). However there was a significant decline in t-cho level at 48 hour (P < 0.0003, n = 7), demonstrating a different temporal response to 17-AAG for hormone sensitive tumors. These changes in total choline were present prior to any significant changes in tumor volume between the treated and untreated cohorts.
Discussion
In this study we used proton MRS to investigate the metabolic response of the targeted 17-AAG treatment in two related human prostate cancer xenograft tumor models CWR22 and CWR22r. Using consecutive or intermittent dosing regimes at a dose between 25–50 mg/kg, earlier studies demonstrated the growth inhibitory effect of 17-AAG on both tumor lines in xenograft tumors, making 17-AAG a potential candidate for treating advanced metastatic prostate cancer (14). Cellular response, such as decreased AR and HER2 levels, was found to occur as early as 4 hours after a single dose of 17-AAG treatment, followed by a recovery in 24 hours (14). Here we found a single 100 mg/kg dose of 17-AAG was inadequate to stop the growth of both tumors, but it was able to arrest the increase of PSA level in CWR22 tumors 4 days after the treatment. This is similar to the PSA responses after radiation and hormone therapy (33, 34). In comparison, CWR22r experienced a significant growth suppression 14 days after the bolus treatment. Consistent with the suppression effects by 17-AAG, the 1H MRS results showed that both tumor lines also exhibited a decline in t-cho levels 2 days after the treatment. By contrast, just 4 hours after the bolus injection, t-cho level for CWR22 was found to have decreased significantly, while the decrease was insignificant for CWR22r. This difference, along with the difference in pretreatment values of t-cho measured by the 1H MRS for the two tumor models, suggest that membrane phospholipid metabolism may vary for the two lines. Furthermore, the different response to 17-AAG might be helpful in understanding the altered tumorigenic pathways of the two tumor lines resulting from hormone resistance.
Using spectroscopic imaging, we also studied tumor t-cho distribution. Regional metabolite heterogeneity was already apparent in relatively small tumors (Figures 3G and 4G). In these two tumor models, a high intensity ring with a low intensity core could be observed, which may indicate a tumor growth pattern - a fast growing rim and a hypoxic or necrotic center due to poor vasculature and perfusion (35). The ring-like feature of the metabolic map was observed earlier in an EMT6 xenograft model and is consistent with previous observations in DCE MRI studies of small xenograft tumors (36–38). In both CWR22 tumor models the whole tumor t-cho levels and the localized ones, represented by the highest single voxel t-cho level in the tumor, showed similar trends after the treatment (Figures 5 and 6) demonstrating a close correlation between the whole tumor inhibition and the inhibition of the most active areas of the tumor.
The in vivo MR detectable t-cho resonance consists of choline moieties from several sources: phosphocholine (PC), glycerophosphocholine (GPC) and free choline (Cho) (39). In vivo tumor t-cho levels are often elevated and have contributions mainly from PC and GPC, and in addition, their relative ratio may alter when compared to the healthy cells due to the transformation to the malignant cell type (40). Clinically, elevated t-cho level is being incorporated as one of the emerging diagnostic markers in prostate cancer detection (41, 42). Even though numerous observations point to a connection between changes in choline metabolism and tumor malignancy, the precise mechanism between cell malignancy and t-cho level is not completely understood at the moment. Extra-cellular choline is transported into the cell by choline transporters and phosphorylated by choline kinase to PC. Choline and GPC are also break-down products of membrane phospholipids. Changes in the activities of choline transporters and the cell membrane lipid synthesis and breakdown cycles can therefore alter the cellular t-cho level. In cell and tumor extract studies Chung et al. observed an increase in PC levels in colon cancer cell lines post 17-AAG treatment (24). In contrast Ronen et al. detected a decrease of PC levels in the ras transfected fibroblast cell line NIH3T3 D12H (25). The observation of a decrease in t-cho levels in this study is consistent with the inhibition of choline kinase activity and choline transport by geldanamycin, of which 17-AAG is a derivative. In the radioactive 14C study, a reduction in 14C labeled choline uptake and phosphocholine production were detected in colon cancer HT29 and breast cancer MCF7 cell lines treated with geldanamycin (43).
With recent progress in unraveling the human genome, more and more oncogenes have been discovered, and they can be potential targets for new cancer therapies. Several recent promising targeted therapies such as Erlotinib, Gefitinib and Bevacizumab, which target EGFR and VGFR, have demonstrated their clinical potential (8–10). But they have also showed the importance of target selection, namely screening patients based on their cancer molecular characteristics to maximize the efficacy of the targeted therapy and to prevent potentially unresponsive tumors as early as possible (44). Early biomarkers to screen patients are therefore crucial to a successful outcome of such therapies. In vivo MRS can non-invasively detect key metabolites in tumors and has the potential to provide such information. In this study we have adopted a localized proton MRS method to image metabolite levels across the tumor. 17-AAG is a promising agent for treating late stage hormone resistant prostate cancer. This study demonstrated the utility of MR spectroscopy to monitor tumor metabolic change during 17-AAG targeted therapy. Using t-cho as a surrogate marker, differences in the drug response and metabolite levels were observed between CWR22’s two cell lines. The early response in t-cho levels in both tumor models indicated tumor t-cho level is a more sensitive metabolic response than changes in tumor volume, and is comparable to PSA and AR expression level changes which occurred in a similar time frame (13). MRS can be a valuable tool in clinical treatment monitoring for advance prostate cancer patients undergoing 17-AAG treatment. Further study on tumor metabolic heterogeneity and proliferation and its biological significance is being conducted.
Acknowledgments
The research is supported by NIH Small-Animal Imaging Research Program (SAIRP) Grant No. R24 CA83084, NIH Center Grant No P30 CA08748, NIH prostate SPORE P50-CA92629 and NIH In Vivo Cellular and Molecular Imaging Centers Grant No. P50CA86438.
Abbreviations
- 17-AAG
17-Allylamino, 17-Demethoxygeldanamycin
- MRS
Magnetic Resonance Spectroscopy
- PSA
Prostate Specific Antigen
- AR
Androgen Receptor
- MRI
Magnetic Imaging
- RARE
rapid acquisition with relaxation enhancement
- CSI
Chemical Shift Imaging
- NMR
Nuclear Magnetic Resonance
- IHC
immunohistochemistry
- i.p
intraperitoneal
- CHESS
chemical shift-selective
References
- 1.Kamal A, Thao L, Sensintaffar J, Zhang L, Boehm MF, Fritz LC, Burrows FJ. A high-affinity conformation of Hsp90 confers tumour selectivity on Hsp90 inhibitors. Nature. 2003;425:407–410. doi: 10.1038/nature01913. [DOI] [PubMed] [Google Scholar]
- 2.American Cancer Society. Cancer facts and figures 2006. Atlanta, GA: American Cancer Society; 2006. [Google Scholar]
- 3.Gomella LG. Contemporary use of hormonal therapy in prostate cancer: managing complications and addressing quality-of-life issues. BJU international. 2007;99(suppl 1):25–29. doi: 10.1111/j.1464-410X.2007.06598.x. [DOI] [PubMed] [Google Scholar]
- 4.Haapala K, Kuukasjarvi T, Hyytine E, Helin HJ, Koivisto PA. Androgen receptor amplification is associated with increased cell proliferation in prostate cancer. Human Pathol. 2007;38:474–478. doi: 10.1016/j.humpath.2006.09.008. [DOI] [PubMed] [Google Scholar]
- 5.Bubendorf L, Kononen J, Koivisto P, Schraml P, Moch H, Gasser TC, Willi N, Mihatsch MJ, Sauter G, Kallioniemi OP. Survey of gene amplifications during prostate cancer progression by high-throughout fluorescence in situ hybridization on tissue microarrays. Cancer Res. 1999;59:803–806. [PubMed] [Google Scholar]
- 6.Mousses S, Wagner U, Chen Y, Kim JW, Bubendorf L, Bittner M, Pretlow T, Elkahloun AG, Trepel JB, Kallioniemi OP. Failure of hormone therapy in prostate cancer involves systematic restoration of androgen responsive genes and activation of rapamycin sensitive signaling. Ocogene. 2001;20:6718–6723. doi: 10.1038/sj.onc.1204889. [DOI] [PubMed] [Google Scholar]
- 7.Petrylak DP. New paradigms for advanced prostate cancer. Rev Urol. 2007;9(Suppl 2):S3–S12. [PMC free article] [PubMed] [Google Scholar]
- 8.Smith J. Erlotinib: small-molecule targeted therapy in the treatment of non-small-cell lung cancer. Clin Ther. 2005;27:1513–34. doi: 10.1016/j.clinthera.2005.10.014. [DOI] [PubMed] [Google Scholar]
- 9.Von Pawel J. Gefitinib (Iressa, ZD1839): a novel targeted approach for the treatment of solid tumors. Bull Cancer. 2004;91:E70–76. [PubMed] [Google Scholar]
- 10.Ferrara N, Hillan KJ, Novotny W. Bevacizumab (Avastin), a humanized anti-VEGF monoclonal antibody for cancer therapy. Biochem Biophys Res Commun. 2005;333:328–35. doi: 10.1016/j.bbrc.2005.05.132. [DOI] [PubMed] [Google Scholar]
- 11.Workman P. Auditing the pharmacological accounts for Hsp90 molecular chaperone inhibitors: unfolding the relationship between pharmacokinetics and pharmacodynamics. Mol Cancer Ther. 2003;2:131–138. [PubMed] [Google Scholar]
- 12.Isaacs JS, Wu W, Neckers L. Heat shock protein 90 as a molecular target for cancer therapeutics. Cancer Cell. 2003;3:213–217. doi: 10.1016/s1535-6108(03)00029-1. [DOI] [PubMed] [Google Scholar]
- 13.Ritossa F. Discovery of the heat shock response. Cell Stress Chaperones. 1996;1:97–98. doi: 10.1379/1466-1268(1996)001<0097:dothsr>2.3.co;2. [DOI] [PMC free article] [PubMed] [Google Scholar]
- 14.Solit DB, Zheng FF, Drobnjak M, Munster PN, Higgins B, Verbel D, Heller G, Tong W, Cordon-Cardo C, Agus DB, Scher HI, Rosen N. 17-Allylamino-17-demethoxygeldanamycin induces the degradation of androgen receptor and HER-2/neu and inhibits the growth of prostate cancer xenografts. Clinic. Cancer Res. 2002;8:986–993. [PubMed] [Google Scholar]
- 15.Enmon R, Yang WH, Ballangrud AM, Solit DB, Heller G, Rosen N, Scher HI, Sgouros G. Combination treatment with 17-N-Allylamino-17-Demethoxy geldanamycin and acute irradiation produces supra-additive growth suppression in human prostate carcinoma spheroids. Cancer Res. 2003;63:8393–8399. [PubMed] [Google Scholar]
- 16.Heath EI, Gaskins M, Pitot HC, Pili R, Tan W, Marschke R, Liu G, Hillman D, Sarkar F, Sheng S, Erlichman C, Ivy P. A phase II trial of 17-Allylamino-17-Demethoxygeldanamycin in patients with hormone-refractory metastatic prostate cancer, Clin. Prostate Cancer. 2005;4:138–141. doi: 10.3816/cgc.2005.n.024. [DOI] [PubMed] [Google Scholar]
- 17.Pretlow TG, Wolman SR, Micale MA, Pelley RJ, Kursh ED, Resnick MI, Bodner DR, Jacobberger JW, Delmoro CM, Giaconia JM. Xenografts of primary human prostatic carcinoma. J Natl Cancer Inst. 1993;85:394–398. doi: 10.1093/jnci/85.5.394. [DOI] [PubMed] [Google Scholar]
- 18.Wainstein MA, He F, Robinson D, Kung HJ, Schwartz S, Giaconia JM, Edgehouse NL, Pretlow TP, Bodner DR, Kursh ED, Resnick MI, Seftel A, Pretlow TG. CWR22: Androgen-dependent Xenograft Model Derived from a Primary Human Prostatic Carcinoma. Cancer Research. 1994;54:6049–6052. [PubMed] [Google Scholar]
- 19.Nagabhushan M, Miller CM, Pretlow TP, Giaconia JM, Edgehouse NL, Schwartz S, Kung HJ, de Vere White RW, Gumerlock PH, Resnick MI, Amini SB, Pretlow TG. CWR22: the first human prostate cancer xenograft with strongly androgen-dependent and relapsed strains both in vivo and in soft agar. Cancer Research. 1996;56:3042–3046. [PubMed] [Google Scholar]
- 20.Agus DB, Cordon-Cardo C, Fox W, Drobnjak M, Koff A, Golde DW, Scher HI. Prostate cancer cell cycle regulators: response to androgen withdrawal and development of androgen independence. J Natl Cancer Inst. 1999;91:1869–1876. doi: 10.1093/jnci/91.21.1869. [DOI] [PubMed] [Google Scholar]
- 21.Solit DB, Scher HI, Rosen N. Hsp90 as a therapeutic target in prostate cancer. Seminars in Oncol. 2003;30:709–716. doi: 10.1016/s0093-7754(03)00346-4. [DOI] [PubMed] [Google Scholar]
- 22.Collins I, Workman P. New approaches to molecular cancer therapeutics. Nature Chemical Biology. 2006;2:689–700. doi: 10.1038/nchembio840. [DOI] [PubMed] [Google Scholar]
- 23.Workman P. Genomics and the second golden era of cancer drug development. Mol BioSyst. 2005;1:17–26. doi: 10.1039/b501751n. [DOI] [PubMed] [Google Scholar]
- 24.Chung YL, Troy H, Banerji U, Jackson LE, Walton MI, Stubbs M, Griffiths JR, Judson IR, Leach MO, Workman P, Ronen SM. Magnetic resonance spectroscopic pharmacodynamic markers of the heat shock protein 90 inhibitor 17-allylamino, 17-Demethoxygeldanamycin (17AAG) in human colon cancer models. J Natl Cancer Inst. 2003;95:1624–1633. doi: 10.1093/jnci/djg084. [DOI] [PubMed] [Google Scholar]
- 25.Ronen SM, Jackson LE, Beloueche M, Leach MO. Magnetic resonance detects changes in phosphocholine associated with Ras activation and inhibition in NIH 3T3 cells. Brit. J Cancer. 2001;85:691–696. doi: 10.1054/bjoc.2000.1663. [DOI] [PMC free article] [PubMed] [Google Scholar]
- 26.Carroll PR, Coakley FV, Kurhanewicz J. Magnetic resonance imaging and spectroscopy of prostate cancer. Rev Urol. 2006;8(Suppl 1):S4–S10. [PMC free article] [PubMed] [Google Scholar]
- 27.Mueller-Lisse U, Scherr MK. Proton MR spectroscopy of the prostate. Euro J Rad. 2007;63:351–360. doi: 10.1016/j.ejrad.2007.06.024. [DOI] [PubMed] [Google Scholar]
- 28.Futterer JJ, Heijmink SWTPJ, Scheenen TWJ, Veltman J, Huisman HJ, Vos P, Hulsbergen-Van de Kaa CA, Witjes JA, Krabbe PFM, Heerschap A, Barentsz JO. Prostate cancer localization with dynamic contrast-enhanced MR imaging and proton MR spectroscopic imaging. Radiology. 2006;241:449–458. doi: 10.1148/radiol.2412051866. [DOI] [PubMed] [Google Scholar]
- 29.Ackerstaff E, Pflug BR, Nelson JB, Bhujwalla ZM. Detection of increased choline compounds with proton nuclear magnetic resonance spectroscopy subsequent to malignant transformation of human prostatic epithelial cells. Cancer Research. 2001;61:3599–3603. [PubMed] [Google Scholar]
- 30.Iorio E, Mezzanzanica D, Alberi P, Spadaro F, Ramoni C, D’Ascenzo S, Millimaggi D, Pavan A, Dolo V, Canevari S, Podo F. Alterations of choline phospholipid metabolism in ovarian tumor progression. Cancer Research. 2005;65:9369–9376. doi: 10.1158/0008-5472.CAN-05-1146. [DOI] [PubMed] [Google Scholar]
- 31.Fulham MJ, Bizzi A, Dietz MJ, Shih HL, Raman R, Sobering GS, Frank JA, Dwyer AJ, Alger JR, Di Chiro G. Mapping of brain tumor metabolites with proton MR spectroscopic imaging: clinical relevance. Radiology. 1992;185:675–686. doi: 10.1148/radiology.185.3.1438744. [DOI] [PubMed] [Google Scholar]
- 32.Haase A, Frahm J, Haenicke W, Matthei D. 1H NMR chemical shift selective (CHESS) imaging. Phys. Med. Biol. 1985;30:341–344. doi: 10.1088/0031-9155/30/4/008. [DOI] [PubMed] [Google Scholar]
- 33.Dyke JP, Zakian KL, Spees WM, Matei C, Chen Y, Mao X, Shungu D, Koutcher JA. Metabolic response of the CWR22 prostate tumor xenograft after 20 Gy of radiation studied by 1H spectroscopic imaging, Clin. Cancer Res. 2003;9:4529–4536. [PubMed] [Google Scholar]
- 34.Trédan O, Galmarini CM, Patel K, Tannock IF. Drug Resistance and the Solid Tumor Microenvironment. J Natl Cancer Inst. 2007;99:1441–1454. doi: 10.1093/jnci/djm135. [DOI] [PubMed] [Google Scholar]
- 35.Mueller-Lisse UG, Vigneron DB, Hricak H, Swanson MG, Carroll PR, Bessette A, Scheidler J, Srivastava A, Males RG, Cha I, Kurhanewicz J. Localized prostate cancer: effect of hormone deprivation therapy measured by using combined three-dimensional 1H MR spectroscopy and MR imaging: clinicopathologic case-controlled study. Radiology. 2001;221:380–390. doi: 10.1148/radiol.2211001582. [DOI] [PubMed] [Google Scholar]
- 36.He Q, Bhujwalla ZM, Glickson JD. Proton detection of choline and lactate in EMT6 tumors by spin-echo-enhanced selective multiple-quantum-coherence transfer. J Mag Res Ser B. 1996;112:18–25. doi: 10.1006/jmrb.1996.0104. [DOI] [PubMed] [Google Scholar]
- 37.Checkley D, Tessier JJ, Kendrew J, Waterton JC, Wedge SR. Use of dynamic contrast-enhanced MRI to evaluate acute treatment with ZD6474, a VEGF signaling inhibitor, in PC-3 prostate tumors, Brit. J Cancer. 2003;89:1889–95. doi: 10.1038/sj.bjc.6601386. [DOI] [PMC free article] [PubMed] [Google Scholar]
- 38.Muruganandham M, Lupu M, Dyke JP, Matei C, Linn M, Packman K, Kolinsky K, Higgins B, Koutcher JA. Preclinical evaluation of tumor microvascular response to a novel antiangiogenic/antitumor agent RO0281501 by dynamic contrast-enhanced MRI at 1.5 T. Mol Cancer Ther. 2006;5:1950–1957. doi: 10.1158/1535-7163.MCT-06-0010. [DOI] [PubMed] [Google Scholar]
- 39.Barker PB, Breiter SN, Soher BJ, Chatham JC, Forder JR, Samphilipo MA, Magee CA, Anderson JH. Quantitative proton spectroscopy of canine brain: in vivo and in vitro correlations. Magn. Res. Med. 1994;32:157–163. doi: 10.1002/mrm.1910320202. [DOI] [PubMed] [Google Scholar]
- 40.Glunde K, Jie C, Bhujwalla ZM. Molecular causes of the aberrant choline phospholipids metabolism in breast cancer. Cancer Res. 2004;64:4270–4276. doi: 10.1158/0008-5472.CAN-03-3829. [DOI] [PubMed] [Google Scholar]
- 41.Pucar D, Shukla-Dave A, Hricak H, Moskowitz CS, Olgac S, Ebora LE, Scardino PT, Koutcher JA, Zakian KL. Prostate cancer: correlation of MR imaging and MR spectroscopy with pathologic findings after radiation therapy-initial experience. Radiology. 2005;236:545–553. doi: 10.1148/radiol.2362040739. [DOI] [PMC free article] [PubMed] [Google Scholar]
- 42.Kurhanewicz J, Vigneron DB, Hricak H, Narayan P, Carroll P, Nelson SJ. Three-dimensional H-1 MR spectroscopic imaging of the in situ human prostate with high (0.24–0.7-cm3) spatial resolution. Radiology. 1996;198:795–805. doi: 10.1148/radiology.198.3.8628874. [DOI] [PubMed] [Google Scholar]
- 43.Liu D, Hutchinson OC, Osman S, Price P, Workman P, Aboagye EO. Use of radiolabelled choline as a pharmacodynamic marker for the signal transduction inhibitor geldanamycin, Brit. J Cancer. 2002;87:783–789. doi: 10.1038/sj.bjc.6600558. [DOI] [PMC free article] [PubMed] [Google Scholar]
- 44.Pao W. Defining clinically relevant molecular subsets of lung cancer. Cancer Chemother Pharmacol. 2006;58(Suppl 1):s11–15. doi: 10.1007/s00280-006-0310-x. [DOI] [PubMed] [Google Scholar]


