Abstract
Due to their optical absorption properties, metallic nanoparticles are excellent photoacoustic imaging contrast agents. A silver nanosystem is presented here as a potential contrast agent for photoacoustic imaging and image-guided therapy. Currently, the nanosystem consists of a porous silver layer deposited on the surface of spherical silica cores ranging in diameter from 180 to 520 nm. The porous nature of the silver layer will allow for release of drugs or other therapeutic agents encapsulated in the core in future applications. In their current PEGylated form, the silver nanosystem is shown to be nontoxic in vitro at concentrations of silver up to 2 mg∕ml. Furthermore, the near-infrared absorbance properties of the nanosystem are demonstrated by measuring strong, concentration-dependent photoacoustic signal from the silver nanosystem embedded in an ex vivo tissue sample. Our study suggests that silver nanosystems can be used as multifunctional agents capable of augmenting image-guided therapy techniques.
Keywords: silver, nanoparticles, nanosystem, photoacoustic imaging, ultrasound imaging, therapy, contrast agent, drug delivery, hybrid nanoparticles
Introduction
Research on the design and delivery of nanoparticles for use in biomedical applications has increased exponentially in recent years.1, 2 As custom-designed nanoparticles are built for biomedical diagnostic and∕or therapeutic purposes, researchers must invariably answer two fundamental questions: 1. were the nanoparticles delivered to the diseased tissue, and 2. did the nanoparticles perform their intended function (i.e., drug delivery or imaging contrast, etc.) at that diseased site. We present a custom-designed nanosystem combined with a photoacoustic imaging modality that can potentially answer these two vital questions.
Photoacoustic imaging is a promising technology because it combines the benefits of optical imaging methods with the clinically available and cost-effective ultrasound imaging modality. The photoacoustic technique takes advantage of the principal of sound generation based on light absorption first introduced by Bell.3 Put simply, photoacoustic imaging works by shining pulsed light onto tissue labeled with optical absorbers (i.e., nanoparticles, dyes, etc.). The subsequent light absorption generates small thermoelastic expansion events surrounding the nanoparticles or native tissue constituents that absorb light strongly. These events produce pressure waves that can be detected by an ultrasound transducer and thus used to spatially resolve the location of nanoparticles. In addition, the same transducer can also obtain pulse-echo ultrasound images. Therefore, the presence of nanoparticles inside tissue can be coregistered with the general anatomical images provided by ultrasound.4, 5
Photoacoustic imaging was introduced for use in biomedical applications by Oraevsky,6, 7, 8, 9 and Kruger et al.,10, 11, 12 and then further developed by Ku et al.,13 Wang et al.,14 and others. Now, photoacoustic imaging applications range from microscopy to whole organ imaging.15 Furthermore, photoacoustic imaging is often combined with ultrasound imaging due to the natural coregistration of the ultrasound and photoacoustic imaging planes.5, 16, 17, 18 Both imaging systems are complimentary and capable of providing spatially and temporally coregistered images of tissue morphology, composition, and function.17, 18, 19
Photoacoustic contrast agent development has also grown with the adoption of the photoacoustic imaging technique over the last decade. The surge of research in the fields of nanoscience and nanotechnology has yielded inorganic nanoparticles of various shapes and forms, including shells, rods, and crescents, with tunable absorption properties.20, 21, 22, 23, 24 These nanosystems absorb light strongly in the near-infrared (NIR) spectrum, where absorption from native tissue is minimized.25 They are ideally suited as photoacoustic contrast agents, since the absorption cross section of myriad nanostructures can be multiples to orders of magnitude higher than the surrounding native tissue at NIR wavelengths. Reviews of the basic theory and principles of using nanotechnology in conjunction with photoacoustics are available.26, 27
Most often, nanoparticles for photoacoustic imaging contrast are administered intravenously. They accumulate at a diseased site via both “passive” and “active” mechanisms. In the case of using photoacoustic imaging to highlight cancerous tissue, passive accumulation of nanoparticles in a solid tumor occurs due to the enhanced permeability and retention (EPR) effect, where the nanoparticles get essentially trapped in the leaky and disorganized nature of the tumor vasculature and eventually extravasate through endothelial junctions into the cancerous tissue.28, 29 Active targeting is achieved by covalently attaching antibodies or other signaling molecules to the nanoparticles.29, 30, 31 In this case, in addition to the passive EPR effect, the nanoparticles accumulate in diseased tissue due to the specific affinity of the antibody for its antigen: an up-regulated cell-surface receptor on the diseased cells. Nanoparticles accumulated directly at the site of disease can provide the necessary photoacoustic contrast with healthy tissue that is critical for disease detection and diagnosis.
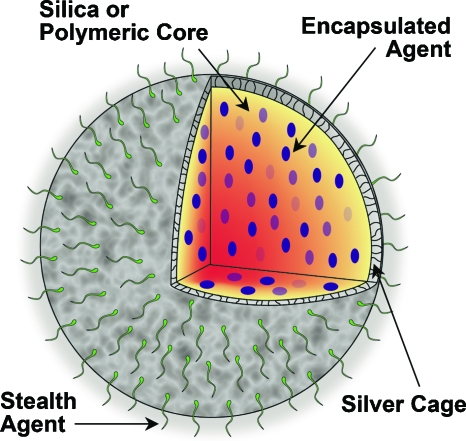
Photoacoustic contrast agents are naturally multifunctional, since low NIR pulsed light can be used for detection and diagnosis, while continuous wave light delivery modes can be used to create photothermal tissue damage from nanoparticle heating.32, 33 We propose that these nanosystems can be functionalized further to expand their therapeutic capability beyond photothermal mechanisms. For instance, core-shell nanoparticles34 with tunable optical absorption properties are currently in clinical trials for photothermal therapy. These nanoshells possess an inert silica core. A new multifunctional nanoplatform technology (Fig. 1) could result from replacing that inert silica with a core capable of carrying drugs or other contrast agents, and reshaping the traditionally confluent metallic outer shell with a porous outer layer that will allow for diffusion of encapsulated agents out of the core. The platform would have a stealthing moiety such as poly(ethylene glycol), or targeting moieties such as antibodies attached to the periphery of the particle for enhanced functionality. This nanoplatform could have enhanced sensitivity to multimodal imaging or treatment strategies.
Figure 1.
Multifunctional nanosystem platform capable of providing imaging contrast, drug delivery, and image-guided therapy.
The benefits of such a nanoplatform could be profound, but first a detailed analysis of the optical properties of a porous layer versus the traditional confluent noble metal shell must be performed. In this work, a porous silver coating was reduced onto a silica core, and the feasibility of using this nanosystem as a photoacoustic imaging contrast agent was evaluated. Furthermore, the biocompatibility of the silver nanosystem was explored by performing cytotoxicity tests in vitro.
Methods and Materials
Coating Silica with a Porous Silver Layer
Various sizes of the silver nanosystem were produced by reducing silver onto silica spheres ranging in diameter from 180 to 520 nm. The procedures for coating the smallest (180 nm) and largest (520 nm) spheres are presented along with generalized rules for scaling the synthesis to any size in between. The silica amine (-NH2 surface groups) was purchased from two vendors: Corpuscular, Incorporated (Cold Springs, New York) or Bangs Laboratories, Incorporated (Fishers, Indiana). A modified stoichiometrically controlled method35 was used to reduce silver onto silica in a porous fashion. The silica spheres (20 μl of 2.5 wt % 180-nm spheres or 1.5 mg of the 520-nm spheres) were suspended via sonication in polypropylene vials containing 30 ml of deionized ultrafiltered (18.2 m Ω-cm) (DIUF) water (in all diameters of silica attempted, the total surface area of all spheres in solution was kept constant at 6.5×10⁻³ m2). The 180-nm spheres were placed in a 15 °C water bath, while the 520-nm spheres were placed in a 11 °C bath, and both batches were stirred continuously at 500 rpm (the temperature was varied according to the diameter: 15 °C for spheres roughly in the hundreds of nanometers, 14 °C for spheres in the two hundreds of nanometers, and so on). Silver was added to the stirring spheres in the form of 0.4 ml for the 180-nm spheres and 0.8 ml for the 520-nm spheres of 0.15-M silver nitrate. Note that the amount (mmol) of silver to add based on silica diameter, assuming a constant surface area of 6.5×10⁻³ m2, can be calculated as:
| (1) |
where y is the mmol of silver to add and x is the diameter of silica in nanometers. Lastly, 50 μl of 36% glucose and 50 μl of 3% NH4OH solutions were added. Visible color changes from yellow to orange-brown, and finally gray-black were evident between 2 and 13 min after adding NH4OH. The pH of the solutions initially rose to 9 on addition of the NH4OH, but then fell to 7 when the silver reduction was complete. To suppress aggregation, 200 μl of 50 mM poly(ethylene glycol) [mPEG-SH of 5000 g∕mol from Laysan Bio (Arab, Alabama)] was added. The nanosystem was collected and cleaned three times using DIUF water and a 100-kDa Millipore (Billerica, Massachusetts) centrifugal filter spun at 1500 g for 4 min. For storage, the nanosystem can be suspended in DIUF water and stored in a plastic vial in the dark for several weeks.
The silver nanosystem was analyzed using a LEO 1530 scanning electron microscope. The ultraviolet to visible (UV-vis) extinction spectrum of the as-prepared nanosystem suspended in DIUF water was captured using a Shimadzu (Kyoto, Japan) UV-1201 spectrophotometer (the spectra obtained represent either ∼2.0×10⁹ 180-nm core particles per ml or ∼2.6×10⁸ 520-nm core particles per ml).
Photoacoustic and Ultrasound Imaging of the Silver Nanosystem
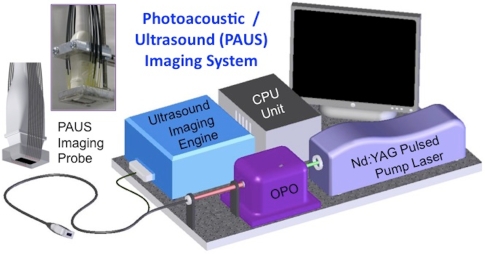
To test the feasibility of using the silver nanosystem as a contrast agent for combined photoacoustic and ultrasound (PAUS) imaging, a custom-made imaging system was employed (Fig. 2). This system inherently contained two parts: a pulsed laser system with light delivery assembly interfaced with an ultrasound array-based transducer operated by an ultrasound system capable of capturing radio frequency (rf) signals. Pulsed light was generated by an optical parametric oscillator (OPO), tunable within a 680 to 950 nm range. For all studies, a wavelength of 800 nm with 5-ns laser pulse duration at a 10-Hz pulse repetition rate was used. The maximum laser energy per pulse was 15 mJ∕cm2, which is well below the maximum permissible exposure standard set by the American National Standards Institute.36 From the OPO system, light was directed into a fiber optic bundle containing 18 individual fibers. These fibers surrounded the ultrasound transducer (7.5-MHz center frequency, 14 mm wide, 128 element linear array), and allowed light irradiation and sound delivery to overlap within the imaging plane. The ultrasound transducer was interfaced with a Cortex ultrasound imaging engine (Winprobe Corporation, North Palm Beach, Florida) capable of rf data acquisition. The pulsed laser system, integrated imaging probe, and ultrasound system with rf signal acquisition together made up the PAUS system that could capture spatially coregistered photoacoustic and ultrasound rf signals needed to form both photoacoustic and ultrasound images.
Figure 2.
Schematic of the combined photoacoustic and ultrasound (PAUS) imaging system incorporating the array-based ultrasound transducer integrated with the fiber optical light delivery system.
To evaluate the nanosystem as a contrast agent for photoacoustic imaging, the PAUS system was employed to image the nanoparticles directly injected into an ex vivo canine pancreas. Specifically, the pancreas was set in a gelatin mold (only for structural stability and ease of imaging). The 180-nm silica core, silver-coated particles (50 μl of 109 particles∕ml suspended in a warm 8% gelatin solution) were injected via needle into the chilled pancreas, approximately 8 to 10 mm below the pancreas surface. The solution with nanoparticles quickly gelled inside the organ, mimicking accumulation of the nanosystem in a small tumor. Spatially coregistered photoacoustic and ultrasound rf signals were captured using the PAUS system. All rf data were then beam-formed and the images were plotted using conventional logarithmic (ultrasound) and linear (photoacoustic) scales.
Preparing Samples of Set Concentrations of the Nanosystem for Imaging Studies
Samples of the nanosystem were created by incorporating the 180-nm silica core, silver-coated particles in poly(vinyl alcohol) (PVA) at concentrations of 2×10⁷, 2×10⁸, and 2×10⁹ particles per ml. Specifically, under continuous stirring, 8 wt % PVA [165 sf from Celvol (Celanese Corporation, Dallas, Texas)] was dissolved in water at 70 °C containing a colloidal suspension of nanoparticles. After 15 min, the solution was pulled into a 1-cc syringe. The syringes were put through four freeze-thaw cycles where the syringes were held at −20 °C for 12 h, followed by room temperature for 12 h. During these cycles, the PVA formed physical cross-links with itself, and at the conclusion of the four cycles, firm 5-mm-diam cylindrical samples of suspended nanoparticles were removed from the syringes. Setting the nanoparticles in these PVA samples provided a physical construct that held the various concentrations of nanoparticles in place for imaging.
Cytotoxicity Testing of the Nanosystem
The breast cancer cell line MDA-MB-231 and the pancreatic cancer cell line MPanc96 were both incubated with nanoparticles and tested for cell viability. Both cell lines were cultured in vitro using Dulbecco’s Modified Eagle Medium (with 4500-mg glucose∕L, L-glutamine, NaHCO3, and pyridoxine HCl) supplemented with 10% fetal bovine serum, and 1% HEPES buffer and maintained at 37 °C and 5% CO2 in a humidified incubator. All cell culture products were purchased from Sigma (Saint Louis, Missouri). For cell viability studies, cells were seeded in a 96-well plate (each well had 5000 cells per 100 μl of media). The cells were allowed to attach and grow in the 96-well plate for 24 h, after which the cell media was removed and replaced with suspensions of PEGylated, silver-coated 180-nm silica spheres at various concentrations representing 2, 1, 0.5, 0.25, 0.125, and 0 mg∕ml of silver in media (at least five wells were seeded with each concentration). Note that the highest silver concentration at 2 mg∕ml represented ∼2×10¹⁰ particles per ml, while the lowest silver concentration at 0.125 mg∕ml represented ∼1×10⁹ particles per ml. After 24 h of incubation, the media containing the silver nanosystem was removed and replaced with fresh media containing no nanoparticles. The absorbance of each well in the plate was measured at 490 nm using a Synergy HT Multimode Microplate Reader from BioTek (Winooski, Vermont). Then, 20 μl of a tetrazolium compound [3-(4,5-dimethylthiazol-2-yl)-5-(3-carboxymethoxyphenyl)-2-(4-sulfophenyl)-2H-tetrazolium (MTS) and an electron coupling reagent (phenazine methosulfate) PMS from the CellTiter 96® AQueous Non-Radioactive Cell Proliferation Assay (a Promega product, Madison, Wisconsin) was added to each well. Over a period of 1.5 h in the incubator, the MTS was bioreduced by cells into a formazan product that had an absorbance peak at 490 nm. Dehydrogenase enzymes found in metabolically active cells were responsible for the conversion of MTS into the soluble formazan product. Therefore, the absorbance of each well at 490 nm was directly proportional to the number of viable cells. Values for the absorbance of each well at 490 nm taken before adding MTS were subtracted from the after MTS incubation values. Cell viability was determined by comparing the resulting absorbance of wells containing no nanoparticles to wells containing nanoparticles using an F test for a one-way analysis of variance (ANOVA).
Results and Discussion
Silver Nanosystem
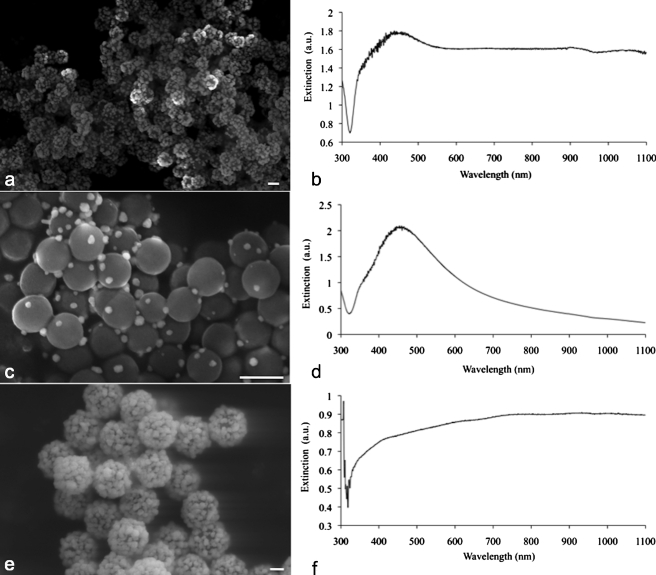
Porous silver coatings built around sizes of silica cores ranging in diameter from 180 to 520 nm were produced. A scanning electron micrograph of a typical batch of 180-nm particles and its corresponding UV-vis spectrum are shown in Figs. 3a, 3b. The extinction spectrum is broad and extends into the near-infrared wavelength region; this ultimate broadening is comparable to results from other researchers who created similar coatings with different methods.37, 38 To achieve this broad extinction, sufficient silver coverage of the silica core is required. Indeed, when only half of the recommended moles of silver were reacted with 180-nm silica cores, this resulted in insufficient coating of the particles, as shown in Fig. 3c. The corresponding extinction spectrum for these sparsely coated particles is similar to solid silver spheres in solution, as shown in Fig. 3d. These results suggest that the rough, porous coatings of silver over silica must reach a minimal confluency on the surface of silica for plasmonic effects to be observed in near-infrared (NIR) wavelengths of light. Previous research has suggested that particles on the surface must be no more than three radii away from each other for nanoparticle plasmonic coupling to happen, shifting extinction to the NIR spectrum.39, 40, 41
Figure 3.
(a) Scanning electron micrograph (SEM) of the silver nanosystem with silica core diameter of 180 nm, and (b) corresponding coated 180-nm UV-vis spectrograph; (c) a batch of sparsely coated 180-nm nanoparticles, and (d) corresponding UV-vis spectrograph; (e) a silver-coated 520-nm silica core batch, and (f) corresponding UV-vis spectrograph. All scale bars are 200 nm.
Silica core sizes up to 520 nm were coated with silver as shown in Fig. 3e. Interestingly, the corresponding extinction spectrum (Fig. 3f) was similar to that of the coated 180-nm particles [Fig. 3b], despite the large difference in silica core size. Research from the Hirsch group has shown that by changing the thickness of a confluent layer of metal over a silica core, the absorption peak of the resulting nanoparticles can be tuned.42 Since we created a rough layer of silver over silica, it follows that our nanosystem consists of particles with varying silver coating thickness. Therefore, the nanosystem is made up of nanoparticles, each of which is resonating at a slightly different wavelength. At a macroscopic level, this results in the ultimate broadening on the extinction spectra, since the spectra represents the contribution from all these roughly coated nanoparticles. Adding to this resonance effect is the action of single silver spheres in close proximity. On the surface of many particles, the coating is semiconfluent, but on others there is evidence of single silver spheres all attached to the silica and packed closely together. As mentioned previously, plasmon coupling effects take place when metal nanoparticles are within several radii of each other.39, 40, 41
The silver nanosystems described here are large with core diameters ranging from 180 to 520 nm; Mie theory calculations show that the extinction spectra for traditional core-shell, silica-silver particles are dominated by scattering. In fact, Jain et al.21 described that for core-shell particles of this size, the scattering cross section divided by the absorption cross section is expected to be much greater than 6. However, the principal requirement for an excellent photoacoustic contrast agent is high optical absorption, which is represented by the absorption coefficient μa. The absorption coefficient is defined as
| (2) |
where N is the number concentration of particles and σabs is the absorption cross section of one particle. Furthermore, σabs=Qabs⋅σg, where Qabs is the absorption efficiency and σg is the geometric cross section of one particle. The Qabs for a 30-nm gold sphere is 2 at 532 nm,43 and Qabs for a silica-silver core shell structure (180-nm core, 60-nm shell) at 800 nm (as calculated from publicly available Mie-coated software developed by Matzler at the University of Bern44) is ∼2 orders of magnitude lower at 0.018. The geometric cross section, however, of the silver nanosystem is almost 2 orders of magnitude greater than the gold spheres. Therefore, as it follows from Eq. 2, for the same concentration of the two nanosystems, the absorption coefficient μa is on the same order of magnitude. This simple comparison elucidates why larger nanosystems can enhance photoacoustic imaging contrast to the same degree as smaller nanosystems that inherently possess higher absorption efficiencies. Therefore, when comparing nanosystems for enhancement of photoacoustic contrast, a critical parameter to consider is the absorption cross section σabs. It is important to note that these Mie theory calculations are limited to core-shell particles and do not adequately describe the rough coatings purposefully built here, but these sample calculations were provided to convey the significance of the σabs parameter in the design of photoacoustic contrast agents.
Imaging of the Silver Nanosystem in Ex Vivo Pancreatic Tissue
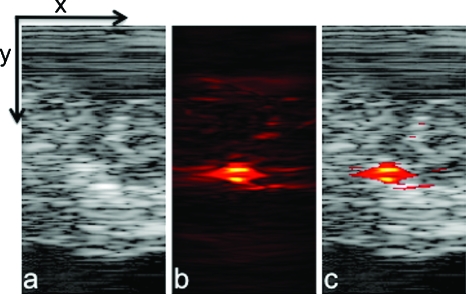
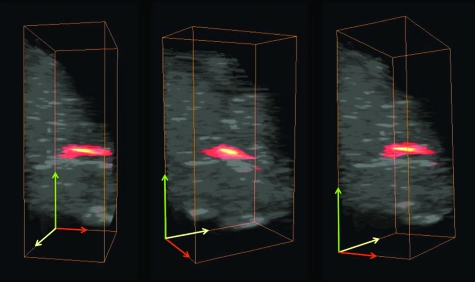
One of the advantages of photoacoustic imaging is its ability to detect nanoparticles deep in tissue. This capability was tested by performing PAUS imaging ex vivo on a canine pancreas after injecting 50 μl of 180-nm silica core, silver-coated particles at a concentration of 109 particles∕ml. The ultrasound image [Fig. 4a] defines the pancreas area, the photoacoustic image [Fig. 4b] shows the signal received primarily from the nanosystem interrogated by the pulse of scattered laser light, and the combined image [Fig. 4c] clearly depicts the location of the nanosystem against the background ultrasonic image of the organ. This series of images demonstrates the ability of combined PAUS imaging to locate accumulated nanoparticles inside tissue and spatially register their location relative to the anatomical structures of the background tissue. In this case, strong photoacoustic signal from nanoparticles located 1 cm deep in tissue was detected. By translating the PAUS imaging probe across the tissue surface, a 3-D rendering of the entire nanoparticle injection region in the tissue could be generated (Fig. 5 and Video 1). Thus, if the silver nanosystem were injected in the bloodstream systematically and accumulated in a cancerous mass, then combined PAUS imaging could be used to locate the nanoparticles inside tissue, helping clinicians to better define and characterize diseased areas.
Figure 4.
(a) Ultrasound, (b) photoacoustic, and (c) combined images of nanoparticles injected directly into an ex vivo canine pancreas. All images were acquired from the same position as determined by the location of the ultrasound transducer. The images are 20 mm deep (y axis) and 10.5 mm wide (x axis).
Figure 5.
Several views of a 3-D rendering of PAUS imaging from the silver nanosystem injected directly into an ex vivo canine pancreas. All images are 20×10.5×12 mm. For clarity, ultrasound signal from gelatin above the tissue was suppressed in these images.
Video 1.
A movie of the 3-D rendering of PAUS imaging from the silver nanosystem injected directly into an ex vivo canine pancreas. The image covers a 20×10.5×12-mm volume. For clarity, ultrasound signal from gelatin above the tissue was suppressed (QuickTime, 1.97 MB). .
Imaging the Nanosystem Samples of Set Concentrations
In addition to the imaging performed on the pancreas, some fundamental properties of the photoacoustic signal from these nanoparticles were analyzed using samples of silver-coated silica suspended in poly(vinyl alcohol) (PVA). Before describing the results of these studies in detail, the following relationships are provided for completeness. First, the photoacoustic pressure (P) generated from an absorbing source immediately following a laser pulse can be defined as follows,45
| (3) |
where β is the thermal expansion coefficient, ν is the acoustic velocity in the medium, μa is the absorption coefficient [as defined in Eq. 2], F is the fluence of light reaching the absorber, and Cp is the specific heat at constant pressure. Note that absorption from native tissue and∕or PVA was assumed to be constant in our calculations, so changes in μa should solely reflect changes in nanoparticle concentration. Given these relationships and minimal temperature increases during PAUS imaging,32, 33, 46 a plot of P∕F versus N should be linear. To test this hypothesis, PVA samples with different concentrations of nanoparticles were imaged and analyzed.
The PVA samples, set in a gelatin mold for structural stability during photoacoustic imaging trials, were imaged using the PAUS imaging setup similar to that shown in Fig. 2, except that samples were irradiated using a diffuse air beam outputted directly from the OPO (i.e., no optical fibers were used). Furthermore, the air beam and ultrasound imaging plane were perpendicular to each other, not coaxial as shown in Fig. 2. Specifically, an 800-nm, 4 mJ per pulse laser beam, diffused over an ∼1-cm2 spot size, was directed at the circular end of the cylindrical nanoparticle samples. The 7.5-MHz, 128-element linear array transducer was set to image a traverse plane about ∼2.5 mm away from the circular end of the cylindrical samples. Such an imaging setup was needed to ensure homogeneous irradiation of the samples with known laser fluence (4 mJ∕cm2), thus allowing the analysis of the photoacoustic pressure dependence on the concentration of nanoparticles.
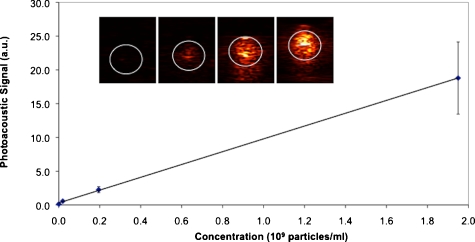
Photoacoustic imaging of the samples resulted in a visible increase in signal as the concentration of nanoparticles increased, as shown in Fig. 6. To measure the changes in photoacoustic pressure quantitatively, areas inside the white circular regions of interest labeled in the inset images on Fig. 6 were set into grids of 60×50 pixels, inside which a box of 30×30 pixels was defined. The mean photoacoustic signal value of the 30×30 pixel area was calculated for 21 different positions inside the 60×50 grid. The average of those different means was taken as the relative photoacoustic pressure for each sample. The relative fluence-compensated pressure values [per Eq. 3] versus concentration for each sample was linear (R2=0.999). This result confirms the fundamental relationship that for a reasonable range of concentration of absorbers (nanoparticles), the photoacoustic signal from the nanosystem increases linearly with the concentration of nanoparticles.
Figure 6.
Plot of fluence-normalized photoacoustic signal versus nanoparticle concentration for the four samples shown in the inset. Inset: photoacoustic images of gelatin phantom with PVA samples containing 0, 2×10⁷, 2×10⁸, and 2×10⁹ particles per ml from left to right, where the white circle outlines the boundaries of the samples as determined by ultrasound imaging. All inset images are 12.5×10.5 mm.
Imaging the silver nanosystem with set concentrations of particles not only allowed for testing this linear relationship, but also allowed for testing the sensitivity of our photoacoustic imaging system. Sensitivity was accessed by comparing our lowest concentration sample at 2×10⁷ particles per ml to our control containing no particles. Using a balanced one-way ANOVA test, the means of the signals gathered per the 21 box positions were compared between the control sample (no particles) and the lowest concentration sample tested (2×10⁷ particles per ml). With a p value <0.000001, the means of the two signal sets were statistically significantly different. Therefore, our photoacoustic imaging system is sensitive to concentrations at least as low as 2×10⁷ particles per ml. This detection limit is more than 1 order of magnitude lower than that reported for gold nanorods (7.5×10⁸ nanorods per ml as reported by Eghtedari et al.47). However, a direct comparison of these two sensitivity figures is not fully meaningful, since the experimental conditions (i.e., the medium and distance traveled by light) were different in the two experimental setups. Nonetheless, the comparison does indicate that our silver nanosystem was able to enhance photoacoustic signal at low concentrations similar to a well-known standard such as gold nanorods.
In future in vivo experiments, the linear relationship between photoacoustic pressure and concentration of nanoparticles can be used to quantify the accumulation of the nanoparticles inside the tissue. If these nanoparticles were carrying drugs or other molecules of interest, performing photoacoustic imaging over time could provide noninvasive, quantifiable, image-guided monitoring of delivery and therapy.
Cytotoxicity Tests Using the Silver Nanosystem
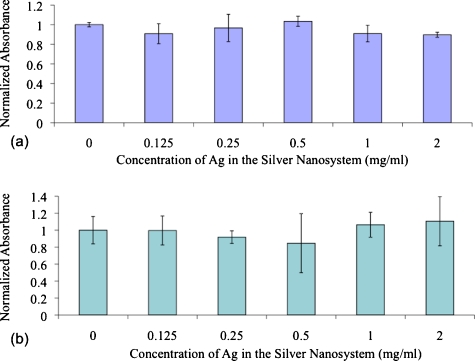
There is much debate in the literature over the toxicity of silver.48 Its use in burn wound treatment and as an antimicrobial in general are well known and characterized, but questions over toxicity still remain.49, 50, 51 Due to these debates, it was critical for cytotoxicity tests to be performed using our proposed silver nanosystem. According to testing on two different cell lines (MDA-MB-231 and MPanc96), concentrations of silver in the silver-coated silica particles up to 2 mg∕ml (∼2×10¹⁰ particles per ml in media) were not exhibiting toxic effects. As shown in Fig. 7, cells exposed to no nanoparticles and cells exposed to concentrations of up to 2-mg∕ml silver content showed no statistically significant variation in cell viability. The ANOVA tests on these populations showed p-values of 0.6 and 0.4 with the MDA-MB-231 and MPanc96 cells lines, respectively. These p-values suggest that there is no reason to reject the null hypothesis that the means of the populations (absorbance values) tested were different. Thus, the cell viability of all the wells is the same, and the silver nanosystem did not exhibit cytotoxic effects, even at concentrations as high as 2-mg∕ml content of silver.
Figure 7.
Cell viability data after 24-h exposure to the silver nanosystem at different concentrations in (a) MDA-MB-231 cells and (b) MPanc96 cells.
To our knowledge, this work represents the first demonstration of photoacoustic imaging using a contrast agent incorporating silver in biological tissue. Silver was chosen over its well-characterized partner, gold, for several reasons. Silver is known to have better light absorption properties than gold, so use of silver as a photoacoustic contrast agent should provide a stronger photoacoustic signal. For instance, a silver nanoshell will have ∼10% stronger and sharper plasmon resonance when compared with a gold nanoshell of the same size.52 Secondly, gold is known to be biocompatible, but it does not degrade in biological tissue, and removing it from that body can be a concern. Silver, on the other hand, is known to be biocompatible under certain concentrations,48, 53 has well-characterized antimicrobial properties,50 and will likely degrade in the body. Further biodistribution and biocompatibility studies should be performed to evaluate the use of nanosilver in the body,54 but this work clearly demonstrates its potential as a photoacoustic contrast agent.
The developed silver nanosystem also has potential in image-guided therapy approaches. Once a diseased tissue or tumor is identified with traditional imaging techniques and the need for therapy is established, the delivery of these nanoparticles to the diseased site of interest could be image-guided to assist different therapy approaches. For example, photoacoustic imaging could be used to detect the presence and concentration of the particles in the tumor while they are simultaneously used for photothermal therapy. Furthermore, different types of therapy can be employed. Indeed, the particles could be used for guidance and monitoring of cavitation therapy, where nanoparticles are used to create nanobubbles. These bubbles can act alone or they can be further exploited in ultrasound therapy. Moreover, when the particles contain chemotherapeutic drugs in their core,55 then drug release could be controlled or monitored using this nanosystem augmented by PAUS imaging. By tailoring the silver coating and the properties of the polymeric core used to make the nanosystem, light may be used to induce a shape change in the structure of the nanosystem. This shape change should cause extensive release of the drug only where light interrogates the tissue with accumulated nanoparticles. Thus, this multifunctional nanoplatform technology can serve simultaneously as an imaging contrast agent and therapeutic delivery and release device, enhancing our capabilities to effectively treat patients.
Conclusions
Rough silver coatings around silica nanospheres can be built, and their optical extinction at near-infrared wavelengths is high and broad. The broadness of the spectrum allows for a multitude of near-infrared wavelengths to be used in photoacoustic imaging of these agents. Using 800-nm light, the silver nanosystem was detected at least 1 cm deep in ex vivo pancreatic tissue using combined photoacoustic and ultrasound imaging. Furthermore, the photoacoustic signal from the nanosystem was found to increase linearly with nanoparticle concentration, as the theory suggests. Therefore, in future designs where drugs or other therapeutic molecules are encapsulated in the silica or polymeric core, this new nanoplatform could provide image-guided therapy monitoring, opening up a host of applications where imaging and therapy are performed simultaneously.
Acknowledgments
The MPanc96 cell line was a generous gift from the pancreatic cancer research group (Dr. Craig Logsdon) at the University of Texas M.D. Anderson Cancer Center based in Houston, Texas. The authors thank Kristina Schlegel for her artistic rendering of Fig. 1. Kimberly Homan was partially supported by a grant from the National Science Foundation under the Integrative Graduate Education and Research Traineeship (IGERT) program. Finally, partial support from the National Institutes of Health under grants CA141203 and EB008101 is acknowledged.
References
- Chen H., Roco M. C., Li X., and Lin Y., “Trends in nanotechnology patents,” Nat. Nanotechnol. 3(3), 123–125 (2008). 10.1038/nnano.2008.51 [DOI] [PubMed] [Google Scholar]
- Roco M. C., “Nanotechnology: convergence with modern biology and medicine,” Curr. Opin. Biotechnol. 14(3), 337–346 (2003). 10.1016/S0958-1669(03)00068-5 [DOI] [PubMed] [Google Scholar]
- Bell A. G., “Production of sound by radiant energy,” J. Franklin Inst. 111(6), 401–426 (1881). 10.1016/0016-0032(81)90005-3 [DOI] [Google Scholar]
- Emelianov S., Aglyamov S., Shah J., Sethuraman S., Scott G., Schmitt R., Karpiouk A., Motamedi M., and Oraevsky A., “Synergy of ultrasound, elasticity, and optoacoustic imaging for improved detection and differentiation of cancerous tissue,” J. Acoust. Soc. Am. 115, 2411 (2004). 10.1121/1.1621858 [DOI] [Google Scholar]
- Emelianov S. Y., Aglyamov S. R., Shah J., Sethuraman S., Scott W. G., Schmitt R., Motamedi M., Karpiouk A., and Oraevsky A., “Combined ultrasound, optoacoustic, and elasticity imaging,” Proc. SPIE 5320, 101–112 (2004). 10.1117/12.537155 [DOI] [Google Scholar]
- Oraevsky A., Jacques S., and Tittel F., “Determination of tissue optical properties by time-resolved detection of laser-induced stress waves,” Proc. SPIE 1882, 86–101 (1993). 10.1117/12.147694 [DOI] [PubMed] [Google Scholar]
- Oraevsky A., Jacques S., Esenaliev R., and Tittel F., “Time-resolved optoacoustic imaging in layered biological tissues,” in Advances in Optical Imaging and Photon Migration, Alfano R. R., Ed., pp. 161–165, Academic Press, New York: (1994). [Google Scholar]
- Oraevsky A., Esenaliev R., Jacques S., Thomsen S., and Tittel F., “Lateral and z-axial resolution in laser optoacoustic imaging with ultrasonic transducers,” Proc. SPIE 2389, 198–208 (1995). 10.1117/12.209986 [DOI] [Google Scholar]
- Oraevsky A. A., Jacques S. L., and Tittel F. K., “Measurement of tissue optical properties by time-resolved detection of laser-induced transient stress,” Appl. Opt. 36(1), 402–415 (1997). 10.1364/AO.36.000402 [DOI] [PubMed] [Google Scholar]
- Kruger R. A., “Photoacoustic ultrasound,” Med. Phys. 21(1), 127–131 (1994). 10.1118/1.597367 [DOI] [PubMed] [Google Scholar]
- Kruger R. A. and Liu P., “Photoacoustic ultrasound: pulse production and detection of 0.5% Liposyn,” Med. Phys. 21(7), 1179–1184 (1994). 10.1118/1.597399 [DOI] [PubMed] [Google Scholar]
- Kruger R. A., Liu P., Fang Y. R., and Appledorn C. R., “Photoacoustic ultrasound (PAUS)—reconstruction tomography,” Med. Phys. 22(10), 1605–1609 (1995). 10.1118/1.597429 [DOI] [PubMed] [Google Scholar]
- Ku G., Wang X., Xie X., Stoica G., and Wang L. V., “Imaging of tumor angiogenesis in rat brains in vivo by photoacoustic tomography,” Appl. Opt. 44(5), 770–775 (2005). 10.1364/AO.44.000770 [DOI] [PubMed] [Google Scholar]
- Wang X., Xu Y., Xu M., Yokoo S., Fry E. S., and Wang L. V., “Photoacoustic tomography of biological tissues with high cross-section resolution: reconstruction and experiment,” Med. Phys. 29(12), 2799–2805 (2002). 10.1118/1.1521720 [DOI] [PubMed] [Google Scholar]
- Xu M. and Wang L. V., “Photoacoustic imaging in biomedicine,” Rev. Sci. Instrum. 77, 041101 (2006). 10.1063/1.2195024 [DOI] [Google Scholar]
- Niederhauser J. J., Jaeger M., Lemor R., Weber P., and Frenz M., “Combined ultrasound and optoacoustic system for real-time high-contrast vascular imaging in vivo,” IEEE Trans. Med. Imaging 24(4), 436–440 (2005). 10.1109/TMI.2004.843199 [DOI] [PubMed] [Google Scholar]
- Emelianov S. Y., Aglyamov S. R., Karpiouk A. B., Mallidi S., Park S., Sethuraman S., Shah S., Smalling R. W., Rubin J. M., and Scott W. G., “Synergy and applications of ultrasound, elasticity, and photoacoustic imaging,” in Proc. IEEE Ultrasonics Symp. 2006, pp. 405–415 (2006).
- Sethuraman S., Aglyamov S. R., Amirian J., Smalling R., and Emelianov S. Y., “Development of a combined intravascular ultrasound and photoacoustic imaging system,” Proc. SPIE 6086, 101–117 (2006). [Google Scholar]
- Sethuraman S., Amirian J. H., Litovsky S. H., Smalling R. W., and Emelianov S. Y., “Spectroscopic intravascular photoacoustic imaging to differentiate atherosclerotic plaques,” Opt. Express 16(5), 3362–3367 (2008). 10.1364/OE.16.003362 [DOI] [PubMed] [Google Scholar]
- Murphy C. J., Sau T. K., Gole A. M., Orendorff C. J., Gao J., Gou L., Hunyadi S. E., and Li T., “Anisotropic metal nanoparticles: synthesis, assembly, and optical applications,” J. Phys. Chem. B 109(29), 13857–13870 (2005). 10.1021/jp0516846 [DOI] [PubMed] [Google Scholar]
- Jain P. K., Lee K. S., El-Sayed I. H., and El-Sayed M. A., “Calculated absorption and scattering properties of gold nanoparticles of different size, shape, and composition: applications in biological imaging and biomedicine,” J. Phys. Chem. B 110(14), 7238–7248 (2006). 10.1021/jp057170o [DOI] [PubMed] [Google Scholar]
- Jennings T. and Strouse G., “Past, present, and future of gold nanoparticles,” Adv. Exp. Med. Biol. 620, 34–47 (2007). 10.1007/978-0-387-76713-0_3 [DOI] [PubMed] [Google Scholar]
- Copland J. A., Eghtedari M., Popov V. L., Kotov N., Mamedova N., Motamedi M., and Oraevsky A. A., “Bioconjugated gold nanoparticles as a molecular based contrast agent: implications for imaging of deep tumors using optoacoustic tomography,” Mol. Imaging Biol. 6(5), 341–349 (2004). 10.1016/j.mibio.2004.06.002 [DOI] [PubMed] [Google Scholar]
- Oraevsky A., Karabutov A., and Savateeva E., “Enhancement of optoacoustic tissue contrast with absorbing nanoparticles,” Proc. SPIE 4434, 60–69 (2001). 10.1117/12.446693 [DOI] [Google Scholar]
- Weissleder R., “A clearer vision for in vivo imaging,” Nat. Biotechnol. 19(4), 316–317 (2001). 10.1038/86684 [DOI] [PubMed] [Google Scholar]
- Oraevsky A. A., “Gold and silver nanoparticles as contrast agents for optoacoustic imaging,” in Photoacoustic Imaging and Spectroscopy, Wang L. V., Ed., Taylor and Francis Group, New York: (2009). [Google Scholar]
- Homan K., Mallidi S., Cooley E., and Emelianov S., “Combined photoacoustic and ultrasound imaging of metal nanoparticles in vivo,” in Nanoimaging, Goins B. and Phillips W., Eds., Pan Stanford Publishing, Singapore: (2010). [Google Scholar]
- Jain R. K., “Transport of molecules, particles, and cells in solid tumors,” Annu. Rev. Biomed. Eng. 1, 241–263 (1999). 10.1146/annurev.bioeng.1.1.241 [DOI] [PubMed] [Google Scholar]
- Brannon-Peppas L. and Blanchette J. O., “Nanoparticle and targeted systems for cancer therapy,” Adv. Drug Delivery Rev. 56(11), 1649–1659 (2004). 10.1016/j.addr.2004.02.014 [DOI] [PubMed] [Google Scholar]
- El-Sayed I. H., Huang X., and El-Sayed M. A., “Surface plasmon resonance scattering and absorption of anti-EGFR antibody conjugated gold nanoparticles in cancer diagnostics: applications in oral cancer,” Arch. Hist. Exact Sci. 5(5), 829–834 (2005). [DOI] [PubMed] [Google Scholar]
- Kumar S., Aaron J., and Sokolov K., “Directional conjugation of antibodies to nanoparticles for synthesis of multiplexed optical contrast agents with both delivery and targeting moieties,” Nat. Protoc. 3(2), 314–320 (2008). 10.1038/nprot.2008.1 [DOI] [PubMed] [Google Scholar]
- Shah J., Aglyamov S. R., Sokolov K., Milner T. E., and Emelianov S. Y., “Ultrasound imaging to monitor photothermal therapy—feasibility study,” Opt. Express 16(6), 3776–3785 (2008). 10.1364/OE.16.003776 [DOI] [PubMed] [Google Scholar]
- Shah J., Park S., Aglyamov S., Larson T., Ma L., Sokolov K., Johnston K., Milner T., and Emelianov S. Y., “Photoacoustic imaging and temperature measurement for photothermal cancer therapy,” J. Biomed. Opt. 13(3), 034024 (2008). 10.1117/1.2940362 [DOI] [PMC free article] [PubMed] [Google Scholar]
- O’Neal D. P., Hirsch L. R., Halas N. J., Payne J. D., and West J. L., “Photo-thermal tumor ablation in mice using near infrared-absorbing nanoparticles,” Cancer Lett. 209(2), 171–176 (2004). 10.1016/j.canlet.2004.02.004 [DOI] [PubMed] [Google Scholar]
- Peterson M. S., Bouwman J., Chen A., and Deutsch M., “Inorganic metallodielectric materials fabricated using two single-step methods based on the Tollen’s process,” J. Colloid Interface Sci. 306(1), 41–49 (2007). 10.1016/j.jcis.2006.10.013 [DOI] [PubMed] [Google Scholar]
- ANSI, “Orlando: Laser Institute of America,” American National Standard for Safe Use of Lasers, ANSI Z136.1 (2000).
- Zhu M., Qian G., Ding G., Wang Z., and Wang M., “Plasma resonance of silver nanoparticles deposited on the surface of submicron silica spheres,” Mater. Chem. Phys. 96, 489–493 (2006). 10.1016/j.matchemphys.2005.07.040 [DOI] [Google Scholar]
- Yong K. T., Sahoo Y., Swihart M. T., and Prasad P. N., “Synthesis and plasmonic properties of silver and gold nanoshells on polystyrene cores of different size and of gold-silver core-shell nanostructures,” Colloids Surf., A 290(1–3), 89–105 (2006). 10.1016/j.colsurfa.2006.05.004 [DOI] [Google Scholar]
- Aaron J., Nitin N., Travis K., Kumar S., Collier T., Park S. Y., Jose-Yacaman M., Coghlan L., Follen M., Richards-Kortum R., and Sokolov K., “Plasmon resonance coupling of metal nanoparticles for molecular imaging of carcinogenesis in vivo,” J. Biomed. Opt. 12(3), 034007 (2007). 10.1117/1.2737351 [DOI] [PubMed] [Google Scholar]
- Jain P. K. and El-Sayed M. A., “Universal scaling of plasmon coupling in metal nanostructures: extension from particle pairs to nanoshells,” Arch. Hist. Exact Sci. 7(9), 2854–2858 (2007). [DOI] [PubMed] [Google Scholar]
- Mallidi S., Larson T., Tam J., Joshi P. P., Karpiouk A., Sokolov K., and Emelianov S., “Multiwavelength photoacoustic imaging and plasmon resonance coupling of gold nanoparticles for selective detection of cancer,” Nano Lett. 9(8), 2825–2831 (2009). 10.1021/nl802929u [DOI] [PMC free article] [PubMed] [Google Scholar]
- Hirsch L. R., Gobin A. M., Lowery A. R., Tam F., Drezek R. A., Halas N. J., and West J. L., “Metal nanoshells,” Ann. Biomed. Eng. 34(1), 15–22 (2006). 10.1007/s10439-005-9001-8 [DOI] [PubMed] [Google Scholar]
- Pitsillides C. M., Joe E. K., Wei X., Anderson R. R., and Lin C. P., “Selective cell targeting with light-absorbing microparticles and nanoparticles,” Biophys. J. 84(6), 4023–4032 (2003). 10.1016/S0006-3495(03)75128-5 [DOI] [PMC free article] [PubMed] [Google Scholar]
- Matzler C., “MATLAB Functions for Mie Scattering and Absorption” (2002), http://www.iap.unibe.ch/publications/download/199/en/.
- Patel C. K. N. and Tam A. C., “Pulsed optoacoustic spectroscopy of condensed matter,” Rev. Mod. Phys. 53(3), 517–550 (1981). 10.1103/RevModPhys.53.517 [DOI] [Google Scholar]
- Sethuraman S., Aglyamov S. R., Smalling R. W., and Emelianov S. Y., “Remote temperature estimation in intravascular photoacoustic imaging,” Ultrasound Med. Biol. 34(2), 299–308 (2008). 10.1016/j.ultrasmedbio.2007.07.021 [DOI] [PMC free article] [PubMed] [Google Scholar]
- Eghtedari M., Oraevsky A., Copland J., Kotov N., Conjusteau A., and Motamedi M., “High sensitivity of in vivo detection of gold nanorods using a laser optoacoustic imaging system,” Arch. Hist. Exact Sci. 7(7), 1914–1918 (2007). [DOI] [PubMed] [Google Scholar]
- Brett D. W., “A discussion of silver as an antimicrobial agent: alleviating the confusion,” Ostomy Wound Manage 52(1), 34–41 (2006). [PubMed] [Google Scholar]
- Clement J. L. and Jarrett P. S., “Antibacterial silver,” Metal-Based Drugs 1, 467–482 (1994). 10.1155/MBD.1994.467 [DOI] [PMC free article] [PubMed] [Google Scholar]
- Ip M., Lui S. L., Poon V. K. M., Lung I., and Burd A., “Antimicrobial activities of silver dressings: an in vitro comparison,” J. Med. Microbiol. 55, 59–63 (2006). 10.1099/jmm.0.46124-0 [DOI] [PubMed] [Google Scholar]
- Ovington L. G., “The value of silver in wound management,” Podiatry Today 12, 59–62 (1999). [Google Scholar]
- Jackson J. B. and Halas N. J., “Silver nanoshells: variations in morphologies and optical properties,” J. Phys. Chem. B 105(14), 2743–2746 (2001). 10.1021/jp003868k [DOI] [Google Scholar]
- Auer J., Berent R., Ng C. K., Punzengruber C., Mayr H., Lassnig E., Schwarz C., Puschmann R., Hartl P., and Eber B., “Early investigation of silver-coated Silzone heart valves prosthesis in 126 patients,” J. Heart Valve Dis. 10(6), 717–723 (2001). [PubMed] [Google Scholar]
- AshaRani P. V., Low Kah Mun G., Hande M. P., and Valiyaveettil S., “Cytotoxicity and genotoxicity of silver nanoparticles in human cells,” ACS Nano 3(2), 279–290 (2009). 10.1021/nn800596w [DOI] [PubMed] [Google Scholar]
- Doiron A. L., Homan K. A., Emelianov S., and Brannon-Peppas L., “Poly(lactic-co-glycolic) acid as a carrier for imaging contrast agents,” Pharm. Res. 26(3), 674–682 (2009). 10.1007/s11095-008-9786-x [DOI] [PMC free article] [PubMed] [Google Scholar]


