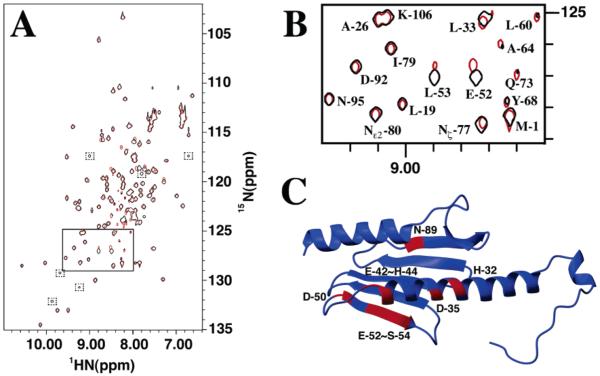
Figure 3.
NMR chemical shift mapping of frataxin residues that interact with iron. (A) 1H–15N HSQC spectra for frataxin in the presence (red) and absence (black) of iron. The iron spectrum was collected at a 2:1 iron:protein stoichiometric ratio. Peaks boxed with dashed lines are present only in the iron spectrum at low threshold levels. The region boxed with a solid line is expanded in Figure 4B. (B) Expansion of the region in the 15N HSQC spectrum for frataxin in the presence (red) and absence (black) of iron. (C) Residues identified on the apofrataxin structure that have normalized chemical shift (δ) values greater than 1 (colored red).

